You will ask yourself, "how did he know silver would do that"?On Fri Jan 30th, I suggested that the top was in for silver and it was soon about to dump further into my bearish target (T2). Silver was $94.6 at that time, and there were no news narratives suggesting a crash. By Monday it dumped to $71 and now the news platforms and influencers have "reasons" why it did. "Show me the chart and I'll tell you the news"
TA works!
May the trends be with you.
Silversignal

Wait for HL to print!SILVER Analysis
Closed at 85.169 (30-06-2026)
74 - 76 is an important Support zone.
if this level is sustained, we may witness Higher Low
printed around this level & the uptrend may continue.
Crossing 121 - 122 may expose new Highs.
However, Breaking 70 may bring the price towards 62 - 63 which
is the next Important Support level.

Silver Panic Drop → Distribution at 85 |Sell-Side Liquidity PlayOne day before this setup, Silver printed a heavy bearish displacement
from 121.6920 → 74.2869 — clear panic selling.
That move already told us one thing:
buyers were forced out, control shifted to sellers.
Now price has retraced and is distributing near 85.5144, forming a double top before the 0.5 Fibonacci retracement.
🧠 Trade Logic:
Strong bearish impulse = bearish bias
Retracement = corrective, not bullish
Double top near 85.5144 = early distribution
Entry taken before full 0.5 Fib
Stop-loss placed beyond 0.5 Fib (clean invalidation)
Target = sell-side liquidity below recent lows
This is not chasing price.
This is selling weakness after a panic move.
If price holds above 0.5 Fib → idea invalid.
If sellers stay in control → liquidity is the magnet.
👉 Like if you trade structure
👉 Comment if you see the same distribution
👉 Follow for clean, no-noise metals setups

Trade Idea on Silver - Buy SetupSilver Buy Setup on 15min TF
Entry: 87 (Buy stop on BOS)
SL:74 (Below LL)
TP: 123.9 (Above ATH)
RR: 1:3
Confluences:
- Once BOS on 15min
- Once Alligator mouth opened

Has Silver topped this week? Did the silver bullet train just reach it's final stop?
If silver has topped, I anticipated it will follow this pattern down to a 30-50% drop. I've been riding this silver parabolic wave up with silver miners (Coeur mining -CDE), but sold all my positions this week.
If this is the top for silver, then I will buy CDE back at $14 (currently $21)
Trade safe with precious metals. Even if I'm wrong, and silver has another leg up...there is no sense in taking a chance on picking up pennies in front of a bulldozer.
May the trends be with you

SILVER(XAGUSD): Price Heading Towards $109! Dear Traders,
Silver has made a slight correction and then reversed nicely. Now we’re seeing a significant surge in market volume. There’s only one take-profit and entry point. The stop-loss can be placed below our blue-marked entry box. This move could be substantial if it goes our way.
This trade could be completed within this week or next, assuming the volume remains constant.
Team Setupsfx_

Silver 10-14% correction time??? Bearish divergence on 4hr and now its breaking the HL as well.
Seeems like a beautiful 1:3RR probable setup for a short

New ATH at 96, But Is the Market Done “ATH-ing” for Now?Yesterday, Silver pushed toward 96 and printed what has become almost normal lately: another new all-time high.
As expected, once that level was reached, volatility exploded — and fortunately, I managed to catch a quick counter-trend scalp, banking around 1,100 pips in a short amount of time.
But the real question now is not about yesterday’s spike.
👉 Is Silver done making ATHs for now?
In my opinion: yes. At least temporarily.
🔎 Context: A Huge Move, and the Market Is Starting to Change Behavior
Since the beginning of the year, Silver is up more than 30%.
But more important than the percentage gain is the price behavior since Monday:
- after the weekend gap up
- the very short-term structure shifted into a topping formation
- rallies into 95 and slightly above are consistently being sold
That is typically the first sign that the market is moving from pure momentum mode into distribution / exhaustion mode.
It doesn’t mean the long-term trend is broken.
It simply means the upside is starting to get crowded, and the risk-reward changes completely.
⚠️ Technical Confirmation Level
For me, the correction becomes “real” if we get:
👉 a clean break below 92.70
If that happens, the most logical next move is:
🎯 90 zone — mainly for filling the weekend gap
And if the breakdown accelerates, I wouldn’t be surprised to see:
➡️ 85–86 zone as an extended correction target
Markets rarely move in perfect steps — and when a parabolic run starts to unwind, it can surprise both sides.
📌 Trading Plan (Short-Term Only)
My approach going forward is straightforward:
👉 Sell rallies
✅ as long as 96 remains the ATH / ceiling
This is not a “long-term bearish call”.
This is a short-term tactical trade in a market that may finally be ready to breathe.
P.S. (For Those Who Don’t Understand but Still Comment)
1️⃣ Long term, I’m extremely bullish Silver.
I wrote about it recently and nothing has changed on the macro view.
2️⃣ Yes, this is counter-trend.
That’s the point — it’s a correction trade, not a trend reversal call.
3️⃣ If I take it, it’s short-term only.
No “marriage” with the position.
4️⃣ I know how to take a loss.
And I take it fast when the market proves me wrong.
5️⃣ If targets don’t get hit, I know how to manage exits.
Break-even, small loss, small profit — I’m not here to “hope”.
In markets like this, discipline matters more than prediction. 🚀

XAG Analysis
The 15-minute analysis reveals a consolidation area that has broken upwards.
Target can reach the top of the channel, but to be cautious, close your positions before reaching it.
The price is in a sharp bullish uptrend channel and is approaching the upper boundary.
The daily candle closes higher than all previous days.
Stay Tuned for our next updates!
@SHARP-SHOT

#SILVER: Swing Buying Up To Yearly End Target Of $100XAGUSD(SILVER) ANALYSIS🎇
🔺After a big rally, silver took a dip, dropping about $70 from its high of $82. But don’t worry, it’s bounced back from $70 and is now trading at $80, with a chance to hit $85 by the end of January. The market is a bit wild right now, mostly because of recent political stuff.
🔺We’ve got three potential goals for this swing trade: we’re aiming for a first target at $85, then a second at $90 and a final one at $100. This plan is for a longer stay, maybe even a year. But since things have been so up and down lately, we’re betting the price will keep climbing.
🔺If you think our analysis is helpful, please give us a thumbs up and share your thoughts in the comments.
SetupsFX Team👨💻🏆

XAG Analysis
15 min analysis shows consolidation area. Any side breaks with strong close of candle out of the box, I will open position. Blue line is 70% of the previous bearish move passing is another confirmation for another bullish leg.
Target can be top of the channel but there might be another bottom touch before hitting top, so manage your positions and close some portion to save your profit.
Weekly candle close was above all other weeks.
Stay tuned for our next updates.

Silver Analysis
4h analysis shows the reaction on resistance area and price could hold itself above it. which is %70 of the bearish move. So bullish signal (blue box)
Daily candle closed above all other days. another bullish signal. (yellow line)
According to ichimoku and fibo this area is important so signal of bullish.
we are close to the top of first channel, will publish update later.
Stay tuned for our next updates.

Silver Analysis
Daily candle closed above tha last 3 days, bulish signal. (purple line)
4h analysis shows the reaction on resistance area (blue) that sellers were not strong enough to bring the price to lower low, additionally this area is valid if we use Ichimoko indicator too, so if candle close above this area we can join buyers.
Stay tuned for our next updates.

XAGUSD Analysis
Silver is in a bullish channel, with a few attempts to break the dynamic resistance (green). As long as the price does not hold below the strong support area (pink), we expect the price to continue moving upward. The important area that may stop the bearish movement is the first resistance area (blue).
Stay tuned for our next updates.

Silver’s 2025 Explosion — How High Can It Go?In 2025, Silver ( OANDA:XAGUSD ) has experienced a remarkable surge, making it one of the most notable assets of the year. As we approach the end of 2025, I’ve decided to analyze silver to see how far its bullish trend might continue. So, stay with me as we delve into the reasons behind silver’s rise and explore how far this upward momentum could go.
Let’s begin by looking at the fundamental factors driving silver’s increase in 2025. After that, we’ll move on to the technical analysis.
Fundamental Drivers Behind Silver’s Massive 2025 Rally:
Structural Supply Deficit — Multi‑year deficits draining inventories, tight physical market.
Strong Industrial Demand — Solar, EVs, semiconductors & data centers consuming silver at record levels.
Rate Cut Expectations — Anticipated Fed easing lifts non‑yielding assets like silver.
Safe‑Haven Flows — Geopolitical risk, inflation, and a softer dollar boosting precious metals demand.
Liquidity & Momentum — Smaller market vs gold( OANDA:XAUUSD ) amplifies swings, attracting speculators.
Silver has surged ~ 150–165% YTD , setting fresh all‑time highs as both an industrial metal and investment hedge.
-----------------------
Technical Analysis:
Now, considering the technical side, with less than five days remaining before the six-month and one-year candles close, I’ll focus on a higher time frame for silver’s analysis. Recently, silver achieved a new all-time high, capturing widespread attention, and many prominent figures are now discussing silver’s potential.
From a classic technical analysis perspective on the six-month time frame, it appears that silver has formed a bullish continuation pattern, specifically a cup and handle pattern, and the recent six-month candle has broken the neckline/resistance zone($50-$34) with strong volume. This suggests that the bullish trend for silver is likely to continue.
From an Elliott Wave perspective, it seems that silver is completing wave 3, potentially within an ascending channel and a Potential Reversal Zone(PRZ) .
I expect that silver, upon entering this Potential Reversal Zone(PRZ) , will undergo a correction. If you’re considering adding silver to your portfolio, it’s wise to wait for that correction, as buying at all-time highs can be riskier due to the strong upward momentum.
What do you think? How far can silver’s bullish trend extend, and what levels might we see in 2026?
💡 Please respect each other's opinions and express agreement or disagreement politely.
📌 Silver/ U.S. Dollar Analyze (XAGUSD), 6-month time frame.
🛑 Always set a Stop Loss(SL) for every position you open.
✅ This is just my idea; I’d love to see your thoughts too!
🔥 If you find it helpful, please BOOST this post and share it with your friends.

Silver Analysis
Silver is close to an important resistance, it reacted a few times and could not breakthrough but did not make lower lows too, so still market is bullish.
Stay alert on resistance line (red line) and with confirmation you can join buyers.
Stay tuned for our next updates.

XAG Analysis
Here is my view for today on XAG.
As per the previous analysis the purple line is important resistance as you see we have had a few reactions on 4h timeframe. need to see how its gonna pass this resistance area and with confirmation decide whether to enter or wait.
Check the yesterday's analysis and How much did yo guys made with our last analysis? ;)
Stay tuned for our next updates.

Silver Fibonacci Analysis 03/02/2021simply showing the power of Fibonacci
we had seen a Bullish Divergence and Hidden Bullish Divergence on MACD and by the confluences of 4 Fibonacci tools (Retracement, Extension, Projection, Time Zones) in an ascending Chanel...
So we are
Speculating...$$$
A TP Zone Starting from 39.43$ to 41.16$
a Safe and Sure TP can be 39.43$
It is a Swing Trade and it Shall take Few weeks time to develop.
I am expecting the TP to happen at middles of April 2021,
Please thanks Me In the Comments when you enjoyed your 125250 PIPS of Joyful Profits.


SilverXAGUSD
- Bullish Channel as an corrective pattern in Short Time Frame
- RSI - Divergence
- Completed " 1234 " Impulsive Waves
- Break of Structure
- S / R Level

Silver Hits New ATH — Major Reversal Zone Ahead? Bearish SetupSilver( OANDA:XAGUSD ) managed to increase by more than +20% over the last 10 trading days, creating a new All-Time High(ATH) and attracting the attention of many traders in the financial markets.
Silver is currently near Potential Reversal Zone(PRZ) , Yearly Resistance(5), Monthly Resistance(1), and the round number $60.00.
Silver also managed to break the support line, which indicates weakness in the uptrend.
In terms of classic technical analysis, silver managed to rise with the help of the ascending triangle pattern, but we must keep in mind that this pattern is a weak continuation.
In terms of Elliott Wave theory, silver is completing the main wave 5, and this wave could complete at PRZ.
Additionally, we’re noticing a Regular bearish Divergence(RD-) between the price peaks, which adds to the bearish sentiment.
I expect silver to drop to at least $55.10 after breaking the support zone($56.83-$56.37).
First Target: $55.10
Second Target: $53.73
Stop Loss(SL): $61.63(Worst)/$60.54
Do you think silver can go above $60?
💡 Please respect each other's opinions and express agreement or disagreement politely.
📌 Silver/ U.S. Dollar Analyze (XAGUSD), 4-hour time frame.
🛑 Always set a Stop Loss(SL) for every position you open.
✅ This is just my idea; I’d love to see your thoughts too!
🔥 If you find it helpful, please BOOST this post and share it with your friends.

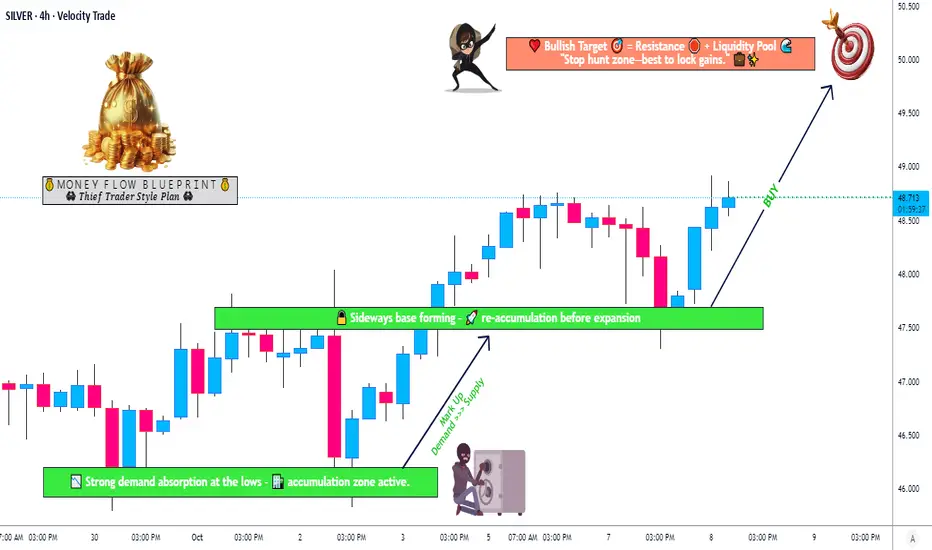
Silver Price Action Update – Smart Money Reaccumulation PhaseXAG/USD "SILVER vs U.S. DOLLAR" — Metal Market Cash Flow Management Strategy 💰
Thief Strategy | Layered Entry | Swing / Day Trade Plan
🧭 Plan Overview
The Bullish momentum in Silver (XAG/USD) has been confirmed through accumulation and re-accumulation phases, signaling a potential continuation move upward.
Smart money appears to be building positions below major resistance — time for us to follow the metal flow. ⚙️
💎 Entry Plan — Thief Layer Style
Thief Strategy = Layered Limit Entries 🧠
We use multiple limit orders to build a smarter position gradually — instead of chasing the price.
Entry Layers:
47.500
48.000
48.500
(You can add more layers based on your own plan and risk appetite.)
🛑 Stop Loss (SL)
This is the Thief SL @47.000.
However, dear Ladies & Gentlemen (Thief OGs) — please manage your own risk.
It’s your money, your strategy, and your exit. 💼
“Make money → Take money → Protect money.”
🎯 Target Zone
A strong resistance zone + overbought conditions may create a trap at the highs.
So, when Silver reaches around $50.000, be smart and secure your profits before the metal traps the late buyers.
Remember: we steal profits, not dreams. 🕶️
💬 Note from the Thief OG
This is a Thief-style strategy — meant for educational fun and insight sharing.
Not a signal service or financial advice.
Use your own judgment and always plan your risk ahead of your entries.
Let’s manage our cash flow, not our emotions. ⚖️
🌍 Related Pairs to Watch (Correlation Check)
OANDA:XAUUSD (Gold) → Often moves in sync with Silver; watch for Gold strength confirmation.
💵 TVC:DXY (U.S. Dollar Index) → Inverse correlation; a weaker USD supports Silver upside.
💰 OANDA:AUDUSD & OANDA:NZDUSD → Commodity-linked currencies; bullish moves support Silver’s strength.
OANDA:XCUUSD → Industrial metals correlation; when Copper rallies, Silver often follows.
Keep your eyes on these pairs — they reveal how liquidity shifts across the metals and forex markets.
✨ “If you find value in my analysis, a 👍 and 🚀 boost is much appreciated — it helps me share more setups with the community!”
⚠️ Disclaimer:
This is a Thief-style trading strategy — shared just for fun and educational purposes.
Always do your own research and trade responsibly. 🧩
#XAGUSD #SilverAnalysis #MetalsMarket #SwingTrade #DayTrading #TechnicalAnalysis #ThiefStrategy #LayeredEntry #CommodityTrading #SmartMoney #BullishSetup #TradingViewCommunity #MarketFlow #TradeResponsibly
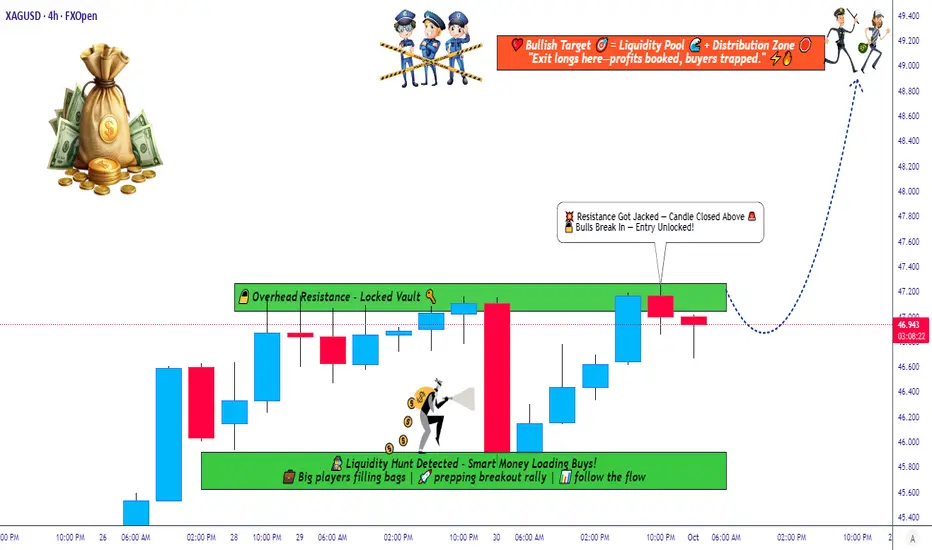
Silver Strategy Map — Thief Layers, Smart Targets, and Risk Zone📊 XAG/USD “Silver vs U.S Dollar” — Metals Market Wealth Strategy Map (Swing/Day Trade)
🔑 Plan: Bullish Setup
This setup follows the “Thief Strategy”, which means using layered limit entries to scale into the trade. Instead of going all-in at one level, we “steal the entries” across multiple layers.
💰 Layered Buy Limit Entries (Example Setup):
46.200
46.400
46.600
46.800
47.000
👉 You can increase layers as per your own plan and risk style.
🛑 Stop Loss (Protective Exit): 45.600
(This is my thief SL — but you’re free to adjust as per your own risk appetite.)
🎯 Target Zone: 49.000
⚠️ Around 49.300, we see a “Police Barricade” (heavy resistance + overbought conditions + potential trap).
That’s where profits should be taken — escape with gains before the trap closes!
Why This Setup?
Support Zones: Strong accumulation zones forming near 45.600–46.000.
Trend Bias: Silver remains bullish in the medium-term metals market outlook.
Layering Strategy Advantage: Reduces entry risk and allows better average fill.
Profit Zone: 49.000 aligns with strong supply area + RSI extension risk.
🔗 Correlation & Related Pairs to Watch
OANDA:XAUUSD (Gold vs USD): Gold often leads Silver’s moves — watch Gold for early signals.
TVC:DXY (US Dollar Index): A weaker USD usually boosts metals.
TVC:PLATINUM & CAPITALCOM:PALLADIUM : Industrial metals correlation — strong moves here can influence Silver sentiment.
TVC:SILVER Futures: Always track COMEX Silver contracts for volume confirmation.
✨ “If you find value in my analysis, a 👍 and 🚀 boost is much appreciated — it helps me share more setups with the community!”
📌 Disclaimer: This is a Thief-style trading strategy, created just for fun and educational sharing. Not financial advice — trade at your own risk.
#XAGUSD #Silver #Metals #TradingStrategy #SwingTrade #DayTrade #ThiefStrategy #Gold #DXY #Forex #Commodities