Silver: Profit can be made by short selling in this area
Time is fair. Whether you are lazy or hardworking, time will gradually give you the answer that belongs to you. Those who cherish time will be cherished by time!
Currently, the pressure on silver is concentrated in the 21.5 area, where short selling can still be repeated. Silver has not followed the recent rise in gold prices, largely due to previous pressure. Currently, silver is more closely following the trend of commodities, similar to oil. After all, there will only be industrial demand in the later stages of economic recovery.
At present, it is still in a period of economic recession, so there is naturally no significant upward movement. However, after the stabilization of gold adjustments in the later stages, if they both rise simultaneously again, silver's rise will definitely be greater than gold's.
Furthermore, there is a possibility that the dark horse will continue to test historical highs in the future. Currently, short selling is still recommended at the 20-21 area with a stop loss at 22, and long positions can be tentatively initiated in batches near 19.5.
Silvertrade
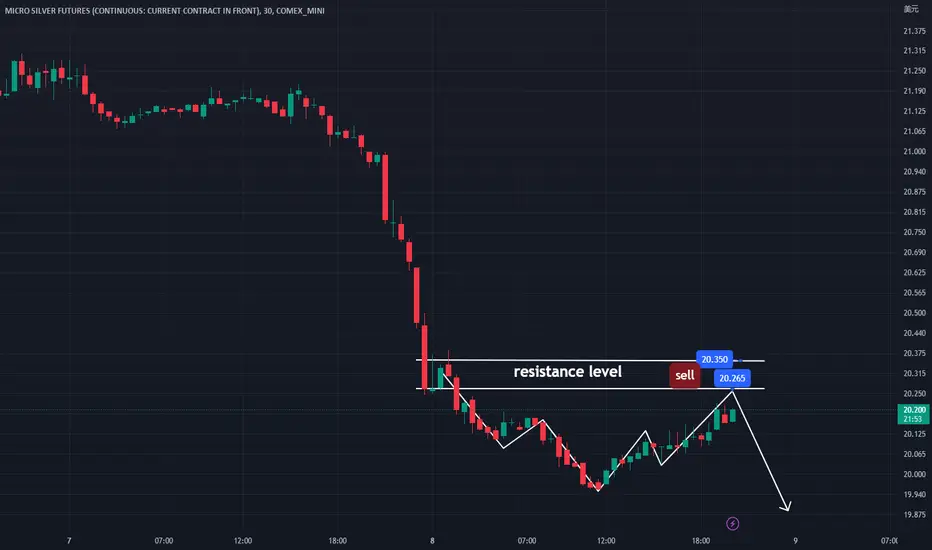
silver will be falling in the next weekthe silver XAGUSD will have to make a correction to 21.20$ and maybe to the 21.40 area as well before the continuation of the downtrend to the 20.33 area. also, there is a great probability that the market can go down without making a correction!
that's what I believe. what about you guys? what do you think? tell me your opinion. do you agree or not .??
good luck traders !!

The Road to $80 for SilverThe silver market began the initial subwave of a new, major impulsive wave, marked as the third in a sequence. This cyclical pattern can be traced back to the year 1932, with the completion of wave one in 1968, the corrective wave two in 1971, the impulsive wave three in January 1980, the corrective wave four in 1991, and ultimately, a truncated fifth wave that reached its peak in April 2011. This entire sequence can be considered as the first impulsive wave in an even higher degree. The second corrective wave ended in March 2020, with support being found at the 0.236 Fibonacci level. Currently, silver is preparing for what is expected to be the most explosive and unpredictable impulsive wave three in a very long-term scale.
Resistance points include:
— $24.69 (0.382 Fibonacci extension)
— $26.55 (0.238 Fibonacci extension)
— $31.99 (0.382 Fibonacci extension, last wave)
— $43.73 (0.5 Fibonacci extension, last wave)
— $45.29 (0.382 Fibonacci extension level)
— $49.83 (all-time high)
— $59.77 (0.618 Fibonacci extension, last wave)
— $83.11 (0.618 Fibonacci; golden ratio)

HUGE multi-decade cup & handle pattern on Silver?I have to admit, the possibility is compelling. A 43-year pattern nearing completion and leading to a $600+ target. What do y'all think? Do you currently hold silver? Does this possibility make you more interested in holding some/more?
p.s. Had to reproduce this chart because the other one was taken down by Tradingview since I posted my company info on the chart. Absolute dumbest damn rule, especially when applied against the very people who pay them so much money every year. You pay them a ton of money and then are forced to promote your business how they say, which is far from optimal. Absolutely stupid and alienating. Thankfully there are MANY other competing platforms out there that understand they are just a tool in your business, so they don't attempt to control how you use their platform to promote your business. This allows us to utilize them in the most beneficial manner possible which increases the likelihood we will remain with them.

Silver Levels & Strategy for next few daysDear traders, I have identified chart levels based on my analysis, major support & resistance levels. Please note that I am not a SEBI registered member. Information shared by me here for educational purpose only. Please don’t trust me or anyone for trading/investment purpose as it may lead to financial losses. Focus on learning, how to fish, trust on your own trading skills and please do consult your financial advisor before trading.
Sagar Bhai, Silver had an excellent run in last 1 month from below 55K level to 63K plus level. Silver has made LH-Lower High pattern on chart, trading below VWAP. Showing sign of tiredness after decent up move. Silver is likely to consolidate or correct from this level. This is a good time to book profit. 59000 to 60000 should be good range to enter in long position for few months. We are likely to get a chance near next US FED hike when US Dollar Index will get stronger. Please review & share your thoughts as well.

Silver-XAGUSDThis is an opportunity for professionals.
According to my analysis, the trend is still bearish.
FOMC is an important news that has a big impact on the price of symbols.
In my opinion, this time will cause more icons to fall.
Follow me, like, comment, and any questions.
Caution today has important news so observe the money management .

20 REASON FOR BUY SILVER 1 Structure analysis time frame DAILY
2 target time frame :DAILY
3 Current Move :IMPULSE
4 Entry Time Frame : H4
4.1 Entry TF Structure: BULLISH
4.2 entry move : CORRECTIVE
5 Suppot resistence base :H4 FAIR VALUE GAP
6 FIB: DISCIUNTED AREA FILLED
7 candle Pattern: PANIC BOTTOM
8 Chart Pattern: LOWER HIGH
9 Volume : AVERAGE
10 Momentum UNCONVENTIONAL Rsi: SIDEWAYS
11 Volatility measure bollinger bands: LOWER BAND FAKE BREAKOUT BULLISH
12 strength ADX: SIDWWAYS
13 Sentiment ROC: BULLISH
14 final comment : LONG
15 : decision : BUY
16 Entry: 19.178
17 Stop losel: 18.968
18 Take profit: 20.950
19 Risk to reward Ratio: 1:10
Excepted Duration : 5 DAYS

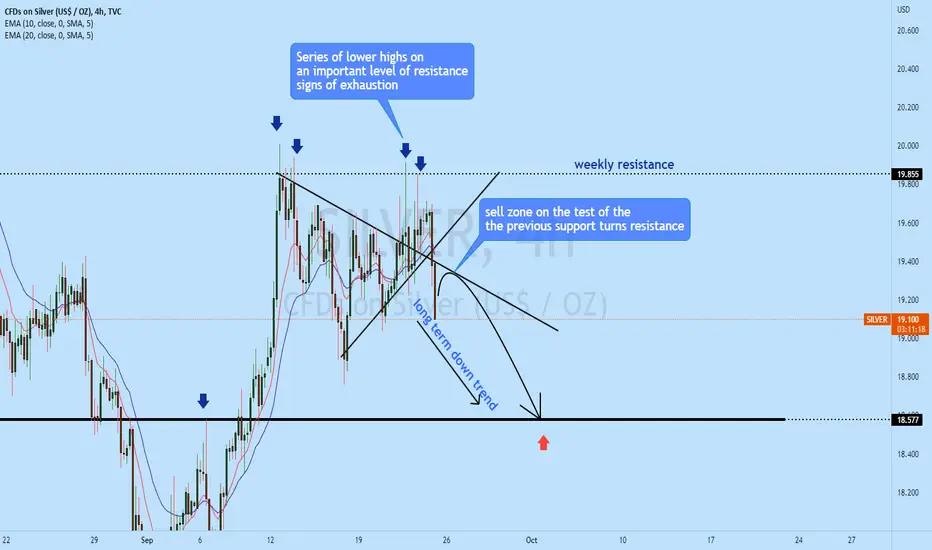
SILVER possible sell zone!!SILVER 4h has been rejected from the weekly resistance creating a series of lower highs with multiple rejections. As the long-term trend is down, GOLD silver has broken out of the local structure and the highly likely price will continue to drop. On the retest of the previous support as resistance, as sell trade is high probable.
Press the like button if you enjoy this content :)
DOW / SILVER RATIO ANALYSISBased on the weekly chart, I see the DOW / XAGUSD ratio as rising in the past
year. I see this as meaning the DOW stocks have been valued by market participants
as compared with the valuation of silver. Further, I see the relative strength of
the ratio showing some bearish divergence of late. The DOW stocks are
challenged by the current macroeconomics and federal policies. In the meanwhile,
the gold to silver ratio is at historical highs. Silver industrial consumption is rising
now due to the electric vehicle revolution and the increasing momentum of
the solar power sector was recently enhanced by the suspension of federal tariffs
on solar cell panels. I expect the ratio to top out and reverse in a combination
of a continued bear market for stock equities and a silver bull run.

SILVER, possible reversal?Silver(4h) has formed a double top after breaking the monthly doji. Today, after opening, the price has formed a bearish price action, with a gap opening. It is likely that the price is likely to drop to the monthly level of support.
If you enjoy this content, press the like button :)

XAGUSD Short Tram BUY signal....NOW
AronnoFX will not accept any liability for loss or damage as a result of
reliance on the information contained within this channel including
data, quotes, charts and buy/sell signals.
If you like this idea, do not forget to support with a like and follow.
Traders, if you like this idea or have your own opinion about it,
write in the comments. I will be glad.

XAGUSD Silver : The bull run of the century? 26.4Hey guys!
I'm covering what could be the biggest potential precious metal for the coming year
In the video you can expect to learn about the big picture chart pattern and shorter-term expectations with practical ideas to take advantage of it.
Inflation is on the loose with probably the worst it's ever been in modern history and Silver is a natural hedge to that.
Of course trade safe and responsible while doing your own research.
-----------------------------------------------------------------------------------------------------------------------------------------------------
If you liked my idea please like and follow - It would mean the world to me :)
I'm available for any questions and promise to answer all comments.
My goal is to help as many traders as I can!
---------------------------------------------------------------------------------------------------------------------------------------------------

SILVER top-down analysisHello traders, this is the full breakdown of this pair. We will take this trade if all the conditions are satisfied as discussed in the analysis. Smash the like button if you find value in this analysis and drop a comment if you have any questions or let me know which pair to cover in my next analysis.

What will be tomorrow’s gold and silver price?Gold and silver may be looking to make some big moves at the end of this week, as the heavyweight of inflation data is released.
US inflation is released on Thursday, and investors will immediately be trying to determine what the results and the subsequent commentary from Fed officials could mean for gold and silver.
As it stands, the market is expecting US inflation (YoY to January) to be 7.3%, and for the US Federal Reserve to strongly signal a rate hike of 0.25% in its next meeting, to be implemented in March.
More forceful and frequent commentary from Fed officials concerning an initial rate hike greater than 0.25% could significantly move the gold and silver markets. For now, this is a scenario that is largely dismissed when put to Fed officials like Cleveland Federal Reserve President Loretta Mester. However, Atlanta Federal Reserve President Raphael Bostic appears more receptive to the idea, so the possibility of a 50bp hike is definitely on the table, especially if US inflation data records something closer to 8.00%.
A more aggressive rate hike of 0.50% from the Fed could have diametric consequences for the price of gold and silver. The direction gold and silver take depends on investors' sentiment concerning whether they believe the Fed is being unreasonably aggressive.
Working in tandem, or at least in part influencing the above-mentioned investor sentiment, could be the technical conditions of gold (XAUUSD) and silver (XAGUSD).
Golds recent trading pattern has set some clear support and resistance zones. Price levels that should be paid attention to for clean breaks above or below include US $1,831.00 and US $1835.50. Further afield, the levels US $1,825.60 and US $1,838.50, should be kept in the back of traders' minds for extra volatile markets. At the time of writing, XAUUSD is trading at US $1,834.00.
An analysis of the price of silver is more complicated without some nice support and resistance levels to reference. We will turn to the moving averages for this metal to find where silver may find some resistance in a bullish environment. XAG is currently trading at US $23.23 per ounce, immediately beneath the 20 and 50-day moving average, which have converged at approximately US $23.25. This is not a strong resistance as the RSI is on the side of some upwards momentum. But it would be prudent to note these price levels in conjunction with the 200-day moving average, which is at US $23.13.

Silver can roll back to supportSilver has had a very good start of the year, with the precious metal gaining more than 10% in only 3 weeks.
From a technical perspective, the price has started to drop from an important confluence resistance given by the falling trend line and horizontal support and we can have a continuation to the downside in the next days/weeks.
23.50 is now support followed by 21.50 very important one which can also be bears target.
A new high above 24.50 would negate this scenario

Silver (End of Corrective Elliott wave)Just my idea, just my trading strategy I want to share. Not a financial advice. Do your own research.

Silver weekly analysis As you can see in the chart Silver is making lower high on weekly time frame and after 3 weeks of down fall we can expect a bounce back from next week.
21.50 is very important support area, if closes below the level will attract heavy selling.
Let it consolidate for 1 or 2 days then buy above recent high.
We can head back to 23.50
Closing above 22.50 will confirm up move.

SILVER top-down analysisHello traders, this is the full breakdown of this pair. We will take this trade if all the conditions are satisfied as discussed in the analysis. Smash the like button if you find value in this analysis and drop a comment if you have any questions or let me know which pair to cover in my next analysis

Silver Price Analysis: Market is heading to 26.00 price zoneA recent Federal Open Market Committee meeting showed that half of its members expected an interest rate hike by 2022. As a result, silver (XAG/USD) has been climbing recently, trading at $23.50 today with an almost 2% gain in one session alone.
All these factors aid silver's climb to new heights due to their correlation with gold prices and demand for industrial use. Due to the inflationary pressure in the economy, investors are thinking of reserve safe-haven asset silver.
The recent FOMC minutes revealed the pace at which QE will reduce. However, it was announced yesterday that would only be billion dollars cut each year instead of a 20-billion planned initially because inflationary pressures are more substantial than anticipated.
Gold and silver are getting a boost from the US stock markets, which is seeing an increase in safe-haven assets. The dollar has seen some weakness recently but remains high due to low-interest rates.
Bond investors fear about Europe's economy slowing down further than anyone had expected already with Greece's debt crisis not being resolved yet either. As a result, the USD is weaker against gold and silver. But the USD is still dominating most of the major currencies, except safe-haven currencies like JPY and CHF.
Technical View:
Right Now, the silver price is holding above descending trendline, the price nearly 23.40.
If the H4 candle can close above the 23.50 price zone and descending channel, it may test the 24.00 prices. Breaking above the 24.00 price zone, the next target is the 24.80 price zone. 24.80 is Fibonacci 50% retracement area.
So, the market may go for some correction from the 24.80 price zone. But if it doesn't, breaking above 24.80 will open the door for the 25.80/26.00 price zone.
I don't think the market will break above the 26 price zone easily unless we see too many adverse U.S. economic reports.
On the other hand, breaking below the ascending trendline, the silver price may continue its downtrend again and may test the 21.50 price zone again.

Silver both scenarios Silver can go any side but before taking a position we should wait until it breaks any line and after that we can confirm it is bullish or bearish of course with risk management.

Silver botu scenariosSilver can go any side but before taking a position we should wait until it breaks any line and after that we can confirm it is bullish or bearish of course with risk management.

XAGUSD 16 June 2021 #H4XAG/USD on H4 chart on 16 June 2021, as we see there are strong support since 17 May 2021 , also at the current MA200 around 27.5
Trading plan : Wait for pullback and long at 27.5 , Target 1 At 28

