#SILVER: Swing Buying Up To Yearly End Target Of $100XAGUSD(SILVER) ANALYSIS🎇
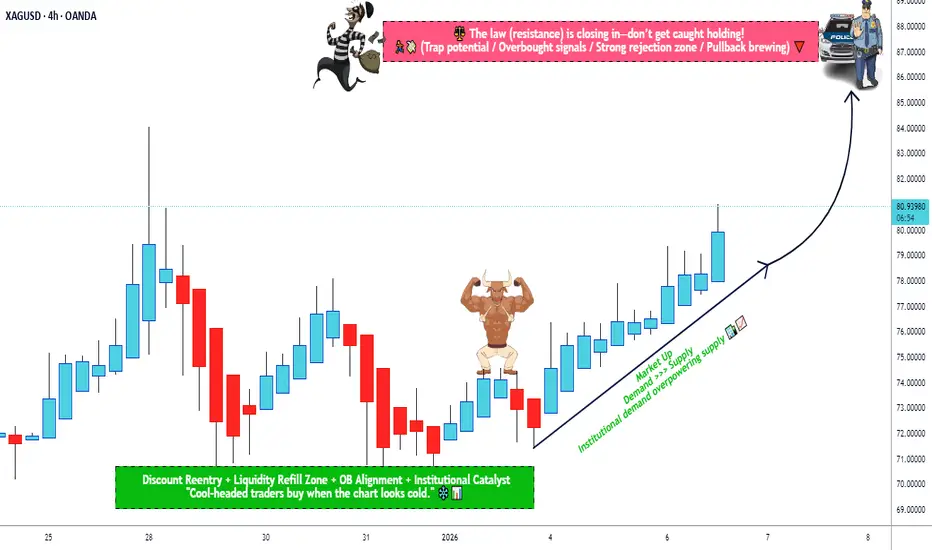
🔺After a big rally, silver took a dip, dropping about $70 from its high of $82. But don’t worry, it’s bounced back from $70 and is now trading at $80, with a chance to hit $85 by the end of January. The market is a bit wild right now, mostly because of recent political stuff.
🔺We’ve got three potential goals for this swing trade: we’re aiming for a first target at $85, then a second at $90 and a final one at $100. This plan is for a longer stay, maybe even a year. But since things have been so up and down lately, we’re betting the price will keep climbing.
🔺If you think our analysis is helpful, please give us a thumbs up and share your thoughts in the comments.
SetupsFX Team👨💻🏆
Silverusd

XAG/USD › Bullish Price Structure & Trade Planning📈 TITLE — SILVER SWING BREAKOUT 📊 XAG/USD “SILVER vs USD” 🥈
Market Blueprint | Bullish Thief Strategy | Layered Entries + Macro Signals
📝 DESCRIPTION
🔔 Asset: XAG/USD – Silver vs U.S. Dollar (Metals)
💡 Trade Bias: Bullish (Day / Swing)
🚀 Plan Summary:
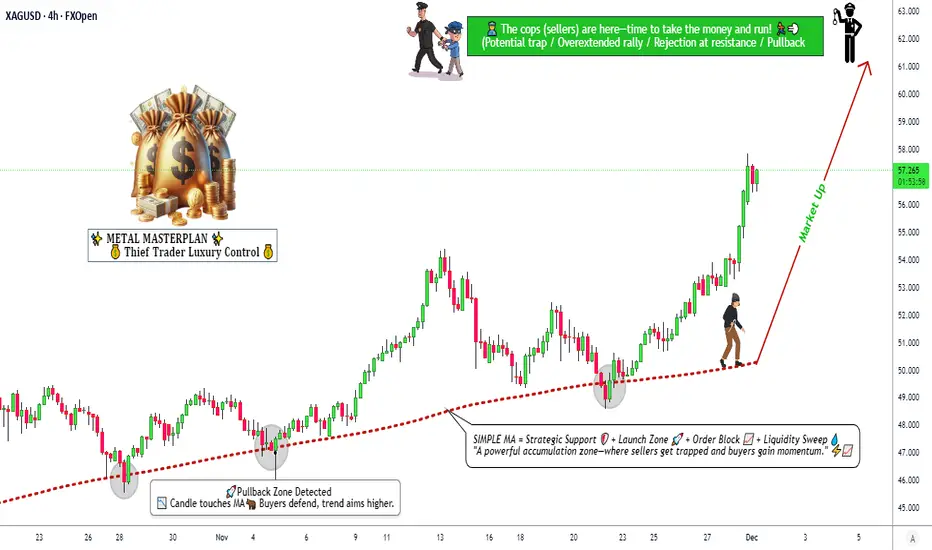
Silver remains in a structural uptrend and is trading at elevated levels with strong industrial and safe-haven demand. Macro drivers include dovish Fed expectations, persistent supply deficits, and robust demand from solar, EV & tech sectors — all bullish fundamentals supporting higher prices.
📌 Entry Strategy (Thief Layering)
Thief layering strategy — place multiple buy limits to scale into strength with risk control:
🎯 Layer Buy Zones (example):
• 🟩 76.000
• 🟩 78.000
• 🟩 80.000
(You can increase/add layers based on volatility & personal risk tolerance.)
📌 Why layering?
This technique helps build position as price retests structural supports while capturing volatility swings.
🔥 Stop-Loss (Risk Control)
🛑 Thief Stop-Loss @ 74.000
👉 Adjust SL based on your risk profile — trade safe, manage risk first.
🎯 Target / Profit Zones
🏁 Target Area: ~87.000
Key resistance zone near overbought levels & potential reversal/top trap region — take partial profits. Let price action confirm continuation.
Targets are guidelines — manage according to your risk/reward.
📊 Correlated Pairs to Watch
Watch correlations with:
• XAU/USD (Gold) — safe-haven behavior often aligns with silver trends.
• USD Index (DXY) — stronger USD can cap metals; weaker USD fuels bullion upside.
• Copper / Base Metals — industrial demand context.
Correlation signals give context on trend strength vs macro flows.
📈 Macro & Fundamental Drivers (Latest)
Bullish Fundamentals:
🔹 Silver has seen a historic rally and recently touched near record highs, driven by supply constraints + industrial demand.
🔹 Structural supply deficits and growing tech/green energy demand support higher price floors.
🔹 Market pricing still reflects expectations of Fed rate cuts in 2026, pushing yield-less assets higher.
Risk / Volatility Factors:
⚠ Index rebalancing and technical selling could add short-term pressure.
⚠ Silver historically more volatile than gold → wider swings possible.
📅 Economic & News Catalysts
Keep an eye on these reports with London time relevance:
📌 US Federal Reserve rate decisions & press releases
📌 US CPI & employment (NFP) data
📌 ISM Manufacturing + global PMIs
📌 China industrial output & export policies
These data points shape USD direction, interest-rate expectations, and commodity flows.
💬 Risk Reminder (Thief OGs)
Dear traders, sizing SL/TP is YOUR decision — trade your plan. Profits are earned when disciplined. Live setups change — adapt.
📌 This is a guideline plan based on current structure, not financial advice.
Silver - Just Like in the Books?The move we’re watching runs from early September 2022 to the end of 2025.
We completed three strong upward waves and finished around 84 .
But the main phase of the uptrend actually started in March 2020.
So far, we’ve drawn waves 1 , 2 , and 3 , and now we’re forming the 4th corrective wave.
Since things are moving fast, we won’t focus too much on direction — just the main ideas and key levels.
First scenario:
Wave 2 of the larger move looks like a zig-zag, so in this correction we expect to see a flat.
This means a return to around 84 (slightly above or below), then back down, and then the next main move starts. The sizes of waves 2 and 4 could be roughly equal, around 12 .
Also, wave 1 may be equal in size to wave 5 , which is around 18 .
Another point: since this is a commodity, wave 5 could be bigger than all the others and reach well above 90 .
This is clearly visible on the smaller timeframe.
Second scenario:
A deeper correction of wave 3 is possible.
Potential levels: 68 -> 62 -> 58 -> 50
Only after that, the price moves upward toward 90+ .
Summary:
We could rise to 90 or higher.
We could correct down to 50
We’ve marked the main directions and target levels.
It’s a bit complex, but this example is similar to classic textbook patterns.
The key point — you’re now prepared for different possible outcomes.
---
Please subscribe and leave a comment.
You’ll get new information faster than anyone else.
---

Silver Analysis (XAG/USD)CAPITALCOM:SILVER
Chart Structure
From December 6 to 26, the price followed a strong uptrend.
On December 27, silver peaked near $84 and then corrected sharply.
A strong support zone around $70 formed after the drop.
The current price is $74.53, and a recovery appears to be forming with bullish candles.
Key Support & Resistance Levels:
Level | Price
Resistance 1 | ~$76.5
Resistance 2 | ~$80
Support 1 | ~$72
Support 2 | ~$70 (major)
Patterns & Price Behavior:
Higher Lows are forming → indicating bullish structure.
A V-shape recovery pattern is visible → suggesting a strong rebound.
Buyers are stepping in aggressively after the pullback.
Fundamental Analysis
Factor | Status | Impact on Price
Global Inflation | Still elevated | Bullish for silver
Fed Interest Rate Outlook | Expected cuts in early 2026 | Bullish for silver
Geopolitical Tensions | Ongoing risks in ME/EU | Increases safe haven demand
Industrial Demand for Silver | Stable or increasing | Supports price
China’s Economic Recovery | Gradually improving | Boosts industrial demand
Conclusion: The fundamental outlook supports bullish continuation for silver.
Momentum Analysis
Strong bullish momentum after bouncing off the $70 support.
Recent candles show high volume and strong green bodies, signaling fresh buying interest.
If momentum holds, resistance at $76.5 could be tested and potentially broken.
XAG/USD Price Forecast
Timeframe | Expected Move
Short-Term | Likely move to $76.5–$78
Medium-Term | If resistance breaks, $80–$82 target
Long-Term (Weeks) | $88–$92 possible with strong fundamentals
Warning:Any losses are entirely your own responsibility. This is solely an analysis and **not** a recommendation to buy or sell.

REALLY simple trading tip on GOLD and SILVER Daily and Weekly
So many traders work with highly technical formulas and tools to acheive Exactly the same thing as this will show you
It is very simply, the 9 SMA ( Orange) and the Smoother 14 SMA ( Green )
On the main Weekly chart for GOLD ( above), see how PA runs along the 9 SMA, bouncing until support fails.
When that happens, the 14 SMA is the one to watch.
If PA remains above that and bounces, all is good.
It it Fails, Sell and wait for PA to regain the 14.
So, the 9 SMA is the warning signal, the 14 SMA is the trigger,
Using this idea, lets look at the Daily GOLD chart
The same principle applies though, as you can see, the increase in volitility could confuse issues on occasion......But the principle applies well.
When you loose the 9, watch the 14 and act upon that.
SILVER uses the same principle.
The Weekly silver chart
Same Thing but slightly more Volatile due to the cheaper asset price and so, quicker to move....
You can see how the Parabolic rise in PA on silver leaves it open to a rapid, sharp drop at some point. Knowing when that may happenn is Crucial.
So, when we look back to the Daily version of this chart, we can see that PA remains above support of both the 9 and 14 SMA -
In fact, we see that PA has bounced off the 9 today....Support has Held. That Rapid descent in price is not happening yet.
And that is IT
Have a Very Happy New Year and may you remain peaceful

Silver’s 2025 Explosion — How High Can It Go?In 2025, Silver ( OANDA:XAGUSD ) has experienced a remarkable surge, making it one of the most notable assets of the year. As we approach the end of 2025, I’ve decided to analyze silver to see how far its bullish trend might continue. So, stay with me as we delve into the reasons behind silver’s rise and explore how far this upward momentum could go.
Let’s begin by looking at the fundamental factors driving silver’s increase in 2025. After that, we’ll move on to the technical analysis.
Fundamental Drivers Behind Silver’s Massive 2025 Rally:
Structural Supply Deficit — Multi‑year deficits draining inventories, tight physical market.
Strong Industrial Demand — Solar, EVs, semiconductors & data centers consuming silver at record levels.
Rate Cut Expectations — Anticipated Fed easing lifts non‑yielding assets like silver.
Safe‑Haven Flows — Geopolitical risk, inflation, and a softer dollar boosting precious metals demand.
Liquidity & Momentum — Smaller market vs gold( OANDA:XAUUSD ) amplifies swings, attracting speculators.
Silver has surged ~ 150–165% YTD , setting fresh all‑time highs as both an industrial metal and investment hedge.
-----------------------
Technical Analysis:
Now, considering the technical side, with less than five days remaining before the six-month and one-year candles close, I’ll focus on a higher time frame for silver’s analysis. Recently, silver achieved a new all-time high, capturing widespread attention, and many prominent figures are now discussing silver’s potential.
From a classic technical analysis perspective on the six-month time frame, it appears that silver has formed a bullish continuation pattern, specifically a cup and handle pattern, and the recent six-month candle has broken the neckline/resistance zone($50-$34) with strong volume. This suggests that the bullish trend for silver is likely to continue.
From an Elliott Wave perspective, it seems that silver is completing wave 3, potentially within an ascending channel and a Potential Reversal Zone(PRZ) .
I expect that silver, upon entering this Potential Reversal Zone(PRZ) , will undergo a correction. If you’re considering adding silver to your portfolio, it’s wise to wait for that correction, as buying at all-time highs can be riskier due to the strong upward momentum.
What do you think? How far can silver’s bullish trend extend, and what levels might we see in 2026?
💡 Please respect each other's opinions and express agreement or disagreement politely.
📌 Silver/ U.S. Dollar Analyze (XAGUSD), 6-month time frame.
🛑 Always set a Stop Loss(SL) for every position you open.
✅ This is just my idea; I’d love to see your thoughts too!
🔥 If you find it helpful, please BOOST this post and share it with your friends.

Silver- Monthly TFLook at how far we are extended above the 21 SMA on the monthly TF, the same is the case for any TF- weekly included. Usually such huge divergences even out, the last time we were at $50 peak in 2011, it was similar and we know what happened. It may not play out the same over the next 14 years, but we have to be wary especially if holding bags and in gains or if trying to enter now, which has more risk v reward imho

Traders Who Follow Their Plan 90% the Time Look VERY DifferentBehind the scenes with prop traders, something interesting showed up in the numbers.
Nothing changed in their strategy. Same setups. Same market.
What changed was this:
-Plan adherence went from about 50% of trades to around 90%
-Rule breaks dropped by about 70%
-Account survival jumped roughly 40% (they stayed funded much longer)
In other words, they didn’t “find a better edge.”
They just actually followed the plan they already had most of the time.
This is why so many traders feel stuck: they keep searching for a new strategy, when the real leak is not doing what they said they would do.
Be honest with yourself for a second:
If you look at your last 20 trades… how many were truly from your plan, and how many were “I’ll just try this”?
Drop your honest guess below as a % (for example: “40% plan / 60% random”).
No judgment, just curious how people see themselves vs what the data usually shows.
Trade Smarter Live Better / Mindbloome Exchange

Silver Holds Trend Structure as Buyers Step In🥈 XAG/USD: SILVER BREAKOUT SETUP | DAY/SWING TRADE BLUEPRINT 📊
💎 Asset: XAG/USD (Silver vs. U.S. Dollar) - Metals Market
⏰ Timeframe: Day Trading / Swing Trading
📈 MARKET ANALYSIS
Current Price: $61.89 (Real-time verified December 15, 2025)
Recent High: $64.62 (All-time high recorded this week)
Strategy: BULLISH MOMENTUM CONFIRMED
✅ Hull Moving Average Pullback Strategy Active
✅ Bullish outlook supported by Fed policy
✅ Strong momentum structure intact
✅ Rising industrial demand driving prices higher
🎯 TRADE PLAN
📍 Entry Zone: Buy above Hull MA @ $63.00
Wait for price confirmation above moving average
Strong buyer presence confirms breakout validity
🎯 Target Zone: $66.00
Major resistance confluence area
Overbought conditions likely
Profit-taking zone - scale out recommended
⚠️ Risk Disclaimer:
Ladies & Gentlemen (OG Traders) - Stop Loss and Take Profit levels are YOUR personal decision. Manage YOUR capital, take YOUR profits at YOUR own risk. This is educational analysis, not financial advice.
🔗 CORRELATED PAIRS TO WATCH (IN USD)
1️⃣ OANDA:XAUUSD (Gold) - $2,650-$2,680 range
📌 Correlation: Highly positive (+0.85-0.90)
💡 Gold and Silver move together as precious metals. When Gold pushes higher, Silver typically follows with amplified momentum.
2️⃣ TVC:DXY (U.S. Dollar Index) - Currently @ 98.32-98.53 range
📌 Correlation: Strongly negative (-0.70-0.80)
💡 Dollar declining for three consecutive weeks - weakening Dollar = stronger Silver prices. Watch for DXY breakdown below 98.00 support.
3️⃣ FX:EURUSD (Euro) - $1.05-$1.06 range
📌 Correlation: Positive (+0.60-0.70)
💡 Euro strength = Dollar weakness = Silver rally. Monitor Euro breakouts above 1.0600.
4️⃣ FX:USDJPY (Yen) - 152-156 range
📌 Correlation: Negative (-0.50-0.60)
💡 Yen strength signals risk-off sentiment, benefiting safe-haven metals like Silver.
5️⃣ CSE:GC (Gold Futures) - Watch for directional cues
📌 Correlation: Near-perfect positive (+0.90+)
💡 Gold futures lead Silver movements. Track institutional positioning.
🔑 KEY TECHNICAL POINTS
✔️ Breakout Confirmed: Silver consolidating above $64.00 level after reaching new highs
✔️ Volume Profile: Strong buyer accumulation on pullbacks
✔️ Moving Averages: Hull MA providing dynamic support structure
✔️ RSI: Monitor overbought zones near target - exit signals critical
✔️ Trend Structure: Higher highs, higher lows = bullish continuation pattern
💰 FUNDAMENTAL CATALYSTS
🔹 Silver added to U.S. critical minerals list - increasing strategic importance
🔹 Fed rate policy supporting precious metals environment
🔹 Industrial demand from solar/electronics sectors rising
🔹 Weakening Dollar providing tailwind for commodity prices
⚡ TRADING REMINDERS
✅ Manage position sizing (never risk more than 1-2% per trade)
✅ Watch DXY correlation - Dollar weakness = Silver strength
✅ Set alerts at $63.00 entry and $66.00 target zones
✅ Scale out profits at resistance levels
✅ Trail stops as price advances to lock gains
🚀 Let's Secure These Profits! Drop a 👍 if you're watching this setup!
📌 Follow for more metal market opportunities and professional trading blueprints!
#XAGUSD #Silver #MetalsTrading #TechnicalAnalysis #SwingTrading #DayTrading #ForexTrading #PreciousMetals #TradingSetup #MarketAnalysis
⚠️ FINAL DISCLAIMER: Trading precious metals involves substantial risk. This analysis is for educational purposes only and is not financial advice. Always conduct your own research and trade responsibly according to your risk tolerance.


SilverXAGUSD
- Bullish Channel as an corrective pattern in Short Time Frame
- RSI - Divergence
- Completed " 1234 " Impulsive Waves
- Break of Structure
- S / R Level

The AI Boom's Unsung HeroThe rise of artificial intelligence isn’t just shaking up tech companies it’s quietly transforming the global silver market in a big way. As major players like NVIDIA, Google and others ramp up their AI infrastructure silver is becoming more critical than ever. Why? Because silver, thanks to its unmatched electrical conductivity, plays a key role in powering the hardware behind AI.
Silver is the most conductive metal on Earth. That makes it perfect for high-performance computing something AI needs a lot of. It’s especially important in data centers and advanced semiconductors, where both electrical and thermal performance are mission-critical.
What’s really interesting is that AI servers tend to use two to three times more silver than traditional data center servers. That’s because AI workloads are more power-hungry, generate more heat and require more complex cooling and electrical systems. Simply put, more AI means more silver.
If there’s one company at the heart of this trend it’s NVIDIA. Analysts at Morgan Stanley expect NVIDIA to consume a staggering 77% of all silicon wafers used for AI accelerators in 2025 up from 51% in 2024. That adds up to around 535,000 300-mm wafers a year each of which contains silver in key components.
All of this AI growth is showing up in the numbers. Industrial silver demand hit an all-time high of 680.5 million ounces in 2024. The electronics industry alone uses around 250 million ounces per year and AI is now the fastest-growing part of that.
Despite all this demand, silver supply just isn’t keeping up. The market’s been in deficit for four straight years, with a total shortfall of 678 million ounces between 2021 and 2024. That’s roughly ten months of global mine output gone missing from the balance sheet.
It’s no surprise, then, that silver prices have been climbing fast. As of July 2025 silver’s up nearly 30% for the year. Looking further ahead I see room for silver to keep climbing:
In the short term (2025): $36–$42 per ounce seems realistic
By 2026: Potential for $50+ as more AI growth stays strong
AI isn’t just changing how we work, communicate, or compute—it’s literally reshaping the commodities that make this technology possible. Silver, once thought of mainly in the context of jewelry or coins, is now a backbone material for the AI revolution.

SilverXAGUSD
- Completed " 12345 " Impulsive Waves and " A " Correction Waves
- RSI - Divergence
- Resistance Level
- Break of Structure
- Fibonacci Level - 100.00% / 121.70%

SILVER: The Mother of All Cup and Handles? 45-Year BreakoutThis analysis highlights what could be the most significant long-term technical pattern currently forming in the financial markets: a massive, multi-decade Cup and Handle formation on the silver/USD monthly chart.
The Cup (1980 – 2011)
The Cup began with the historic spike in 1980 and was completed with the rally to the same resistance level around $50 per ounce in 2011. This vast, 31-year, rounded consolidation zone represents a massive accumulation and basing phase.
The Handle (2011 – Present)
Following the 2011 peak, silver entered the "Handle" phase. This is the final consolidation period, characterized by price compression and sideways action below the key $50 resistance zone. This phase serves to shake out weak hands and build the energy required for a major long-term structural breakout.

Strong Bullish Structure Developing in Silver🚀 XAG/USD (SILVER) Swing Blueprint | Bullish Structure Intact | Key Levels Mapped! ⚔️
🎯 Metals Market Opportunity: Silver (XAG/USD) Swing Trade Setup
📈 Direction: Bullish | Swing Trade
🏷 Asset: XAG/USD - Silver vs. U.S. Dollar
⚖️ Core Thesis: Silver is building a potential swing bullish structure, aiming for a significant resistance zone. This plan outlines the key framework.
📊 Trade Plan (Blueprint)
✅ Entry Zone: Consider entries on pullbacks or strength confirmation. (Any price level entry - discipline is key).
🛑 Stop Loss (Risk Management):
"This is thief SL @ 54" 💎
Dear Traders (The OG Crew), 👊
This is my protective level. YOU MUST adjust your SL based on YOUR OWN risk tolerance & strategy. I do not recommend using only my level. Manage your capital wisely.
🎯 Target Zone: @ 62 Area.
This aligns with a strong historical resistance + potential overbought/trap zone. 🪤 The strategy is to "escape with profits" as price approaches.
Note: This is my target. Take profits based on your own analysis and risk-reward goals.
🔍 Related Pairs & Market Correlations (Must-Watch) 🔗
Monitoring these pairs provides context for Silver's move:
🦅 TVC:DXY (U.S. Dollar Index):
Key Point: INVERSE correlation. A weaker TVC:DXY typically boosts commodities priced in USD, like Silver. Watch for DXY breakdowns for added Silver bullish confirmation.
🟡 XAU/USD (Gold):
Key Point: STRONG positive correlation. Gold is the leader. A strong, bullish Gold market often drags Silver higher (and vice-versa). Silver's moves can be more volatile ("Gold on steroids").
📈 US 10-Year Treasury Yields / TVC:TNX :
Key Point: General inverse relationship. Rising real yields can pressure non-yielding metals. Watch for yield pullbacks that may relieve pressure on Silver.
⛽️ Crude Oil ( BLACKBULL:WTI / ICMARKETS:XBRUSD ):
Key Point: Inflation/Commodity Sentiment Gauge. Rising oil can signal broader commodity strength and inflation fears, which can benefit Silver as a real asset.
📊 Copper ( CAPITALCOM:COPPER ) & AMEX:GDX (Gold Miners ETF):
Key Point: Industrial / Risk Sentiment. Copper confirms industrial demand outlook. AMEX:GDX strength confirms bullish precious metals sector momentum.
💎 Final Notes
This is a blueprint, not financial advice.
You are the captain of your own capital. 🧭
Always use proper position sizing.
Markets are dynamic—always monitor for structure breaks.
Let's get this bread... responsibly! 🥖
✅ Like & Follow if you find this detailed blueprint valuable! It helps the idea reach more traders. 💡
#SILVER #XAGUSD #TradingSetup #SwingTrading #Commodities #PreciousMetals #Forex #TradingView #DXY #GOLD #XAUUSD #Analysis
Gold & Silver Are On Fire Right Now!🌕 Gold is up — heading towards its fourth straight monthly gain, hitting a fresh two-week high on expectations of an upcoming rate cut by the Federal Reserve.
💎 Silver just smashed a new all-time high — zooming to $56.78/oz, rallying ~16.6% this month alone!
📈📉 With global rate-cut hopes rising, safe-haven metals are drawing fresh investor love. Whether you call it “hedge”, “insurance”, or “bullish vibe” — the trend is clear: metals are in demand.
👉 Bottom line: If you’ve been waiting for a strong entry into commodities — now might be the moment. Gold and silver are ringing the bell loud and clear! 🔔

SilverXAGUSD
- Bullish Channel as an corrective pattern in Long Time Frame
- Change of Characteristics
- Break of Structure
- Completed " 12345 " Impulsive Waves
- Demand Zone

Silver Warning: RD- + PRZ = Short Opportunity?Today, we're diving into Silver ( OANDA:XAGUSD ), and it seems that there’s a potential short opportunity on the horizon.
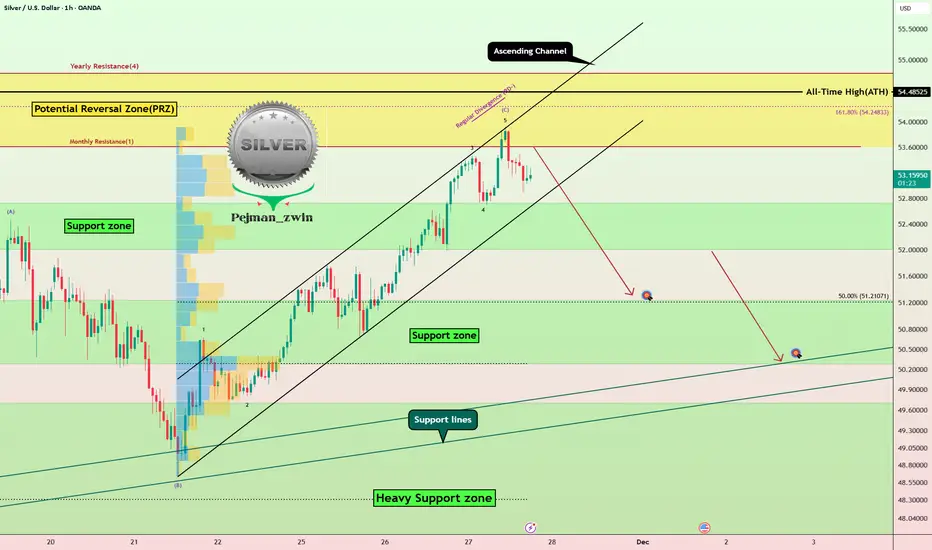
Currently, silver is approaching a Potential Reversal Zone(PRZ) and an ascending channel.
From an Elliott Wave perspective, it appears that silver has completed wave C of an Expanding Flat Pattern(3-3-5/ABC).
Additionally, we’re noticing a Regular bearish Divergence (RD-) between the price peaks, which adds to the bearish sentiment.
I expect that, following a break below the lower line of the ascending channel, silver could also break through its Support zone($52.73-$52.00) and potentially decline to around the $51.33 level.
First Target: $51.33
Second Target: Support lines
Stop Loss(SL): $54.63
💡 Please respect each other's opinions and express agreement or disagreement politely.
📌 Silver/ U.S. Dollar Analyze (XAGUSD), 1-hour time frame.
🛑 Always set a Stop Loss(SL) for every position you open.
✅ This is just my idea; I’d love to see your thoughts too!
🔥 If you find it helpful, please BOOST this post and share it with your friends.
Silver Price Action Update – Smart Money Reaccumulation PhaseXAG/USD "SILVER vs U.S. DOLLAR" — Metal Market Cash Flow Management Strategy 💰
Thief Strategy | Layered Entry | Swing / Day Trade Plan
🧭 Plan Overview
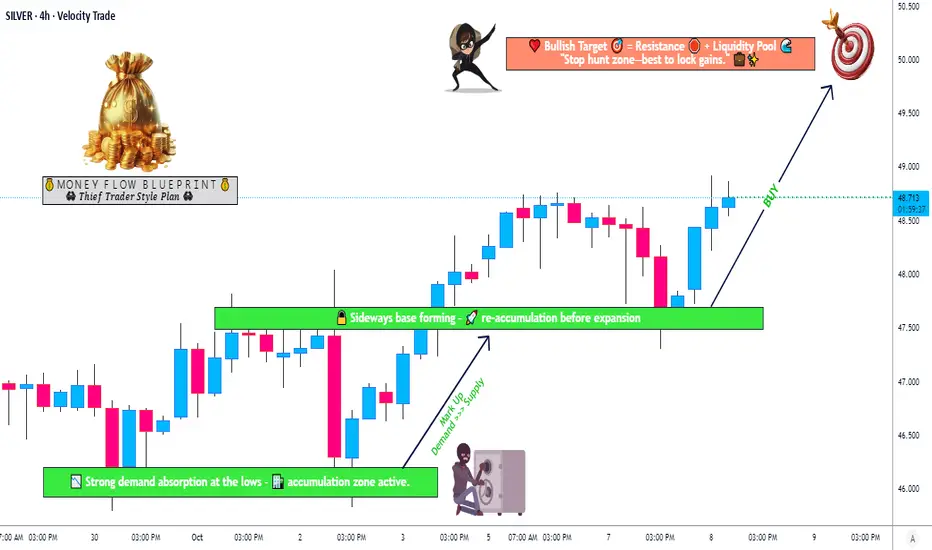
The Bullish momentum in Silver (XAG/USD) has been confirmed through accumulation and re-accumulation phases, signaling a potential continuation move upward.
Smart money appears to be building positions below major resistance — time for us to follow the metal flow. ⚙️
💎 Entry Plan — Thief Layer Style
Thief Strategy = Layered Limit Entries 🧠
We use multiple limit orders to build a smarter position gradually — instead of chasing the price.
Entry Layers:
47.500
48.000
48.500
(You can add more layers based on your own plan and risk appetite.)
🛑 Stop Loss (SL)
This is the Thief SL @47.000.
However, dear Ladies & Gentlemen (Thief OGs) — please manage your own risk.
It’s your money, your strategy, and your exit. 💼
“Make money → Take money → Protect money.”
🎯 Target Zone
A strong resistance zone + overbought conditions may create a trap at the highs.
So, when Silver reaches around $50.000, be smart and secure your profits before the metal traps the late buyers.
Remember: we steal profits, not dreams. 🕶️
💬 Note from the Thief OG
This is a Thief-style strategy — meant for educational fun and insight sharing.
Not a signal service or financial advice.
Use your own judgment and always plan your risk ahead of your entries.
Let’s manage our cash flow, not our emotions. ⚖️
🌍 Related Pairs to Watch (Correlation Check)
OANDA:XAUUSD (Gold) → Often moves in sync with Silver; watch for Gold strength confirmation.
💵 TVC:DXY (U.S. Dollar Index) → Inverse correlation; a weaker USD supports Silver upside.
💰 OANDA:AUDUSD & OANDA:NZDUSD → Commodity-linked currencies; bullish moves support Silver’s strength.
OANDA:XCUUSD → Industrial metals correlation; when Copper rallies, Silver often follows.
Keep your eyes on these pairs — they reveal how liquidity shifts across the metals and forex markets.
✨ “If you find value in my analysis, a 👍 and 🚀 boost is much appreciated — it helps me share more setups with the community!”
⚠️ Disclaimer:
This is a Thief-style trading strategy — shared just for fun and educational purposes.
Always do your own research and trade responsibly. 🧩
#XAGUSD #SilverAnalysis #MetalsMarket #SwingTrade #DayTrading #TechnicalAnalysis #ThiefStrategy #LayeredEntry #CommodityTrading #SmartMoney #BullishSetup #TradingViewCommunity #MarketFlow #TradeResponsibly
Silver - The catastrophic rejection!🆘Silver ( TVC:SILVER ) is just collapsing:
🔎Analysis summary:
At this exact moment, Silver is retesting the previous all time highs, which were already rejected about 45 years ago. Considering the extremely bearish rejection on the smaller timeframes, Silver simply fails to break out. This will lead to a devastating reversal.
📝Levels to watch:
$50
SwingTraderPhil
SwingTrading.Simplified. | Investing.Simplified. | #LONGTERMVISION

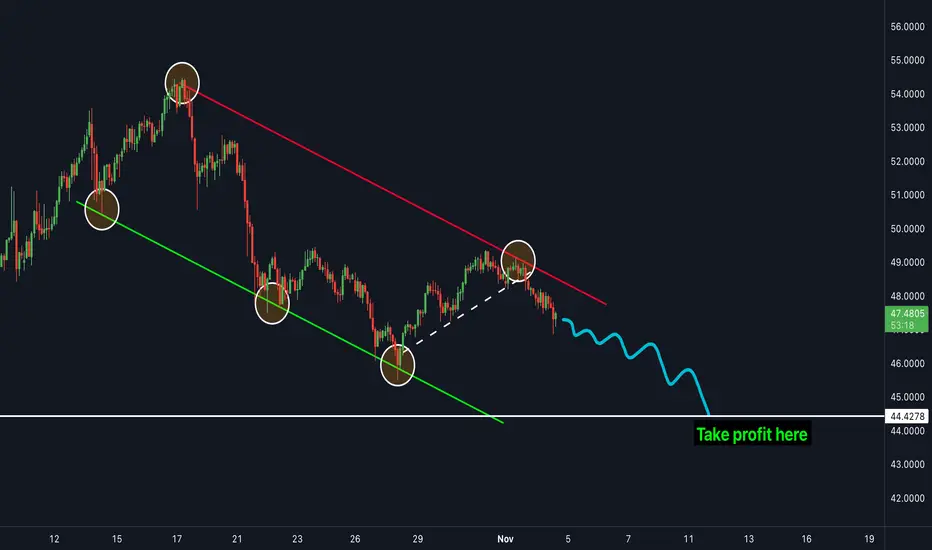
SILVER is ready to drop more - SELL NOW!Silver has been in a clear downtrend for the last few weeks and has struggled to move to the upside. The price is currently in between a bearish channel and is bouncing in-between both resistance and support zones. The price broke the most recent trendline (shown in white) which acted as a support zone. The next target is the white line shown on the chart as "take profit". This is the next major support zone which the price is very likely to hit next.
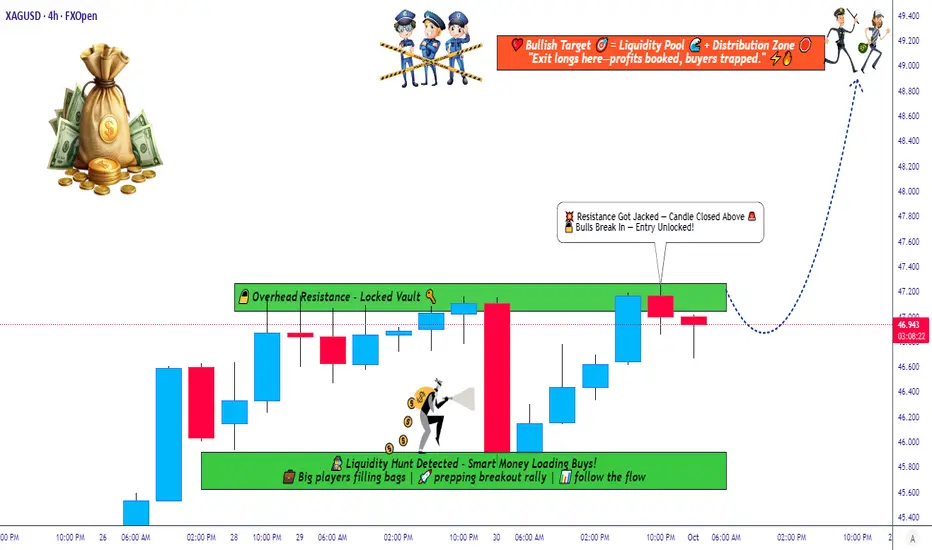
Silver Strategy Map — Thief Layers, Smart Targets, and Risk Zone📊 XAG/USD “Silver vs U.S Dollar” — Metals Market Wealth Strategy Map (Swing/Day Trade)
🔑 Plan: Bullish Setup
This setup follows the “Thief Strategy”, which means using layered limit entries to scale into the trade. Instead of going all-in at one level, we “steal the entries” across multiple layers.
💰 Layered Buy Limit Entries (Example Setup):
46.200
46.400
46.600
46.800
47.000
👉 You can increase layers as per your own plan and risk style.
🛑 Stop Loss (Protective Exit): 45.600
(This is my thief SL — but you’re free to adjust as per your own risk appetite.)
🎯 Target Zone: 49.000
⚠️ Around 49.300, we see a “Police Barricade” (heavy resistance + overbought conditions + potential trap).
That’s where profits should be taken — escape with gains before the trap closes!
Why This Setup?
Support Zones: Strong accumulation zones forming near 45.600–46.000.
Trend Bias: Silver remains bullish in the medium-term metals market outlook.
Layering Strategy Advantage: Reduces entry risk and allows better average fill.
Profit Zone: 49.000 aligns with strong supply area + RSI extension risk.
🔗 Correlation & Related Pairs to Watch
OANDA:XAUUSD (Gold vs USD): Gold often leads Silver’s moves — watch Gold for early signals.
TVC:DXY (US Dollar Index): A weaker USD usually boosts metals.
TVC:PLATINUM & CAPITALCOM:PALLADIUM : Industrial metals correlation — strong moves here can influence Silver sentiment.
TVC:SILVER Futures: Always track COMEX Silver contracts for volume confirmation.
✨ “If you find value in my analysis, a 👍 and 🚀 boost is much appreciated — it helps me share more setups with the community!”
📌 Disclaimer: This is a Thief-style trading strategy, created just for fun and educational sharing. Not financial advice — trade at your own risk.
#XAGUSD #Silver #Metals #TradingStrategy #SwingTrade #DayTrade #ThiefStrategy #Gold #DXY #Forex #Commodities
SilverXAGUSD
- Completed " 12345 " Impulsive Waves
- Demand Zone
- Fibonacci Level - 50.00% / 61.80%
- RSI - Divergence
- Bullish Channel as an corrective pattern in Short Time Frame
