EURJPY LONGEurjoy looking clean for a good chance of buying ,and staying there for a while as there’s some really cool fresh new highs that go along and correlate with our price structure
Simplertrading

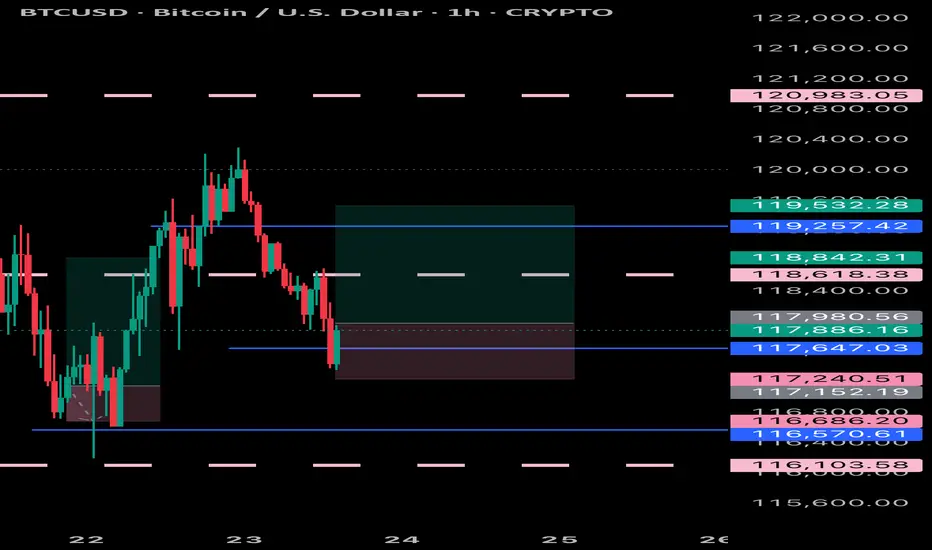
BITCOIN UPDATE Bitcoin seems to be preparing to fix its lows so it’s time to target a trade to the up side because, it had dropped to a fair amount of lows
Trading with the 20 & 100 Simple Moving Averages (SMA) The Simple Moving Average (SMA) is a powerful trend-following tool that helps traders identify buy and sell opportunities. In this chart, we use:
SMA 20 (Purple Line) → This moving average represents the average price of the last 20 candles. Since it reacts quickly to price changes, it reflects short-term momentum and helps identify early trend shifts.
SMA 100 (White Line) → The 100-period SMA smooths out price action over a longer timeframe, reducing noise and showing the overall market direction.
Trading Strategy: The Golden & Death Cross
✅ BUY Signal: The SMA 20 crosses above the SMA 100 → This is called a Golden Cross, and it indicates that recent prices are rising faster than the long-term trend, suggesting a shift toward bullish momentum. Traders see this as a buying opportunity since short-term demand is increasing
❌SELL Signal: The SMA 20 crosses below the SMA 100 → This is called a Death Cross, and it shows that recent prices are dropping below the long-term trend, signaling a potential bearish market shift. This suggests that sellers are taking control, increasing the likelihood of a downtrend.
By using moving averages, traders can filter out market noise and trade with confidence.

Unlock Market Targets with Fibonacci: Precise Entries & Exits Hey there! In this video, I’ll walk you through how I use the 50% and 100% Fibonacci levels to get a clear sense of where the market might move next. It’s a simple, no-fuss approach that helps me trade with more confidence—without cluttering my charts with tons of indicators.
The projection marks where a move might wrap up—perfect for deciding when to exit or take profits. Whether you’re into forex, crypto, or stocks, this strategy can keep things simple and effective.
If you found this helpful, feel free to like, boost, comment, or follow—I’d love to know your thoughts and hear how this method works for you!
Mindbloome Trading
Trade What You See

FLOKI 1D | PlanThe area of the purple box is my zone of interest. If I see weakness in the price at this level, it could pull back to lower levels IMO.
Happy trading!

Dax 40 Germany 40Just a simple spike and channel pattern, and I'm waiting for the price to move in a trading range for a short time before the next upward movement. For now, I'm looking to take advantage of the current situation. I'll take small profits that align with the upward spikes as I try to catch the small upward movements in the lower timeframe. Hopefully, you'll make some money from this. As always, thank me later!

Trade/Market review for 6/26/24Great day today although maybe not the best conditions depending how you trade. I was able to catch a second chance entry for an Anty setup. Although price did not follow through with the trend, I caught the second leg of the attempted continuation.
Price trailed up above yesterdays high and then came to a swift collapse back down below followed by a repeated attempt to break yesterdays high again but failing to do so.
Price continues to bounce between yesterdays high and low.

UNH - Keeping it simple for 20+ R:R tradesJust keep it simple!
Let me know when you start to see it!
Happy Trading :)
- TraderDaddyOG

"Bitcoin's Crucial Moment: Symmetrical Triangle & 200MA Dynamics#Bitcoin update
Bitcoin is currently trading within a symmetrical triangle pattern, and a decisive breakout or breakdown is essential to determining the next directional move for Bitcoin.
In this context, the 200-day moving average (200MA) is functioning as a support level.
Stay tuned for further updates; I will continue to provide information as the situation develops.

USDJPY IDEASo after a long time,i wanted to publish this trading idea,we see clear uptrend on a 1hr chart,but didnt manage to break hh,made hl,so now we wait for a break and retest,and of course a confirmation candle to enter a short position for around 100pips

GOLD BUYS FROM 1961Sell level hit at 1984, expecting price to move down to 1961 for some buys back to highs. If 1961 breaks gold will move as lower back to 1937 range. if price breaks 1984 we will see highs back to 2007.

Gold to 1939Gold broke lower under our support level(1955). Support will now become resistance. gold will sell off from 1955 to 1939. Monthly candlestick pattern will play out. Gold will likely go back to 1880s.

EURUSD Support and resistance markupI decided to display how I mark up my charts. I will be trading EURUSD going forward. I intend on leaning closed into naked trading as I don't use many indicators.


Gap and Orderblock entry1. **Gap and Block entry(1min Time Frame):**
**TOOLS:** 1. **Order Block**
2. **Fair value Gap(FVG)**
NOTE: There must be a clear move in a direction before **entry at the retrace**, into a **FVG**, supported/resisted by an **OB**
**(New York time, GMT -5)**

HFCL Swing TradeHFCL LTD
Simple price action
21 MA crossing over 50 and 100 ma - indication positive move
Price taking support at trendline and support line also.
Nice 15% MOVE EXPECTED ONCE RESISTANCE IS ALSO BROKEN .
Once broken wait for retest also.

CCJ - LONGA great swing idea in a major uranium player. At major support. Looking to for a push higher once the squeeze fires.


Choppy market ahead for GBP/USD?Looking at the chart we could have two possibilities for Cable.
If we close above the midline of the purple price point by the end of today, I expect a push higher to the 1.34130 area over the next week.
I we fail to break the mid line I'll be looking at and ranging market between 1.3200 and 1.3000

Similarities between Bitcoin's rising channels (950% gains?!?!?)This idea is not fancy. It is simple textbook chart formations such as flagpole targets and rising channels. Many people's first indicators that they learn are the MACD and the RSI. Next comes the use of divergences with the indicators and oscillators. This chart is basic enough to be in the introductory section of a trading textbook.
While it is undeniable that we have higher highs and higher lows the chart below shows that that compared to last time the higher high was not as high, comparing almost 20% in the 2020 higher high to only 6.3% in the 2021 higher high. What is nice for the bulls is that the higher low we have put in so far in 2022 is 18.8% higher then the comparison low in the channel while in 2020 it was only 11.25ish%. So the high is not relatively higher but the low is relatively lower.
Hopefully some wonk in the comments can tell us which performs better, is it better to have higher highs, or is it better to have higher lows?
Regardless, the targeting and stop loss/trade management is pretty simple. For full performance just see the chart below. It does not get much easier than that. My linked idea about the XABCD butterfly will show a higher up target but that may take a while to reach. We already had a year of sideways and if we hit target with over a 9x who wants to be greedy and hold open a position for perhaps another year?
The black flagpole target helped define a significant area for over a year and a half. I assume that if the $440,000 gets met that will likewise be a significant area for a long time. I, however, won't be in the game as I like my XABCD butterfly target of $375k much better.
I, also personally, am not going to be doing a whole lot with btc as a trade, but I will be using it to determine where I think the market may stall and reverse. I have my positions and trades on in my preferred alts.

GbpJpy Chartwork!I love GJ!
I've been riding GJ for a while and
super proud of my clean charts.
LFG
Journaling/learning purposes

shorting GbpJpyThis is my idea where I'm shorting GJ right here for at least 50 pips.
Tell me what you think..?
Journaling/learning purposes.

uptrend in this pair is happening soon . in my opinion price is growing up . its just a simple analysis and i will publish by details ASAP.
