Copper – Targets for the Year: 15,760 > 16,600 – 16,800 > 14,800Good day, friends. Today we will try to analyze the current situation in the copper market for this year and identify key targets for the year. Let's start with the news that had the biggest impact:
🔴 Codelco — El Teniente: Tunnel Collapse (July 2025) A tragedy at the world's largest underground copper mine, caused by seismic activity triggered by mining operations. Current Situation:
Partial resumption — 8 underground sectors deemed safe are operational, running at ~75% capacity
Production Losses in 2025: 48,000 tonnes of copper
❌ Exact recovery date not announced. Forecast — no earlier than late 2026.
Codelco — A Chilean state-owned company and the world's largest copper producer. Operates legendary deposits: • El Teniente — the world's largest underground copper mine • Chuquicamata — one of the largest open-pit mines • Radomiro Tomic — high-grade ore Codelco faces challenges: aging assets, declining copper ore grades, and the need for large-scale investments in modernization.
🔴 Freeport-McMoRan — Grasberg: Landslide and Force Majeure (September 2025) A serious incident at one of the world's largest copper mines Force majeure declared on deliveries
Recovery Plan: • Big Gossan and Deep MLZ mines (unaffected) restarted in Q4 2025 • Main mine Grasberg Block Cave — phased restart from Q2 2026 Phase 1 - Q2 2026 - Beginning of phased restart of Grasberg Block Cave Phase 2 - H2 2026 - Reaching 85% capacity Full Recovery - 2027 - 100% capacity
Freeport-McMoRan (FCX) An American company with the world's most profitable copper mine — Grasberg in Indonesia. Key facts:
• Grasberg is also one of the largest gold deposits (gold bulls send their regards) • Largest copper producer in the USA (Morenci mine in Arizona) • Actively developing underground mining at Grasberg
🔴 DR Congo — Copper Mine Collapse (November 2025) This is not a major corporate mine, but the incident highlights the risks of mining in the region. • African Copper Belt — DR Congo and Zambia are attracting major investments
✅ Kamoa-Kakula — Smelter Launch (November 2025) This is the biggest event in the industry. Estimated Smelter Capacity - 500,000 tonnes/year (direct-to-blister) Product - Copper anodes (first melt completed) Production in 2025: 388,838 tonnes of copper in concentrate Forecast for 2026: Sales 20,000 tonnes above production (inventory realization)
p.s. There is no incentive to sell inventory now; better to wait for price growth and sell in Q2 2026 for higher margins.
Ivanhoe Mines and Zijin Mining launched their own 500,000 tonnes/year smelter directly on-site in DR Congo. This allows production of high-purity copper anodes instead of exporting concentrates, significantly increasing margins.
🟡 Escondida and Zaldivar — Strike (January 2026) The world's largest copper mine is experiencing disruptions. Protesters are blocking access roads to the mines. Blockades affect access to Escondida (BHP) and Zaldivar in the La Negra industrial sector, Chile.
📈 Factors Supporting DEMAND
China — Massive investments in renewable energy Target by 2035 - 3,600 GW of solar and wind capacity (new commitment) State Grid Investments - 89 billion USD planned for 2025 — a record level Each GW of solar capacity requires ~2,500-5,000 tonnes of copper . Grid expansion and energy storage require even more. This creates sustainable long-term demand.
USA — Tariff Policy (Section 232) November 1, 2025 - 25% tariff imposed on imports of medium and heavy trucks and parts November 14, 2025 - Framework agreement announced with Switzerland and Liechtenstein (rate reduction) November-December 2025
Impact on copper Tariff uncertainty stimulated frontloading by American importers, temporarily boosting demand.
Electric Vehicles — Continued Growth In 2025, over 18.5 million electric vehicles were sold globally, accounting for ~25% of new sales. Each EV contains 80-100 kg of copper (4 times more than ICE vehicles).
Summary November 2025 became a turning point for the copper market: The combination of factors — China's massive investments in renewable energy, US tariff policy, and multiple disruptions at the world's largest mines — created a powerful bullish impulse that supported prices above 13,000 USD/tonne. Particularly significant is that the three largest producers (El Teniente, Grasberg, Escondida) simultaneously faced problems, which is a rare coincidence that amplified the supply deficit.
Now for the technical analysis. In this forecast, we use Fibonacci extension zones for price and time, projecting onto the industry information and expected events we've gathered. The overall trend is bullish. I assume that the current uncertainty with strikes will last up to 2 months, and we will observe sideways movement for some time while buyers accumulate positions and replenish inventories for subsequent resale, amid growing demand and increasing deficit due to accidents at major facilities.
Next — growing demand (including the new Kamoa-Kakula smelter) will push the price toward 15,760 – 15,800 (which we should reach by May).
Then — relative price stabilization in the range of 15,780 – 16,600 Likely price breakout ~ 16,800
After which , amid news of the restart of Grasberg Block Cave and other damaged mines, as well as news of increased copper production in DR Congo , buyers will take profits , leading to a phased price correction .
As copper production in DR Congo continues to grow:
2025 - ~3,210 thousand tonnes | +0.3%
2026 (forecast) - ~3,404 thousand tonnes | +6%
First correction target: ~ 14,800
Second target: ~ 13 200
What do you think?
With Respect to Everyone, Your #SinnSeed
Sinnseed

SinnSeed | ROSNEFT (ROSN) | Overview - 15.02.2026🛢 #SinnSeed | ROSNEFT (ROSN) | Overview: News, Financials, Forecast 🔗
🖥 Latest Developments & Impact on Stock Price
⚠️ Sanctions & Exports . In October 2025, the US included #Rosneft (along with #Lukoil ) in a new sanctions package. The consequences are already being felt:
🔴 Exports plunged ~32% by December 2025 — the Urals discount widened to 25 USD/bbl 🔴 Oil volumes stuck on tankers at sea — shares dropped 3.8–5.6% depending on the exchange 🔴 India's imports of Russian oil fell to the lowest since 2022 — ~1.1M bbl/day in January 2026
⚠️ The PCK Schwedt Problem. The German refinery, held under trust management, remains a point of tension. Sanctions threaten fuel supplies to Berlin. Rosneft has officially warned of the risks — deadline April 29, 2026.
💥 Incidents & Production. A series of #drone attacks in November–December 2025 damaged oil depots and #refineries . The result — a loss of 350K bbl/day in January 2026. No major new contracts. The company is pivoting to the domestic market and counting on tax incentives of ~10B RUB/year for 2026–2030.
📉 Combined effect: shares have lost 12–15% since October 2025. Financial crisis. H1 2025 profit collapsed by 68%. #CEO Sechin publicly blames Western restrictions. 🤥
📊 Financial Analysis | 9M 2025 (IFRS)
🔻 Revenue → 6,288B RUB (−17.8% YoY) 🔻 EBITDA → 1,641B RUB (−29.3% YoY) 🔻 Net Income → 277B RUB (−70.1% YoY) ▪️ Free Cash Flow → 591B RUB 🔻 Net Debt / EBITDA → 1.3x ▪️ Total Debt → ~36B USD
Quarterly Profit Dynamics: Q1 → 170B ▸ Q2 → 74B ▸ Q3 → 32B RUB The trend is clear — an accelerating decline. 🔽
Key Pressure Drivers:
🔻 Low oil prices + market surplus (~2.6M bbl/day) 🔻 Ruble appreciation eating into RUB-denominated revenue (thanks to the NWF and the fiscal rule) 🔻 High CBR key rate → debt servicing costs +2.5–3.8B USD 🔻 Declining gas production (−13.1%) and refining (−7.8%)
🔮 Forecast Through August 2026
The base case assumes continued sanctions pressure and a market surplus of ~2.4M bbl/day in 2026.
Выручка: −10–15% YoY → ~8T RUB/year, assuming Urals doesn't hold above 50 USD Net Income: stabilization or −20% → ~300–350B RUB/year
🔸 Upside support — tax incentives and the Vostok Oil project (launch in 2026, target capacity up to 2M bbl/day by 2030)
Debt load: Net Debt / EBITDA → 1.5–1.7x, with risk of increased borrowings
Stock: — if oil > 60 USD → rebound potential +5–10% — if oil < 60 USD → further decline likely −5–10%
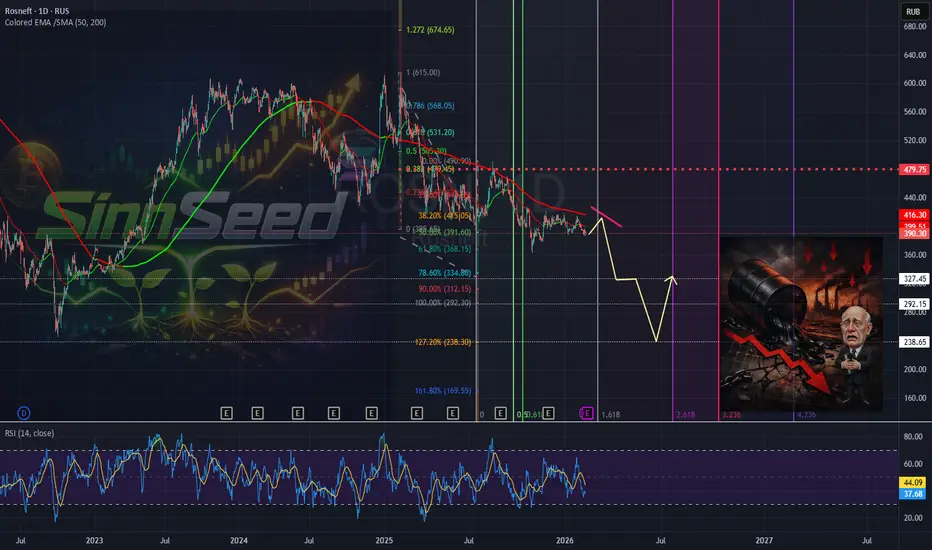
Technical Picture 👨💻
📉 A correction to the 38.2% level indicates a strong downtrend.
By 20.03.2026, I expect a drop to 325 RUB. Followed by a continuation to 290 RUB. A potential impulse move toward the 260–240 RUB zone is possible, after which a local reversal could be considered.
No buying before 260 RUB .
What do you think about the forecast? Share in the comments.
SinnSeed | OMS Energy Technologies ( #OMSE ) — 10.02.2026SinnSeed | OMS Energy Technologies (#OMSE) — Company Overview | After IPO
© OMS Energy Technologies
➡️ An oil and gas equipment manufacturer with over 50 years of history has been listed on NASDAQ.
✍️ Company Card
Full name: OMS Energy Technologies Inc. Ticker: OMSE | Exchange: NASDAQ Capital Market Founded: 1972 | Headquarters: Singapore Employees: ~632 people (May 2025) Website: omsos.com
⚙️ Company Operations
OMS Energy Technologies is a growth-oriented manufacturer of equipment for the oil and gas industry. The company specializes in two key product categories: 🗣️ Surface Wellhead Systems (SWS) — surface wellhead systems and "Christmas trees" for controlling oil and gas flow from wells 🗣️ Oil Country Tubular Goods (OCTG) — oilfield tubular products: ▪️ Specialized connectors ▪️ Premium pipes and threaded connections ▪️ Casing and tubing (pump/compressor pipes)
These products are used for drilling, completion, and operation of oil and gas wells worldwide.
🕯 Financial Performance (FY 2025) Total revenue: 203.6 million USD | Growth: +12.21% year-over-year Cost of sales: 134.6 million USD Gross profit: 69.0 million USD Operating expenses: 9.1 million USD Operating profit: around 39.6 million USD
🕯 Balance Sheet: Total assets: 211.68 million USD Total liabilities: 34.51 million USD
📊 The company shows steady growth — revenue has increased from 163.3 million to 203.6 million USD, demonstrating strong operating profitability.
📍 Management ▪️ How Meng Hock — Chairman of the Board & CEO (CEO since 2014, Chairman since March 2024) ▪️ Kevin Yeo — Chief Financial Officer ▪️ Tse Meng Ng — Non-executive Director
🟢 How Meng Hock is a key figure in management and sets the company’s strategic direction.
📈 IPO History ▪️ November 2024 — Submission of confidential documents (Form F-1 to SEC) ▪️ December 2023 — Registration of OMS Energy Technologies Inc. for IPO purposes ▪️ Offering price: 9.00 USD per share ▪️ Exchange: NASDAQ Capital Market, ticker OMSE “Since our founding in 1972, OMS has built its reputation on engineering excellence and strong operating capabilities.” — from the company’s press release. ©
⭐️ Key Takeaways ✔️ Established business — over 50 years in the oil and gas sector ✔️ Financially healthy — low debt burden (liabilities ~16% of assets) ✔️ Sustainable growth — double-digit revenue growth year-over-year ✔️ Strategic location — Singapore as a hub for Asian and global markets
A classic representative of the “old economy” on the modern stock market. Focus on a premium segment with high margins.
🌐 Geography & Clients Key markets: 🇸🇦 Saudi Arabia (Saudi Aramco — anchor client) 🇦🇪 UAE 🇮🇩 Indonesia 🇵🇰 Pakistan
Offices: Singapore (HQ), Saudi Arabia, Indonesia
⚔️ Competitive Landscape Global giants: Schlumberger, Baker Hughes, Halliburton, NOV
OMS Advantages: ✔️ Higher margins vs. competitors ✔️ Niche specialization ✔️ Flexibility and focus on regional markets ✔️ Strategic presence in Singapore
Risks: ⚠️ Smaller scale (capitalization in the hundreds of millions USD) ⚠️ Dependency on major clients ⚠️ High share volatility (but within expectations after IPO)
🚀 Growth Strategy (2025–2026+) ▪️ Expanding in Asia and the Middle East ▪️ Diversifying the client base ▪️ Potential M&A deals ▪️ Expanding the product line
📊 Market Global wellhead equipment market: 5.7–7.6 billion USD Forecast to 2031–33: 9–11 billion USD (CAGR ~5%)
💡Bottom line: #OMS is a compact but high-margin player focused on the premium niche with ambitions for regional growth. It is interesting as a bet on the development of the oil and gas sector in Asia and the MENA region.
Technical Picture: What we know: After the IPO, there is a 📉 correction for 3 to 6 months ⚠️ Sideways between 23.6% and 50% — this is an accumulation or distribution zone. The longer the consolidation, the stronger the breakout will be. The spring is tightening 🔥
🔼 Signs of accumulation (bullish scenario) ▪️ Trading volume declines during declines, rises during upswings. ▪️ Higher lows. ▪️ Dips are quickly bought up. ▪️ RSI forming an upward structure.
🟢 Long conditions: Breakout above the upper limit (50% or 61.8%) on increasing volume + candle closes above the level. Stop-loss — below the lower limit (23.6%).
Short term: 🔹 5.07 (+16%) — Minimal target 🔹 5.70 (+30%) — Standard target ⭐️ 6.15 (+41%) — First key target ⭐️ 6.73 (+54%) — Golden extension
Long term: 🔹 6.25 (+50%) — Minimal target 🔹 7.69 (+75%) — Standard target ⭐️ 8.70 (+97%) — First key target ⭐️ 10 (+124%) — Golden extension

BTC - View from 02/05/2026Good evening! Today was published: 🔖 Job Openings and Labor Turnover Survey (#JOLTS) USA 📉 Actual: 6.542M | Forecast: 7.200M | Previous: 6.928M
A lower-than-expected reading, such as 6.542M for December 2025 (versus the expected 7.2M and down from the revised 6.9M in November), signals declining labor demand and potential economic weakening. This could influence #Fed interest rate decisions in several key ways:
▪️Reduced inflationary pressure: Fewer job openings often mean less competition for workers, which can slow wage growth and reduce the risk of wage-driven inflation. If the Fed sees this as evidence that inflation is under control or approaching the 2% target, it may feel more comfortable cutting rates to support growth without triggering new price spikes.
▪️Supporting employment and growth: The Fed's dual mandate includes maximum employment. A cooling labor market may raise concerns about rising unemployment or slowing hiring in the future, prompting the Fed to cut rates to stimulate borrowing, investment, and consumer spending, thereby promoting job creation.
▪️Market expectations and forward guidance: Such data often shift investor bets on the rate trajectory. For example, if this JOLTS miss aligns with other weak indicators, it could increase the probability of a rate cut at the next FOMC meeting. On the other hand, if inflation remains sticky, the Fed may hold rates or delay cuts to avoid overstimulation.
Overall, such data tilts the balance toward "dovish" policy (rate cuts) rather than "hawkish" (hikes or holds), but the Fed weighs them in the context of a broader data set, including CPI, PCE inflation, and global factors.
👀 What to watch:
➡️ Nonfarm Payrolls (#NFP) – Feb 11 and Unemployment Rate – Feb 6 for January 2026: Employment growth of 60–70K jobs is expected, with unemployment at 4.4%. If the data comes in weaker than expected (fewer new jobs or rising unemployment), it will confirm the cooling trend and strengthen expectations of Fed rate cuts.
✔️ ADP National Employment Report: Already released on February 4 (yesterday). This is a private employment indicator, often preceding NFP. If it showed weak growth, that's an additional signal. 📉 Actual: 22K | Forecast: 46K | Previous: 37K
✔️ ISM Non-Manufacturing PMI: Shows activity in the services sector. A slowdown here would confirm the overall cooling trend. ↗️ Actual: 53.8 | Forecast: 53.5 | Previous: 53.8
✔️ Weekly Jobless Claims: Weekly unemployment benefit claims. Rising claims would indicate a deteriorating labor market. 📉 Actual: 231K | Forecast: 212K | Previous: 209K
➡️ Employment Cost Index (#ECI) for Q4 2025: February 10. Shows wage growth. If growth slows, it will ease inflationary pressure and support the case for rate cuts.
➡️ #CPI and #PCE Inflation: January CPI – February 13, PCE – later. If inflation declines or stabilizes below 3%, it will give the Fed room to cut rates.

Oil – Roadmap to Summer – 01/28/2026Good afternoon, friends!
I decided to dig into oil to complete the picture for my ruble forecast. I'm sleepy, so keeping it short today (will add more details later on my page).
Key Points
Storage Levels (Commercial + Strategic Reserves)
China
Reserves as of January 31, 2026: ≈1,095 million barrels (31 days of domestic demand).
Growth from November to January: +26 million barrels. The main buildup occurred in December when imports hit a record 54.6 million tonnes (+17% YoY).
Current utilization of commercial tanker fleets off the coast (Shandong) exceeds 80% of design capacity — no signs of storage shortage.
India
Operating SPR capacity (Visakhapatnam, Mangalore, Padur): 39.1 million barrels.
Fill level as of January 31, 2026: ~33 million barrels (≈84%). Over three months, an additional 3 million barrels were purchased using budget funds allocated in February 2025.
Commercial inventories at refineries remain at a comfortable level of ≈26 days of processing; growth is logistically constrained (Jamnagar port loaded >95%).
Demand Takeaway
China has built up reserves, but levels remain below the administrative target (35 days). This creates a window for sustained high imports, especially at discounts. India is near its SPR ceiling; further purchases depend on storage expansion (Chambala-2 project, 2027).
Reference: Top 10 Oil Importers (2024)
China — 11.1 mb/d India — 5.2 mb/d USA — 5.0 mb/d (imports heavy crude for blending) Japan — 2.8 mb/d South Korea — 2.7 mb/d Germany — 1.9 mb/d Netherlands — 1.8 mb/d (Rotterdam — EU's "gateway") Italy — 1.5 mb/d Spain — 1.3 mb/d Singapore — 1.2 mb/d
OPEC+ Decisions and Market Impact (Updated January 2026)
November 30, 2025 (35th Ministerial Meeting)
Decision: Extend voluntary group cuts of 2.2 mb/d through Q1 2026. Effective period: January 1 – March 31, 2026.
March 3, 2026 (Expected)
In-person meeting in Riyadh. Will consider gradual unwinding of voluntary cuts starting Q2 2026, contingent on "sustained demand growth and declining OECD commercial inventories."
Why Specifically Until March 31, 2026?
Seasonal demand: Q1 is traditionally weaker for consumption; extending cuts helps prevent inventory buildup.
Market uncertainty: January–February brought EU recession risks and Suez Canal logistics disruptions.
Tengiz incident: The 0.45 mb/d reduction from Kazakhstan further tightens the balance, prompting OPEC+ to "play it safe" and maintain discipline.
Price Expectations
Confident bullish bias amid OPEC production cuts leading up to the next meeting.
Key level and first target: 73.30 USD
Scenario A: Cuts Unwound on March 3
Price returns to 59 USD Followed by a correction to 64 USD (China restocks at a discount) Further decline to 52 USD possible — I lean toward this scenario
Scenario B: Cuts Extended for Another Quarter
Sideways movement: 72–76 USD Potential spike to 80–81 USD Then retracement to 68.50 USD
Why I Consider Scenario B Unlikely
The weighted-average discount on Russian barrels vs. Brent is ≈12 USD/barrel; during congestion or rising freight rates, it temporarily widens to 14–15 USD.
Meaningful damage to the Russian economy only occurs when oil revenues fall below 70 USD.
Sanctions are designed to keep oil prices within a range that is painful for Russia. Therefore, prices will absolutely not be allowed above 82 USD.
In other words, to maintain sanctions effectiveness during the conflict, the logical approach is to cap prices at 74 USD.

BTC Forecast Update – January 14, 2026 (EN - 26.01.2026)Good day, folks!
As promised, here is my updated view of the market.
Daily-chart snapshot
The range-bound phase is over: buyers have accumulated positions and launched an attack.
What I expect next
• After a breakout and solid close above USD 98 400, I’m looking for a three-week accumulation cycle. During this pause, longs will partially take profit while re-loading for the next push toward USD 113 500.
• A decisive assault on the USD 122 500 target is very likely.
• Based on the likely news flow, speculative positions will probably be trimmed by autumn, opening the door to a deep year-end correction.
• Longer-term, I still see an objective at USD 103 400.
Tactics right now
Today’s spike will almost certainly stall around the current level. This is an ideal zone to lock in gains and watch from the sidelines until fresh confirmation appears.
My broader stance on BTC and rates was laid out in earlier posts on dominance—see the linked ideas.
What I love about markets (and math) as a die-hard techie is their cyclicality. That’s exactly what we’re witnessing on this chart.
Key check-in dates: late February, late May, July–August.
P.S. English translation of my 14-Jan-2026 outlook.
NFA. DYOR.
#BTC #SinnSeed
As of 26 Jan 2026, the targets remain unchange

#EURUSD Roadmap if the Plaza Accord Scenario is ConfirmedFed and NY Fed Actions on USD/JPY: Last week, reports emerged that the Federal Reserve Bank of New York conducted so-called "rate checks" on USD/JPY — technical consultations that often precede currency intervention. This was indeed interpreted by the market as a signal of readiness to support the yen, although no direct interventions have occurred yet — only the possibility of them.
Important: Despite the absence of direct interventions, the market reacted to the rumors: the dollar weakened against the yen, and the dollar index pulled back, as investors remember the power of coordinated actions similar to the Plaza Accord.
The news is generally credible, however, it's important to note that we're currently only discussing the possibility of intervention and talks about a new version of the Plaza Accord — not an actual agreement or joint operations. Real economic consequences will depend on whether practical actions follow the statements and "rate checks."
If the news is confirmed. Here's my new roadmap for the pair:
Weekly chart analysis. Identifying key historical levels.
Daily chart analysis. Determining impulse movement targets and projected correction levels.
Summary:
We've broken out of the accumulation zone on impulse from the news.
Nearest target: 1.22
Next target: 1.24 (possible sideways movement, partial profit-taking, position accumulation)
If intervention news is confirmed:
New target: 1.28
Correction (likely): 1.24
Final target: 1.30
Reversal.
And here's where it gets interesting.
Weak #USD = Strong #BTC

USDRUB — Current Thoughts — 01/25/2026 — What's Next?Good day, friends.
Today we'll analyze the USDRUB pair and try to predict where the ruble is heading.
Obviously, the exchange rate is currently under manual control, but still.
Let's start with the big picture
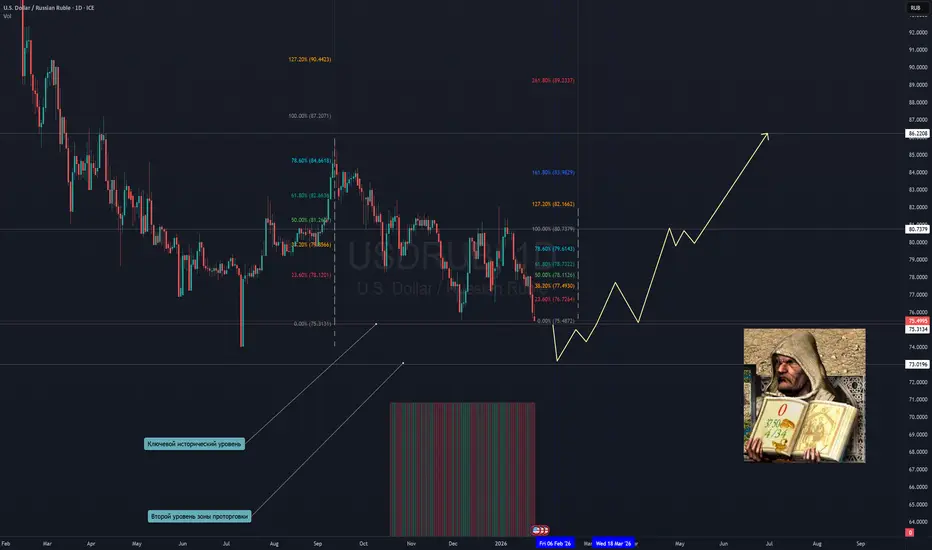
We can observe that the price is at a key historical level — roughly the same level as before the conflict began.
The second level of interest lies in key accumulation zones. In this zone, we can expect potential consolidation if the regulator continues pumping the market with foreign currency.
Now, let's zoom in — the price is being pushed toward a key level.
Why is that?
Let's look at the news. The main points:
CMASF (Center for Macroeconomic Analysis and Short-term Forecasting) — an analytical center close to the Russian government — warns of a high probability of a banking crisis in the second half of 2026 and a possible recession by October 2026 (due to loan servicing problems among households and businesses, as well as rising delinquencies).
NWF (National Wealth Fund)
The Fund is injecting one trillion rubles into state banks following warnings about an impending banking crisis.
Information about NWF injections into state banks fully corresponds to official data from Russia's Ministry of Finance, published on January 20, 2026.
NWF Injections into State Banks:
• VEB.RF — 1,319.0 billion RUB (deposits and subordinated deposits)
• VTB — 293.2 billion RUB (subordinated deposits)
• Gazprombank — 204.1 billion RUB (subordinated deposits)
• Sberbank — 94.2 billion RUB (subordinated deposit)
• Sovcombank — 29.6 billion RUB (subordinated deposit)
Earlier, Bloomberg reported that executives of Russia's largest banks discussed the possibility of seeking government support due to rising bad loans.
But the devil is in the details, and the name of that detail is — the Central Bank's Fiscal Rule.
What It Is and How It Works
The CBR Fiscal Rule is a mechanism that directly links government spending (including from the NWF) to the exchange rate through automatic liquidity sterilization.
Simplified scheme:
When the Ministry of Finance spends NWF money to support banks, it pumps rubles into the economy.
This creates excess liquidity, which can cause inflation and weaken the ruble.
The Central Bank sells foreign currency from its reserves on the domestic market to absorb excess rubles and ease pressure on the exchange rate.
Simultaneously, the CBR could raise interest rates (making credit more expensive) to sterilize excess liquidity.
💥 Why the Fiscal Rule Is Currently Working Against the Ruble
Problem #1: Depletion of Foreign Currency Reserves
In January 2026, the CBR sharply increased currency sales — by 17.42 billion rubles daily. This is twice as much as at the end of 2025.
The paradox: The more the NWF spends on bank support, the faster the CBR is forced to dump currency to prevent inflation. But currency reserves are finite — according to the data above, the liquid portion of the NWF has shrunk to 4.08 trillion rubles (~1.9% of GDP).
Problem #2: The Cost of Money Trap
• CBR sells currency → USD supply increases → Weakens ruble ↓ • CBR raises rates → Attracts investment → Strengthens ruble ↑ • MinFin spends NWF → Pumps rubles into economy → Weakens ruble ↓
Problem #3: Loss of Rate Maneuverability
Currently, the CBR is in a contradictory position: • Upward pressure on rates: NWF spending generates excess rubles and inflationary pressure, requiring higher rates. • Downward pressure on rates: Banks are in crisis and need lower rates for debt servicing.
Expected trajectory: The CBR plans to reduce the average key rate from the current ~19% to 13% in 2026.
When rates start to decline, this will directly undermine the attractiveness of ruble-denominated assets for foreign investors, creating additional pressure on the currency.
Current Situation (January 2026)
The Ministry of Finance is actively increasing currency sales under the fiscal rule:
• In January–early February, the volume of gold and currency sales will increase.
• This has led to temporary ruble strengthening below 78 RUB/USD.
• However, this is a short-term effect.
🎯 Conclusions on the Fiscal Rule's Impact on USD/RUB
Final assessment: The fiscal rule in this context is not a panacea but a delaying mechanism. It buys time but simultaneously accumulates risks through NWF depletion. If the banking crisis hits (H2 2026) and even larger injections are needed, the system could quickly collapse, causing sharp ruble depreciation.
📊 Current NWF Liquidity Level (as of January 1, 2026)
NWF liquid assets totaled:
• 4.085 trillion rubles or 52.2 billion USD
• This is ~1.9% of GDP (for comparison: at the beginning of 2024, it was ~7% of GDP)
NWF Structure (end of December 2025):
• Total volume: 13.42 trillion rubles (6.2% of GDP)
• Liquid portion: 4.08 trillion rubles (30% of total)
• Illiquid portion: 9.34 trillion rubles (stocks, gold, real estate)
Depletion Rate: Critically High
Over one year (2025), the liquid portion decreased by approximately 1.5–2 trillion rubles due to:
Injections into state banks: 1.02 trillion rubles
Budget deficit financing: unofficially another ~0.5–0.7 trillion rubles
Currency revaluation losses: foreign currency depreciates when the ruble weakens
The currency position is particularly vulnerable: • Chinese yuan reserves fell to 209.15 billion yuan — the lowest since the fund's creation. • This indicates maximum currency sales to support the ruble exchange rate.
🚨 Budget Pressure in 2026
Planned budget deficit: 3.8 trillion rubles
Officially approved by the State Duma:
• Revenue: 40.3 trillion rubles
• Expenditure: 44 trillion rubles
• Deficit: 3.8 trillion rubles (1.8% of GDP)
• From NWF: only 38.5 billion rubles (officially)
The NWF was created as a buffer for rainy days, but it is currently being spent to maintain the current economy. This means there is no safety cushion, and the first serious shock (banking crisis, oil price collapse, new sanctions) will lead to an uncontrolled crisis in late 2026 – early 2027.
Some may beat their chest and claim that sanctions don't work, but...
The treasury is running dry, milord.
⏰ Depletion Forecast: 3 Scenarios (assuming current sanctions persist)
Scenario 1: BASELINE (1.5–2 trillion RUB/year spending from NWF)
At the 2025 pace:
• Jan 1, 2026 — 4.08 trillion RUB — Current state
• Jan 1, 2027 — 2.0–2.5 trillion RUB — Critical level
• Jan 1, 2028 — 0.5–1.0 trillion RUB — Rock bottom
Scenario 2: ACCELERATED (2.5–3 trillion RUB/year spending)
This scenario develops if:
• The banking crisis starts earlier (Q2 2026 instead of H2 2026)
• Bank injections increase from 1.02 trillion to 2+ trillion rubles per year
• The budget deficit expands (due to military operations, sanctions, revenue decline)
Timeline:
• Jan 1, 2026 — 4.08 trillion RUB
• Jul 1, 2026 — 2.5–2.8 trillion RUB — Crisis begins
• Jan 1, 2027 — 1.5–1.8 trillion RUB — Panic begins
• Jul 1, 2027 — ~0 trillion RUB
Scenario 3: OPTIMISTIC (replenishment from oil & gas revenues)
Conditions:
• Brent oil price stable at 70–72 USD/barrel
• IMF forecasts 62.13 USD/barrel average for 2026
• Current prices: 66–70 USD/barrel
Calculation:
If oil holds at 70 USD/barrel, annual oil & gas revenues will be ~10–10.5 trillion rubles. With planned NWF spending of 38.5 billion rubles (per the official 2026 budget), the fund:
• Will be replenished by approximately 1–2 trillion RUB per year
• Depletion will be postponed by 5–7 years
(However, news about the seizure of the shadow fleet doesn't add much optimism here.)
📈 Key Monitoring Checkpoints
• Jan 1, 2026 — 4.08 trillion — Current state
• Apr 1, 2026 — 3.2–3.5 trillion — Q1: budget & bank support
• Jul 1, 2026 — 2.5–2.8 trillion — Possible crisis onset
• Oct 1, 2026 — 1.8–2.2 trillion — Panic begins (new injections)
💥 What Happens When the NWF Is Depleted
Short-term effect (1–3 months before depletion):
Markets will panic:
• Speculation on ruble weakening → massive capital outflow
• Accelerating inflation → CBR forced to raise rates despite the crisis
• Chaos in the currency market — CBR may introduce exchange controls
Scenarios (from most to least likely):
Introduction of currency controls
Sharp ruble depreciation (110–130 RUB/USD)
Depositor panic, bank runs
Bank defaults (payment failures)
Devaluation, restructuring
Related Conclusion
To negotiate sanctions relief in the context of a Russia-Ukraine ceasefire, there are approximately 3 years left.
Otherwise, things will get very tough.
To cover the budget deficit, our government officials, out of love for the people and economic necessity, will invent even more taxes and fees. The one-party system will easily pass any law.
Raising the retirement age, pension points, VAT increases — these are just flowers.
📉 Forecast Thoughts
If the CBR continues currency sales — ruble strengthening to 73 RUB.
A spike down to 72 is possible.
Keep in mind that they need to push the rate to a level where there's enough buffer when rates are cut.
Consolidation is possible amid Q1 injections, followed by expected growth.
First growth target: 80.70
Second target: 87–90
Possible scenario breaker: Progress in negotiations.
On positive news with official confirmation, the ruble could strengthen sharply (which isn't great for business, but that's another story).
What do you think?
With Respect to Everyone, Your #SinnSeed