#SKL/USDT - shorters will get rekt!#SKL
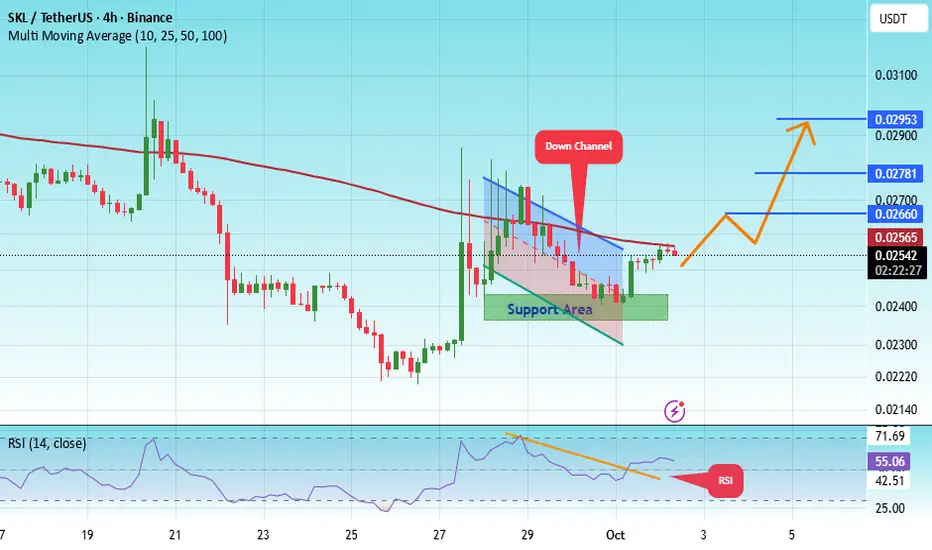
The price is moving within a descending channel on the 1-hour frame, adhering well to it, and is heading for a strong breakout and retest.
We have a bearish trend on the RSI indicator that is about to be broken and retested, which supports the upward move.
There is a major support area in green at 0.02412, representing a strong support point.
We are heading for consolidation above the 100 moving average.
Entry price: 0.02545
First target: 0.02660
Second target: 0.02781
Third target: 0.02950
Don't forget a simple matter: capital management.
When you reach the first target, save some money and then change your stop-loss order to an entry order.
For inquiries, please leave a comment.
Thank you.
Sklusdtlong
#SKL/USDT#SKL
The price is moving within a descending channel on the 1-hour frame, adhering well to it, and is heading for a strong breakout and retest.
We have a bearish trend on the RSI indicator that is about to be broken and retested, which supports the upward breakout.
There is a major support area in green at 0.02800, representing a strong support point.
For inquiries, please leave a comment.
We are in a consolidation trend above the 100 Moving Average.
Entry price: 0.02970
First target: 0.03050
Second target: 0.03117
Third target: 0.03200
Don't forget a simple matter: capital management.
When you reach the first target, save some money and then change your stop-loss order to an entry order.
For inquiries, please leave a comment.
Thank you.

SKLUSDT Forming Bullish WaveSKLUSDT is showing signs of forming a strong bullish wave pattern, which could be a major signal for an upcoming explosive move. The structure indicates that price action is gradually building momentum and preparing for a breakout. With solid trading volume supporting this setup, SKLUSDT has the potential to deliver massive upside gains in the near term, with expectations ranging from 190% to 200%+.
This bullish wave pattern suggests accumulation and growing investor confidence. Historically, similar setups have triggered sharp rallies once resistance levels are broken, and SKLUSDT appears to be following a comparable path. The presence of higher lows and steady market activity strengthens the outlook, pointing towards a sustained upward push once a breakout occurs.
Investor sentiment is also favoring SKLUSDT as interest in this project continues to rise. A clean breakout above the resistance zone could unleash strong bullish momentum, driving prices to new levels and attracting even more buyers into the market. With these factors in play, SKLUSDT is positioned as one of the crypto pairs to watch closely for substantial growth potential.
✅ Show your support by hitting the like button and
✅ Leaving a comment below! (What is You opinion about this Coin)
Your feedback and engagement keep me inspired to share more insightful market analysis with you!

SKL/USDT — Consolidation at a Critical Demand Zone, Big Move?Currently, SKL/USDT is trading around 0.0296 USDT, sitting right inside the historical demand zone (0.026 – 0.030) that has acted multiple times as a strong pivot. This area is a decision point: whether the bulls defend it or the bears break it will define the next major trend.
---
🔎 Structure & Price Pattern
1. Key Demand Zone (yellow box)
Price is consolidating after a sharp rejection from the August spike. This zone reflects accumulation, where buyers are absorbing supply to prevent a deeper breakdown.
2. Sideways Consolidation
Daily candles show small bodies with multiple wicks, signaling indecision. Such phases often precede a strong breakout move.
3. Layered Resistances (yellow dashed lines)
Several resistances stand above the current level: 0.0373 – 0.0495 – 0.0617 – 0.0696 – 0.0798 – 0.0859. Each can serve as a profit-taking zone or temporary rejection point.
4. Liquidity Grab (August spike)
The sharp August rally that quickly reversed looks like a liquidity sweep — stop orders above were taken before the retracement. Now, the retest of demand may set the base for a larger move.
---
🚀 Bullish Scenario
Main trigger: Daily close above 0.03730 USDT → signals strength and opens the way higher.
Targets:
0.0373 (+26%) → first breakout level.
0.0495 (+67%) → mid target.
0.0617 (+108%) → extended target.
0.0859 (+190%) → retest of previous swing high.
Risk/Reward setup: Example — Entry at 0.0296, stop at 0.025 (−15.5%), target 0.0495 (+67%) → RR ~ 4.3 : 1.
📌 This scenario holds if demand remains intact and bullish candles form with strong volume.
---
⚠️ Bearish Scenario
Main trigger: Daily close below the demand zone (0.026 – 0.030).
Downside targets:
0.0190 (−36% from current price).
0.01579 (−46% from current price, previous major low).
Breakdown would likely resume the bearish trend with deeper correction risk.
📌 This scenario becomes valid if buyers fail to defend the zone and strong selling pressure emerges.
---
🧠 Market Psychology
Bulls are building a base at demand, trying to defend this key zone.
Bears are still pressing, evident from repeated rejections at resistance.
This is the “battlefield zone” — whichever side wins will dominate the coming weeks.
---
🎯 Conclusion
0.026 – 0.030 is the make-or-break zone.
Breakout above 0.0373 → potential rally with >100% upside.
Breakdown below demand → risk of decline to 0.019 – 0.01579.
Best strategy: wait for a daily close confirmation before committing to a trade.
---
#SKLUSDT #SKL #CryptoAnalysis #Altcoin #CryptoTrading #PriceAction #SupportResistance #TechnicalAnalysis

SKLUSDT – Possible Reversal in PlaySKL shows a change of character (ChoCH) after long consolidation and now trying to push upward. Price already retested the zone, giving a chance for continuation if momentum holds.
Entry: 0.0310 - 0.0307
Stoploss: 0.0297
Targets:
0.0326
0.0339
0.0360
Let’s see if SKL can maintain strength and push into higher targets.

SKLUSDT Forming Descending ChannelSKLUSDT is currently trading within a descending channel pattern, a technical structure that often signals a potential bullish reversal once price breaks above the channel resistance. The steady trading volume indicates active participation from both buyers and sellers, but with the pattern narrowing, the balance is slowly tipping in favor of the bulls. Based on the current chart structure, a confirmed breakout could pave the way for a 40% to 50%+ upside move in the near term.
The price action shows multiple touches on both channel boundaries, confirming the validity of the pattern. Historically, descending channels tend to resolve upward when accompanied by healthy volume, as it signals that accumulation is taking place beneath the surface. A breakout with strong momentum could trigger a rapid push toward the projected profit targets, offering a favorable risk-to-reward ratio for traders positioning early.
Investor sentiment around SKLUSDT is improving, with more market participants taking interest in the project’s potential. This technical setup, combined with rising attention, creates an environment where any bullish catalyst — such as positive news, market-wide rallies, or on-chain developments — could spark a decisive upward move. Monitoring the breakout zone closely will be key to catching this opportunity at the right time.
✅ Show your support by hitting the like button and
✅ Leaving a comment below! (What is You opinion about this Coin)
Your feedback and engagement keep me inspired to share more insightful market analysis with you!

SKLUSDT Signals Potential Trend Reversal!SKLUSDT has broken above a long-standing descending Channel resistance on the daily timeframe. This breakout is backed by a noticeable increase in trading volume, signaling renewed buying interest after months of consolidation.
The chart setup indicates a potential shift in market structure from a prolonged downtrend into an accumulation-to-uptrend phase. If the breakout sustains above the $0.027 level, we could see a 50%–125% move in the coming weeks.
Cheers
Hexa

SKL WEEKLY CHART CONFIRMS IT: THE BOTTOM IS IN! 🔥 THE BOTTOM IS IN! 🔥
This weekly chart is EXACTLY what smart money looks for before accumulating! LSE:SKL just printed 3 CONSECUTIVE GREEN WEEKLY CANDLES for the first time since November 2024! 📈
💎 MACRO REVERSAL SIGNALS:
Clear double bottom formation at $0.020 (STRONGEST support level)
Weekly RSI turning up from oversold territory
Increasing volume (104.02M) on green candles = ACCUMULATION PHASE
Three-week uptrend breaking the 6-month downtrend pattern
🚀 BITE PROTOCOL CATALYST:
The timing couldn't be more PERFECT! While the chart shows a technical reversal, Skale's BITE Protocol provides the fundamental catalyst that could send this FLYING! No other L1/L2 has solved the MEV extraction problem this elegantly!
🔮 WHAT THIS WEEKLY CHART TELLS US:
We've completed the "Smart Money Accumulation" phase
Major resistance at $0.035 (once broken, expect rapid moves to $0.05)
Previous bull cycle took SKL from $0.02 to $0.08 (+300%) in just 4 weeks (Nov-Dec 2024)
Current setup is IDENTICAL but with stronger fundamentals!
⏰ THE WINDOW IS CLOSING:
Weekly charts don't lie - whales have been quietly accumulating since March! Once we clear $0.03, expect FOMO to kick in and drive this to previous resistance at $0.08.
The weekly timeframe CONFIRMS what the technicals already told us - SKL is primed for a major move up with the BITE Protocol as the perfect catalyst!
Don't miss the chance to buy at these prices - they won't last! 💰🚀
#SKL #WeeklyAnalysis #BITEProtocol #CryptoGems

SKLUSDT 1W AnalysisSKL ~ 1W Analysis
#SKL Buy gradually from here with a short -term target of at least 20%+. This is the lowest support for now.

#SKL/USDT#SKL
The price is moving in a descending channel on the 1-hour frame and is expected to continue upwards
We have a trend to stabilize above the moving average 100 again
We have a descending trend on the RSI indicator that supports the rise by breaking it upwards
We have a support area at the lower limit of the channel at a price of 0.02733
Entry price 0.02916
First target 0.03010
Second target 0.03090
Third target 0.03200

SKLUSDT 1WSKL ~ 1W Analysis
#SKL If you still have a Conviction on this coin,. Maybe this support block will be a very good place of buy for now.

Long-Term Investors – These Are Prime Buy Zones! “Listen, if you’re thinking long-term, stop overcomplicating it. These are great accumulation zones – whether it’s the blue box or just around these levels, it doesn’t really matter. Small details don’t make big money!”
Why I Like This Setup:
Strong Buy Zones – Price is in an ideal range for accumulation, and long-term investors could see massive returns from these levels.
CDV + Volume Profile Matter – If lower time frame breakouts confirm, this becomes an even stronger entry.
Don’t Miss the Bigger Picture – People worry too much about tiny differences. If the macro setup is strong, that’s all that counts!
Final Thoughts:
“I’m tracking CDV, volume profile, and liquidity heatmap closely. The setup is there, the opportunity is real, and long-term buyers might look back at this as an absolute steal!”
Don’t overthink it – just position smartly and let the market do the work! 🚀🔥
Let me tell you, this is something special. These insights, these setups—they’re not just good; they’re game-changers. I've spent years refining my approach, and the results speak for themselves. People are always asking, "How do you spot these opportunities?" It’s simple: experience, clarity, and a focus on high-probability moves.
Want to know how I use heatmaps, cumulative volume delta, and volume footprint techniques to find demand zones with precision? I’m happy to share—just send me a message. No cost, no catch. I believe in helping people make smarter decisions.
Here are some of my recent analyses. Each one highlights key opportunities:
🚀 RENDERUSDT: Strategic Support Zones at the Blue Boxes +%45 Reaction
🎯 PUNDIXUSDT: Huge Opportunity | 250% Volume Spike - %60 Reaction Sniper Entry
🌐 CryptoMarkets TOTAL2: Support Zone
🚀 GMTUSDT: %35 FAST REJECTION FROM THE RED BOX
🎯 ZENUSDT.P: Patience & Profitability | %230 Reaction from the Sniper Entry
🎯 DEXEUSDT %180 Reaction with %9 Stop
🐶 DOGEUSDT.P: Next Move
🎨 RENDERUSDT.P: Opportunity of the Month
💎 ETHUSDT.P: Where to Retrace
🟢 BNBUSDT.P: Potential Surge
📊 BTC Dominance: Reaction Zone
🌊 WAVESUSDT.P: Demand Zone Potential
🟣 UNIUSDT.P: Long-Term Trade
🔵 XRPUSDT.P: Entry Zones
🔗 LINKUSDT.P: Follow The River
📈 BTCUSDT.P: Two Key Demand Zones
🟩 POLUSDT: Bullish Momentum
🌟 PENDLEUSDT.P: Where Opportunity Meets Precision
🔥 BTCUSDT.P: Liquidation of Highly Leveraged Longs
🌊 SOLUSDT.P: SOL's Dip - Your Opportunity
🐸 1000PEPEUSDT.P: Prime Bounce Zone Unlocked
🚀 ETHUSDT.P: Set to Explode - Don't Miss This Game Changer
🤖 IQUSDT: Smart Plan
⚡️ PONDUSDT: A Trade Not Taken Is Better Than a Losing One
💼 STMXUSDT: 2 Buying Areas
🐢 TURBOUSDT: Buy Zones and Buyer Presence
🌍 ICPUSDT.P: Massive Upside Potential | Check the Trade Update For Seeing Results
🟠 IDEXUSDT: Spot Buy Area | %26 Profit if You Trade with MSB
📌 USUALUSDT: Buyers Are Active + %70 Profit in Total
🌟 FORTHUSDT: Sniper Entry +%26 Reaction
🐳 QKCUSDT: Sniper Entry +%57 Reaction
📊 BTC.D: Retest of Key Area Highly Likely
This list? It’s just a small piece of what I’ve been working on. There’s so much more. Go check my profile, see the results for yourself. My goal is simple: provide value and help you win. If you’ve got questions, I’ve got answers. Let’s get to work!

#SKL/USDT#SKL
The price is moving in a descending channel on the 1-hour frame and is expected to continue upwards
We have a trend to stabilize above the moving average 100 again
We have a descending trend on the RSI indicator that supports the rise by breaking it upwards
We have a support area at the lower limit of the channel at a price of 0.04324
Entry price 0.04380
First target 0.04482
Second target 0.04622
Third target 0.04775

#SKL/USDT#SKL
The price is moving within a bearish channel pattern on the 4-hour frame, which is a strong retracement pattern
We have a bounce from a major support area in green at 0.03500
We have a tendency to stabilize above the Moving Average 100
We have a downtrend on the RSI indicator that supports the rise and gives greater momentum, upon which the price is based higher at the discount
Entry price is 0.04100
The first target is 0.04600
The second target is 0.05450
The third goal is 0.06670

SKLUSDT | Patience = ProfitabilityBoth the green line and the blue box are clean areas for ordering, but it would be better to act with the hourly reactions to be received from here. I am alarmed and waiting. There is no need to be FOMO, bull time is the time when there are deep corrections as well as extreme rises. There will be times when our entries arrive when they wonder if the trend is reversing.
Patience = Profitability
I don't overcomplicate things and add a ton of dirty crap to my charts, but you can check out the success of my analysis below.
I approach trading with confidence backed by experience and past success in identifying high-probability setups.
While I don’t claim to be the best, my track record speaks for itself, and I strive to let my analysis and results do the talking. Watch these levels closely—markets can confirm what charts already whisper. Let’s see how this plays out together.
My Previous Ideas
DOGEUSDT.P | 4 Reward for 1 Risk much more if you hold it.
RENDERUSDT.P | HTF Accuracy
ETHUSDT.P | Accurate Buyer Zone Identification | High Risk Reward if you hold it.
BNBUSDT.P | Accurate Buyer Zone Identification | High Risk Reward if you hold it.
Bitcoin Dominance | Great Characteristic Detection and Accurate Analysis

SKLUSDT 1WSKL ~ 1W
#SKL If retesting is possible, We mark this block of demand zones as a good buy for now.

#SKL/USDT#SKL
The price broke the last bear flag since May 2022
The Moving Average 100 was broken to the upside strongly.
The price moves in two waves.
The price now is 0.06400.
The first target is 0.07850.
The second goal is 0.11690.
This rise is supported by breaking the descending triangle pattern and breaking the moving average 100 and the MACD indicator.
We may see some correction before completing the rise.

SKL is copying its next move ,,I have a special fractal analysis by using some terms and I think we are waiting big and strong green soon up to the line or more!

SKL before big move!As my last idea for SKL witch was correct and target 30% in 2 days ..
Now we are here and waiting the big move inshallah!(if the God wills) ,,
watch the last idea for SKL in link below

#SKL/USDT | Ready to rise strong
#SKL
The price is moving in a perfect triangle on the 4-hour frame
Some correction is expected before the triangle breaks higher
We have oversold conditions on the MACD indicator
Entry price is 0.07220
First target 0.07500
Second goal 0.02180
Third goal 0.07991
Fourth goal 0.08284

SKLUSDTBINANCE:SKLUSDT is still in bullish form and can touch higher targets until key levels are broken
⛔"Daily crypto market analyses I provide are personal opinions & not financial advice. Trading carries risks, so do your own research & seek advisor's help.#DYOR"
Don't forget to like and comment

SKLUSDT - D1SKLUSDT
D1 - A 3-wave structure has been formed (also fixation behind the trend line), which can lead to further upward movement, you can also see the beginning of the 5th wave on W1 - it is better to consider targets for breaking the maximum of the 3rd wave on W1, since this was a strong impulse - 0.06982
What can you expect?
Long - You can consider entering from these levels 0.06982 with a target of 0.06982
Cancellation if the price breaks the minimum of the 3rd wave - 0.03607
Long
Target 0.05316 - 0.05710 - 0.06350 - 0.06982

SKL/USDT Looking BullishTRADE ALERT!SKL
Ticker: SKL/USDT
Entry: 0.0438 - 0.0446
Take Profit: 0.0483 - 0.0599
Stop Loss: 0.0404
Risk to reward: 1:2
Technical Thesis: It seems like SKL is on the verge of breaking out from a falling wedge pattern, indicating a potentially bullish trend. This breakout could lead to an increase in pump lines for SKL. Keep an eye on the charts for confirmation and potential trading opportunities.
