BNS (USA) - Scotiabank Pulling Back Into TrendBank of Nova Scotia has been on a very steady run lately, gaining around 67% over the last year. Commonly known as Scotiabank, they are one of the heavy hitters in Canadian banking but have a large footprint across the Americas. The stock has been trending well as they shift their focus toward more stable growth in the U.S. and Canada.
Fundamentally, the momentum seems to be coming from a solid turnaround plan . They’ve been selling off assets in parts of Latin America and recently took a significant stake in KeyCorp to grow their U.S. presence. Their last earnings report showed a healthy beat and improving profitability across the board. The recent dip in the share price was a reaction to the drop in the whole market and looks like normal profit-taking after such a strong multi-month move, especially with their next quarterly update coming up later this month.
Technically, the chart looks quite clean. The price has pulled back from its recent highs and is currently testing the 20-day SMA , which has acted as support throughout this trend. This move has brought the stock into a much better value area for anyone following the trend. The RSI has reset from overbought levels down to a neutral 55/56, and while the MACD is cooling off , it doesn't look like the trend is broken.
If you like slow and steady, this might be one to keep an eye on.
..................................................
PLEASE NOTE: Nothing I post is trading advice. All investing involves risk, and past performance doesn’t predict future results. Trends can and do end. For 2026 , my goal is to try and post one new asset each day. Something outside the usual gold, silver, BTC, or big tech names. I like to find stocks worldwide showing steady trends with some good gains, a recent pullback, and signs of renewed strength. I don’t necessarily hold positions in these. They are simply companies I find interesting at the time of posting. I’ll often revisit them within a week to see how they went and share any updates. If you enjoy these posts, please BOOST and FOLLOW ME to discover more under-the-radar stocks and businesses from around the world.
..................................................
Sma

TAKE (India) - Rapid Runner Resuming its Run?Take Solutions Limited has been on a rip over the last few months, racking up gains of over 260% .
Fundamentally, TAKE is much more than a generic tech firm. They are a strong player in the Life Sciences space, operating as a full-service CRO (Contract Research Organization). They support pharma and biotech companies globally, handling everything from Clinical Research and Generics Development to the complex world of Pharmacovigilance (drug safety). With a client roster that includes both large innovator biopharma names and generics manufacturers, they have the "best-in-class" systems to drive outcomes. The market seems to be waking up to the value of this specialized expertise and their global reach.
Technically, the chart is taking a breather. The price hit a resistance level near 45 and we got a deep pullback wick all the way down to 35. The 50 Day ended up providing support, and we have just broken back up above the 20 day which is a classic area for trend traders to step back in. The RSI has reset from overbought levels down to a healthy 58, clearing out some of the FOMO action that was happening.
Could be worth a watch to see if the 20-day line holds.
..................................................
PLEASE NOTE: Nothing I post is trading advice. All investing involves risk, and past performance doesn’t predict future results. Trends can and do end. For 2026 , my goal is to try and post one new asset each day. Something outside the usual gold, silver, BTC, or big tech names. I like to find stocks worldwide showing steady trends with some good gains, a recent pullback, and signs of renewed strength. I don’t necessarily hold positions in these. They are simply companies I find interesting at the time of posting. I’ll often revisit them within a week to see how they went and share any updates. If you enjoy these posts, please BOOST and FOLLOW ME to discover more under-the-radar stocks and businesses from around the world.
..................................................

Nippon Seiki (Japan) - Tech Leader Testing Another RunNippon Seiki Co Ltd has been a standout performer in the Japanese market lately, putting up a gain of over 120% in the last twelve months. Based in Nagaoka, they are a major global player in automotive and motorcycle instrumentation, specifically known for their high-end head-up displays (HUDs) and digital clusters . While many know them for their car tech, their recent momentum has actually been supercharged by massive demand for motorcycle displays across India and Southeast Asia .
Fundamentally, the story here is about shifting gears and better margins. While the car market in China has been a bit sluggish, the company has offset that with explosive growth in the two-wheeler segment. They also recently updated how they collect development costs from customers, which gave a nice boost to their operating profit. The recent minor pullback from the January highs seems to be simple profit-taking ahead of their Q3 earnings release in early February. It’s also worth noting they’ve been active with share buybacks and just confirmed a solid dividend , which usually helps keep a floor under the price.
Technically, the chart shows a classic trend-following setup. After a vertical move to start the year, the price has drifted back toward the 20-day moving average. This area has acted as a springboard several times over the last six months, and we are seeing price action start to stabilize right where you’d expect. The RSI has cooled off from overbought levels and is now sitting in a much more neutral zone, giving it room to move if the buyers step back in. The MACD is crossing lower, which confirms the short-term pause, but the long-term trend remains firmly pointing up.
Could be one to keep an eye on.
..................................................
PLEASE NOTE: Nothing I post is trading advice. All investing involves risk, and past performance doesn’t predict future results. Trends can and do end. For 2026 , my goal is to try and post one new asset each day. Something outside the usual gold, silver, BTC, or big tech names. I like to find stocks worldwide showing steady trends with some good gains, a recent pullback, and signs of renewed strength. I don’t necessarily hold positions in these. They are simply companies I find interesting at the time of posting. I’ll often revisit them within a week to see how they went and share any updates. If you enjoy these posts, please BOOST and FOLLOW ME to discover more under-the-radar stocks and businesses from around the world.
..................................................

CIEN (USA) - Optical Infrastructure Holding Key SupportCiena Corp has been a powerhouse in the infrastructure space, delivering a gain of around 200% over the last year. While the headlines focus on the AI chips, Ciena provides the massive optical plumbing needed to actually move that data around.
Fundamentally, the demand for bandwidth is clearly showing up in the numbers. Looking at the quarterly financials snapshot, revenue (the blue bars) hit a high in the most recent quarter, confirming that orders are flowing in. However, you’ll notice the net margin (the orange line) dipped recently. That kind of volatility isn't unusual when a company is scaling hard to meet a rush of demand. Costs often jump before efficiency kicks back in. The driver here remains the frantic build-out of data centers around the world requiring high-speed interconnects.
Technicals show a classic bull flag forming. The price has pulled back from its highs and consolidated above the 50-day SMA (the orange line), which has supported this run for months. We are now back up above the 20-day so will be good to see if it holds this level. You can see the RSI has reset from overbought levels down to a neutral 57, indicating a better value area people like to enter at. The MACD histogram is also shallowing out, suggesting the selling pressure is already drying up. It looks like a standard recovery period before the market decides on the next run.
Might be worth a watch.
..................................................
PLEASE NOTE: Nothing I post is trading advice. All investing involves risk, and past performance doesn’t predict future results. Trends can and do end. For 2026 , my goal is to try and post one new asset each day. Something outside the usual gold, silver, BTC, or big tech names. I like to find stocks worldwide showing steady trends with some good gains, a recent pullback, and signs of renewed strength. I don’t necessarily hold positions in these. They are simply companies I find interesting at the time of posting. I’ll often revisit them within a week to see how they went and share any updates. If you enjoy these posts, please BOOST and FOLLOW ME to discover more under-the-radar stocks and businesses from around the world.
..................................................

IRMD (USA) - Niche MedTech TrendingiRadimed has been a quiet achiever over the last year, racking up a gain of around 67% . Based in Florida, they dominate a very specific niche: non-magnetic medical devices designed to work safely inside MRI rooms. While the big tech names get all the headlines, this little player has established a strong, steady uptrend by owning its corner of the market.
Fundamentally, the story for 2026 is all about their new 3870 Infusion Pump . The rollout is gaining traction and looks to be a major revenue driver this year. The financials back this up with year on year revenue climbing steadily, and they run with impressive net margins around 26% . The recent pause in price likely comes down to two things: natural exhaustion after hitting all-time highs near $104 , and some recent insider selling by the CEO in January. With its next earnings reports only 2 days away, its more of a risky entry but the last couple it has run well - so be careful of your timing and risk management if you like the look of it before this time.
Technically, the chart shows a clear rhythm. The yellow circles I’ve marked showed what happened in the last couple of earnings announcements, and you can see how throughout the move the price typically respects those 20 and 50-day SMAs . Every time it dips into that zone, buyers step back in. Right now, we are seeing a tight consolidation just under the highs. The RSI has cooled off from overbought levels down to a healthy neutral zone, and the MACD is resetting. This "flagging" action often happens right before the next leg up, provided the $95-$98 support level holds.
Could be one to keep an eye on but be aware of the next couple of days and see what happens post earnings.
..................................................
PLEASE NOTE: Nothing I post is trading advice. All investing involves risk, and past performance doesn’t predict future results. Trends can and do end. For 2026 , my goal is to try and post one new asset each day. Something outside the usual gold, silver, BTC, or big tech names. I like to find stocks worldwide showing steady trends with some good gains, a recent pullback, and signs of renewed strength. I don’t necessarily hold positions in these. They are simply companies I find interesting at the time of posting. I’ll often revisit them within a week to see how they went and share any updates. If you enjoy these posts, please BOOST and FOLLOW ME to discover more under-the-radar stocks and businesses from around the world. ..................................................

LUN (Canada) - Copper Giant Resetting After A Solid RunLundin Mining has been a powerhouse lately, up roughly 270% since the lows in 2025. Based in Vancouver, this diversified miner produces copper, zinc, gold, and nickel from operations across the globe.
Fundamentally, on Jan 21st 2026 the company just released strong 2025 results, beating their original copper guidance with a record Q4 at their Caserones mine. However, the recent 13% drop seems to be a reaction to their 2026 outlook. While overall production is stable, they flagged lower mining rates at Candelaria for the first half of the year as they bring a mining contract in-house. The market likely used this "softer" start to 2026 as an excuse to take profits after such a massive run. The long-term story remains intact, with production expected to ramp back up in 2027.
Technically, the pullback has been orderly. The stock dropped to the 20-day SMA which has been providing support throughout the run and which is often where institutional support often steps in during strong trends like this one. The RSI has reset from overbought territory but is turning back up, and the price action inside the highlighted circle shows buyers are starting to absorb the selling pressure. Yesterday (Jan 24, 2026) Haywood Securities also raised their price target to $42 from $32 which shows confidence is still there.
Might be worth a watch if it can hold these levels.
..................................................
PLEASE NOTE: Nothing I post is trading advice. All investing involves risk, and past performance doesn’t predict future results. Trends can and do end. For 2026 , my goal is to try and post one new asset each day. Something outside the usual gold, silver, BTC, or big tech names. I like to find stocks worldwide showing steady trends with some good gains, a recent pullback, and signs of renewed strength. I don’t necessarily hold positions in these. They are simply companies I find interesting at the time of posting. I’ll often revisit them within a week to see how they went and share any updates. If you enjoy these posts, please BOOST and FOLLOW ME to discover more under-the-radar stocks and businesses from around the world. ..................................................

SLGL (USA) - Dermatology Trend Taking A BreatherSol-Gel has put in a massive performance over the last year, up around 600% and that's after the recent pull back. That is serious momentum. Based in Israel, they are a dermatology company specializing in treatments for skin conditions using a unique silica-delivery technology.
Fundamentally, there is still optimism here. Just recently, HC Wainwright & Co raised their price target to $110 , which is nearly double the current levels. That kind of analyst support often keeps a trend alive. The current pullback looks like standard profit-taking after the explosive move we saw earlier in the month.
Technically, the price action is cooling off. The stock has dipped from its highs but is holding well above the 50-day SMA. The RSI has come down from overbought territory to a more manageable 56. The MACD is crossing down, confirming the pause, but this consolidation could offer a better entry point if buyers step back in.
Given what buyers were very recently prepared to pay for it, and the analysts very recent $100+ target this may well be worth a watch.
..................................................
PLEASE NOTE: Nothing I post is trading advice. All investing involves risk, and past performance doesn’t predict future results. Trends can and do end. For 2026 , my goal is to try and post one new asset each day. Something outside the usual gold, silver, BTC, or big tech names. I like to find stocks worldwide showing steady trends with some good gains, a recent pullback, and signs of renewed strength. I don’t necessarily hold positions in these. They are simply companies I find interesting at the time of posting. I’ll often revisit them within a week to see how they went and share any updates. If you enjoy these posts, please BOOST and FOLLOW ME to discover more under-the-radar stocks and businesses from around the world.
..................................................

URB (Canada) - Financial Sector Play Still Under $10Urbana Corporation has quietly put together a solid run over the last year, gaining about 60% . Originally starting out decades ago as a gold mining explorer, the company has evolved into a diversified investment vehicle managed by Caldwell Investment Management. They primarily focus on a mix of U.S. financial companies and Canadian resource stocks, but what makes them unique is their heavy hand in private equity. It’s a way for regular investors to get exposure to private businesses and specialized financial infrastructure that usually isn't accessible on public exchanges.
Fundamentally, the momentum has been driven by the strength of the financial sector and steady growth in their underlying net asset value. They recently declared another dividend, continuing a long streak of annual increases which shows a lot of stability in their cash flow. The sharp drop we see on the chart over the last week is largely due to the stock going ex-dividend on January 16th. It’s a mechanical price adjustment rather than a signal that something is wrong with the business.
Looking at the chart, the price has had a healthy 13% pullback and dipped back under the 20-day SMA (the green line) after that dividend release. The RSI has cooled off significantly, dropping from overbought levels in the 80's back down to a neutral 52 but shows signs of heading back up again. I do also like that it is still sub $10. Its been above that the last week and I always think a $10 stock has a better chance of doubling and going to $20 than a $100 stock has of going to $200. Round numbers like $10 once broken through often become the new base. Its a psychological thing.
Need to see if it starts to head back up again when the market opens, but odds would suggest it will. Could be one to watch.
=======================================
PLEASE NOTE: Nothing I post is trading advice. All investing involves risk, and past performance doesn’t predict future results. Trends can and do end. For 2026 , my goal is to try and post one new asset each day. Something outside the usual gold, silver, BTC, or big tech names. I like to find stocks worldwide showing steady trends with some good gains, a recent pullback, and signs of renewed strength. I don’t necessarily hold positions in these. They are simply companies I find interesting at the time of posting. I’ll often revisit them within a week to see how they went and share any updates. If you enjoy these posts, please BOOST and FOLLOW ME to discover more under-the-radar stocks and businesses from around the world.
=======================================

AXTI (USA) - Up 900% over the last 12 months. Super Speculative!AXT Inc has had a bonkers run this year, posting gains of nearly 900% over the past twelve months. This company is a specialist in the semiconductor space, specifically making high-performance wafers for when standard silicon isn't enough. If you want to move data using light in an AI data centre which is becoming the standard, then according to them (and potentially their share price) you need the indium phosphide wafers these guys produce. It is classic "picks and shovels" play for the ongoing AI infrastructure build-out.
At the January 2026 Needham Growth Conference, AXT management emphasized their role as the only "pure-play" indium phosphide company available to investors. They explained that AI data centres are hitting a limit with copper wiring and are moving rapidly toward optical connectivity . This shift requires their wafers at both ends of the fibre optic cables. Management expects demand to double in 2026 and potentially double again in 2027. While they acknowledged risks involving Chinese export permits, they are doubling their capacity to capture market share from Japanese competitors, positioning themselves as a critical link in the AI hardware supply chain.
Full conference transcript here: www.tradingview.com
The fundamental story here is driven by a massive shift from copper to optical connectivity . As data speeds increase, the demand for their core material is expected to double annually for the next couple of years. The recent sharp drop in price looks like a mix of standard profit-taking after a vertical move and some nerves regarding Chinese export permits . Since they manufacture in China, they have to navigate some geopolitical bureaucracy, which adds a layer of risk but doesn't seem to have dampened the overall demand for their tech.
Technically, the stock went parabolic and has just had a big pullback. The price is currently moving back toward the 20-day SMA (the green line), which is a much healthier place to look at a trend follower than at the very top of a vertical spike. The RSI has reset from extremely overbought levels down to around 60, giving the chart some room to move again. While the MACD histogram shows that upward momentum is slowing for now, the primary trend remains very strong. It hasn't bounced yet, so it's too early to pick a direction, but still an interesting company at the cutting edge of technology.
Super speculative trade, but if their technology really is the main game in town and they can navigate Chinas export drama then it could be an interesting stock to keep an eye on.
==============================
PLEASE NOTE: Nothing I post is trading advice. All investing involves risk, and past performance doesn’t predict future results. Trends can and do end. For 2026 , my goal is to try and post one new asset each day. Something outside the usual gold, silver, BTC, or big tech names. I like to find stocks worldwide showing steady trends with some good gains, a recent pullback, and signs of renewed strength. I don’t necessarily hold positions in these. They are simply companies I find interesting at the time of posting. I’ll often revisit them within a week to see how they went and share any updates. If you enjoy these posts, please BOOST and FOLLOW ME to discover more under-the-radar stocks and businesses from around the world.
==============================

CM (USA) - Canadian Imperial Looking Interesting.Canadian Imperial Bank of Commerce has been a quiet and steady achiever lately, putting in a solid performance with a gain of around 50% over the last year. While the tech giants grab the headlines, this Canadian banking heavyweight has been trending steadily higher. It’s one of the "Big Five" banks in Canada, meaning it’s generally seen as a stable, dividend-paying bedrock for many portfolios. When a stock like this trends this consistently, I like to pay attention.
Fundamentally, the move seems driven by a mix of resilience in the Canadian economy and the market pricing in a more favorable interest rate environment for 2026. Banks like CM are highly sensitive to rates, particularly regarding their mortgage books, and the outlook for easing rates has likely helped lift the pressure on valuations. The recent pullback looks like standard profit-taking after a very strong run into the low 90s.
Technically, the chart is behaving exactly how a trend follower likes to see. The price has pulled back and has moved back up above the 20-day SMA. I've added a Bollinger band in there and you can see each time it has compressed and the price has cross up through the 20 day its had another run as shown by the highlighted areas. The RSI has cooled off from overbought territory back to a more neutral level, so lets see if history repeats.
Could be one to keep an eye on.
==============================
PLEASE NOTE: Nothing I post is trading advice. All investing involves risk, and past performance doesn’t predict future results. Trends can and do end. For 2026 , my goal is to try and post one new asset each day. Something outside the usual gold, silver, BTC, or big tech names. I like to find stocks worldwide showing steady trends with some good gains, a recent pullback, and signs of renewed strength. I don’t necessarily hold positions in these. They are simply companies I find interesting at the time of posting. I’ll often revisit them within a week to see how they went and share any updates. If you enjoy these posts, please BOOST and FOLLOW ME to discover more under-the-radar stocks and businesses from around the world.
==============================

PAF (London) - African Gold Miner on a RipPan African Resources PLC has been a massive standout on the London market, rallying over 220% in the last year. Based in South Africa, this mid-tier gold producer focuses on low-cost operations and tailings retreatment projects. The trend has been incredibly consistent, and might still be too extended, but we did just get a touch and bounce off that 20-day which has been consistently providing support.
The primary driver here is fairly clear - record gold prices. The company has been capitalizing on the global political uncertainty (which looks to continue) and the precious metals bull market, which has boosted margins and cash flow significantly. The recent pause in the stock price isn't necessarily bad news; it looks like a standard reaction to the underlying commodity cooling off slightly after its own run. The business case remains tied to the macro environment for gold, which is still looking robust.
Technically, the chart remains bullish but is in a tight consolidation phase. The price has pulled back to test the 20-day SMA (the green line), which has acted as immediate support throughout this entire rally. The RSI has cooled off from overbought levels down to a bit under 60, resetting the momentum without breaking the trend structure.
If you think the future of Gold is bright and shiny, this could be one to keep an eye on.
==============================
PLEASE NOTE: Nothing I post is trading advice. All investing involves risk, and past performance doesn’t predict future results. Trends can and do end. For 2026 , my goal is to try and post one new asset each day. Something outside the usual gold, silver, BTC, or big tech names. I like to find stocks worldwide showing steady trends with some good gains, a recent pullback, and signs of renewed strength. I don’t necessarily hold positions in these. They are simply companies I find interesting at the time of posting. I’ll often revisit them within a week to see how they went and share any updates. If you enjoy these posts, please BOOST and FOLLOW ME to discover more under-the-radar stocks and businesses from around the world.
==============================

007660 (Korea) - ISU Petasys Major Momentum RunnerISU Petasys Co., Ltd. has had an incredible run, gaining over 360% in the last year. Based in South Korea, they are a major player in manufacturing multi-layer printed circuit boards (PCBs) used in networking and AI infrastructure .
The fundamental story here is all about the demand for high-performance computing and data centres. As a supplier to global tech giants, they’ve ridden the AI wave hard. The recent pullback doesn't look like a business failure; it looks like standard profit-taking after the stock got a bit ahead of itself. The demand for high-spec network boards in the AI space remains a strong driver.
Technically, the pullback has been a deep 30% drop back into value . Price fell through the shorter-term averages and is now looking like it is recovering and moving away from the more critical 100-day SMA (the red line). This is often where longer-term trends find support after a deep correction. The RSI has cooled all the way down to a neutral 49, resetting the overbought conditions we saw earlier. The MACD is still negative, but the selling pressure seems to be slowing down as price consolidates in this zone.
Might be worth a watch to see if it runs again. AI led demand isn't going away any time soon.
==============================
ABOUT ME: Global TradingView Moderator (English) and full-time trader. I focus on top-performing stocks worldwide , trading momentum and clean trend continuations after pullbacks. I use a trailing stop customised for each stock to manage risk, lock in gains, and exit when the trend ends. Nothing I post is trading advice. I simply like to highlight interesting companies from around the world that may be worth a closer look. Please give this idea a BOOST if you found it interesting, and FOLLOW ME to discover more standout stocks and businesses from global markets.
==============================

RPL - PSX - Buy CallRoshan Packages Ltd on daily time frame, has experienced SMA 21 (blue) crossing over SMA 200 (yellow) - which is also known as Golden Cross. When this happens prices tend to move very sharply. One can Buy here at CMP however, technically very correct entry would be on crossing the Resistance nearby at 19.65.
RSI indicator also suggest that sentiments are going bullish steadily; however, KVO is suggesting a likely reluctance as volumes have dropped down.
Trade Values
Buy-1: 19.09 (CMP)
Buy-2: 19.65 (technically even better)
SL: 18.00
TP-1: 22.00
TP-2: 24.00

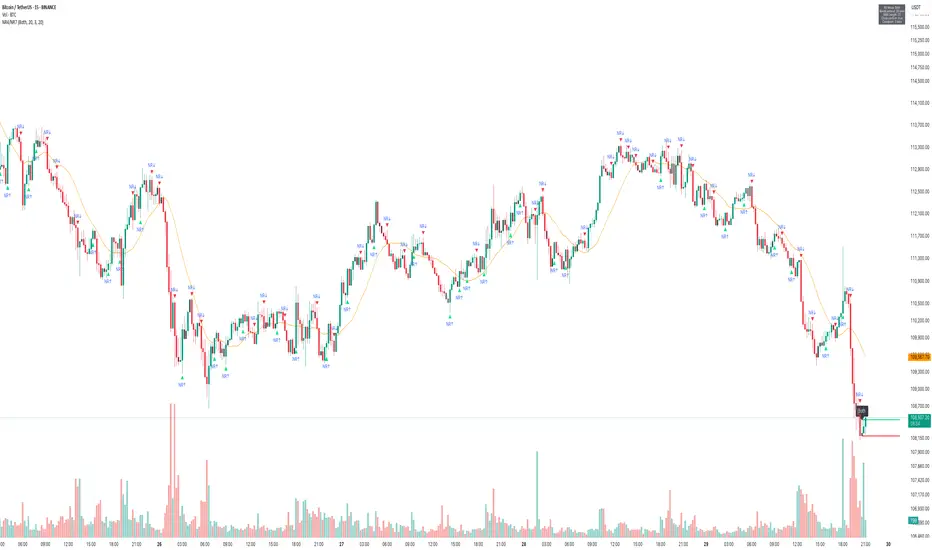
BTC Weekly more downside likelyBTC is currently holding support on the 100 sma on the weekly chart. Volume has been increasing as the downtrend progresses signaling increased selling pressure. I think the next weekly candle open will break below the 100 sma and go to test the next support area around 71,500. Not financial advice, do your own dd.

DOW JONES INDEX GOES 'FIGHT' vs 50-DAY BATTLE LINE AVERAGEThe Dow Jones Industrial Average (DJIA), commonly known as the Dow Jones index, is a stock market index that tracks 30 of the largest and most established U.S. companies.
It serves as a barometer for overall market and economic health, reflecting investor sentiment and trends in blue-chip stocks. From a technical analysis perspective, the Dow Jones is studied to identify price trends, support and resistance levels, and potential reversal points to guide trading and investment decisions.
One key technical indicator used in analyzing the Dow Jones index is the 50-day Simple Moving Average (SMA). The 50-day SMA calculates the average closing price of the index over the past 50 trading days, smoothing out short-term price fluctuations to highlight the intermediate-term trend. Traders and investors widely monitor the 50-day SMA because it balances responsiveness to recent price changes with reduced noise compared to shorter-term averages.
When the Dow Jones index price is above the 50-day SMA, it generally indicates an upward or bullish trend with potential support around the SMA level. Conversely, if the price falls below the 50-day SMA, it may signal a weakening trend or bearish sentiment. The 50-day SMA can also act as a dynamic support or resistance level where price reactions may occur due to the collective attention of market participants at this average.
Currently, the Dow Jones trades slightly below its 50-day SMA, which stands at approximately 46,840 points for Dow Jones Futures CBOT_MINI:YM1! .
This technical setup suggests caution as the index might face resistance near this average before a possible trend confirmation or reversal. The 50-day SMA is often used in conjunction with other indicators like the 200-day SMA to generate signals, such as the "Golden Cross" or "Death Cross," which signal major trend shifts.
In summary, the Dow Jones index technical perspective focuses on using the 50-day SMA as an intermediate trend indicator and key level of market interest, helping traders gauge momentum and potential price direction over the medium term.
--
Best wishes,
@PandorraResearch Team

EURUSD changing directioEUR/USD Finally Breaks Below Key Moving Averages | Technical Analysis Update
In this video, I share my latest EUR/USD analysis — the pair has finally broken below both the exponential (blue) and simple (red) moving averages, marking a potential shift in market structure after months of consolidation since February.
We go step by step through:
🔹Breaking under the EMA + SMA
Elliott Wave count & correction phase
🔹 Confirmation from the stochastic oscillator
🔹 Key trendline break setup
🔹 Fibonacci retracement (61.8%) and projection confluence
🔹 Short entry zones and target levels between 1.08 – 1.09
💡 Important: This is not financial advice — I’m just sharing my personal market analysis and thoughts. Always manage your risk and use proper stop-loss techniques.
If you enjoy detailed, no-nonsense technical breakdowns of the forex market, make sure to:
👍 Like the video
🔔 Subscribe to the channel for more EUR/USD, GBP/USD, and market updates

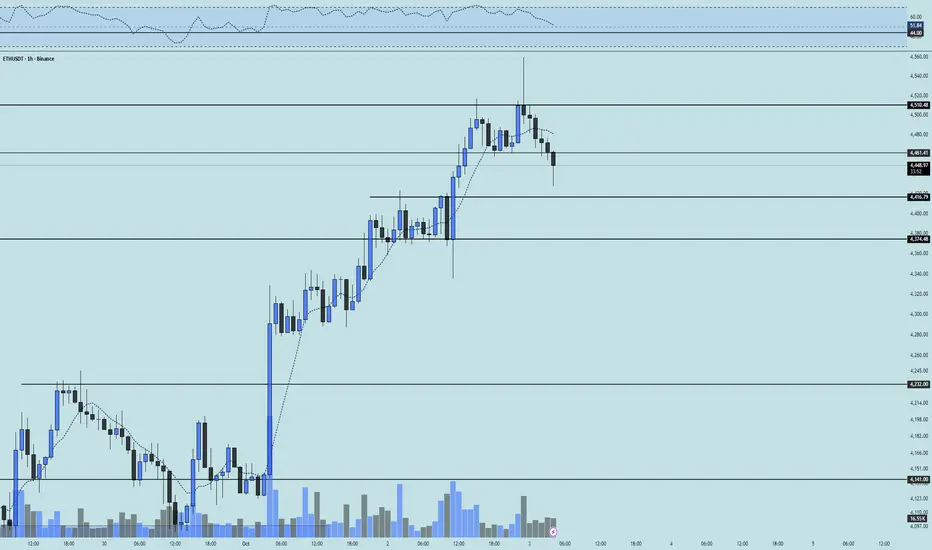
ETH 1H Analysis - Key Triggers Ahead | Day 30❄️ Welcome to the cryptos winter , I hope you’ve started your day well.
⏰ We’re analyzing ETH on the 1-Hour timeframe .
👀 On the 1-hour timeframe for Ethereum, we can see that after reaching its resistance area at $4510, it reversed from that zone and moved downward. At the same time, Ethereum had support at $4461; if this support breaks, it could enter a healthy correction and head toward its marked support levels, forming a new structure afterwards. At that point, we could consider entering an Ethereum position. However, since breaking the level highlighted in previous analyses, Ethereum has already gained 11% up to now.
🧮 Looking at the RSI oscillator, we see that for roughly a day it stayed above the 50 area up to the overbuy boundary near 70. The 70 zone then acted as a static resistance, preventing Ethereum from entering its overbought state. As a result, selling pressure started, and price is now heading toward its swing support around 44.
🕯 The volume, count, and size of buy candles during the recent upward leg were strongly increasing, but not as strong compared to Bitcoin, since Bitcoin dominance didn’t drop significantly. Consequently, now we see sell candles increasing after hitting the 4510 resistance, completing a pullback from its bullish leg.
💸 Looking at the BINANCE:ETHBTC trading pair, we see that it moved upward along with ETH/USDT, but the percentage move was weaker than the tether pair. Whale interest in this pair is currently low, and it may not hold strong weight for them, especially since Bitcoin dominance didn’t fall heavily in this phase. The next trigger level for a breakout and rally in ETH/BTC is around 0.03753; if that zone breaks, Ethereum’s relative value could increase significantly.
🧠 For an Ethereum position, I think we should wait until a new structure forms, with fresh support and resistance zones created by whales. Then, after a breakout of that new structure, we could enter a trade. Another reason I don’t have an immediate scenario for Ethereum is that it has already rallied 11% and is now within a corrective phase.
❤️ Disclaimer : This analysis is purely based on my personal opinion and I only trade if the stated triggers are activated .
BONK 4H Analysis – Key Triggers Ahead💀 Hey , how's it going ? Come over here — Satoshi got something for you !
⏰ We’re analyzing BONK on the 4-hour timeframe timeframe .
👀 In the 4-hour timeframe of Bank, we can see that Bank had a good descending channel, which with the recent drop reacted to the midline of the channel and then moved towards the top of the channel, and with a strong 4-hour whale candle, it stabilized above its descending channel and is now completing a pullback to its channel in multi-timeframe.
⚙️ The key RSI area is the 59 zone, which if the fluctuation passes this level, Bank can move upwards and have a trend reversal after this corrective wave.
🕯 The heavy and good increase in Bank’s volume at this bottom shows the presence of the market maker, the size of the 4-hour candle with which we broke the channel top also seems whale-like.
📊 The OTHERS.D index and we can see, this index is inside a 4-hour box, with the breakout of the top of this box which is at the 7.9% area, good money enters Bank. The midline of this box is at the 7.74% area, which if lost, our analysis can fail.
🔔 The areas we considered as alarm zones are the midline area and the top area. As long as we are above the midline area, we can open our position with low risk and a big stop, which is almost high-risk. The alarm zone 0.00002357 can be a more reliable area for breakout and taking trades. Keep in mind that the market conditions seem risky and the market is in decision-making mode.
❤️ Disclaimer : This analysis is purely based on my personal opinion and I only trade if the stated triggers are activated .

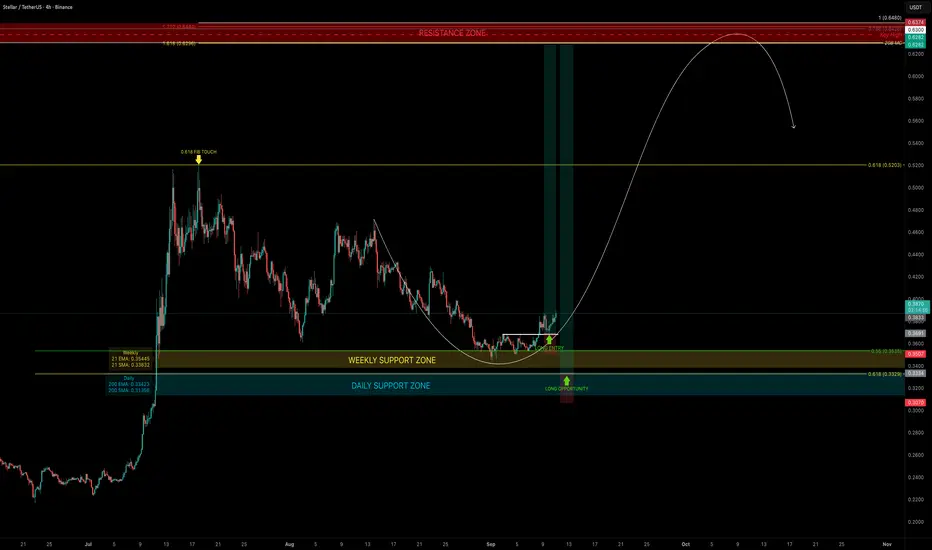
XLM — Correction Ending, Rally Loading?XLM recently found support at the 0.55 Fib retracement, in confluence with the 21 EMA/SMA on the weekly timeframe, triggering a bounce. The ideal 0.618 long entry unfortunately did not come into play.
Support Confluence
21 EMA (weekly): $0.3536
21 SMA (weekly): $0.3384
200 EMA (daily): $0.33425
200 SMA (daily): $0.3136
This cluster around $0.35–$0.31 forms a strong dynamic support zone and a great range for DCA laddering.
Resistance Confluence (Take Profit Zone $0.63–$0.65)
20B Market Cap Resistance: ~$0.63
Key High (Buy-Side Liquidity): $0.6374
0.786 Fib retracement: $0.6426
1.0 Trend-Based Fib Extension: $0.648
1.618 Fib Extension: $0.6296
Together, these create a stacked resistance cluster between $0.63–$0.65 → ideal take-profit zone and potential short setup.
🟢 Trade Plan
Best Entry: Laddering (DCA) from current levels down toward $0.31
Stop-Loss: Flexible depending on DCA strategy, clear invalidation below $0.31
Target (TP Zone): $0.63–$0.65
Technical Insight
The bounce from the 0.55 Fib retracement + weekly 21 EMA/SMA shows bulls defending this zone.
With strong dynamic support below and a stacked resistance confluence cluster at $0.63–$0.65, XLM may be setting up for a 70%+ rally.
DCA remains the best approach, as laddering down toward $0.31 allows flexible positioning.
Key Levels to Watch
Support: $0.35–$0.31 (EMA/SMA cluster, DCA zone)
Resistance / TP: $0.63–$0.65 (Fib, extensions, market cap confluence)
🔍 Indicators used
Multi Timeframe 8x MA Support Resistance Zones → to identify support and resistance zones such as the weekly 21 EMA/SMA.
➡️ Available for free. You can find it on my profile under “Scripts” and apply it directly to your charts for extra confluence when planning your trades.
_________________________________
💬 If you found this helpful, drop a like and comment!
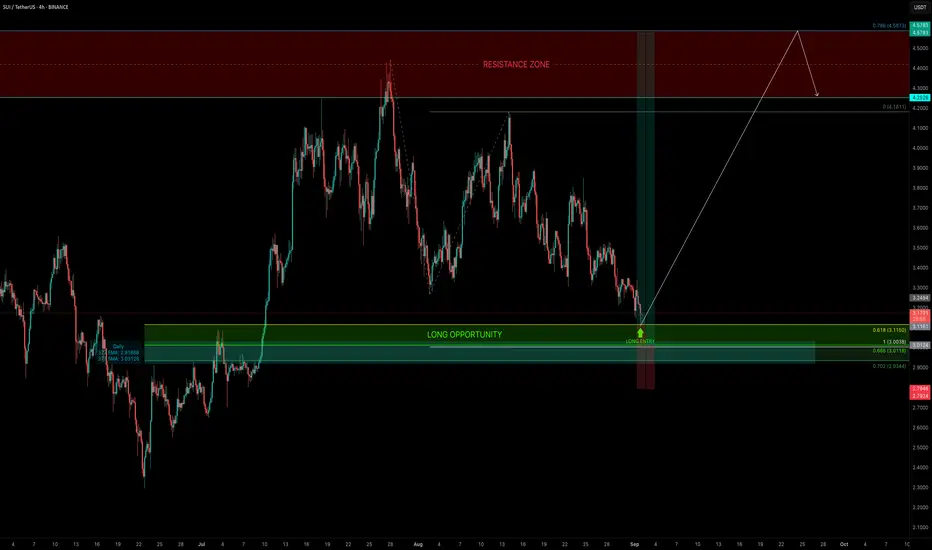
SUI — The $3 Confluence ZoneFor almost 2 months, SUI has been trading sideways in a range between $4 and $3. Today, price tapped the 0.618 Fib retracement ($3.115) of the entire move and bounced, giving a clean long trigger.
Looking ahead, the 1.0 trend-based Fib extension sits at $3.00 → a psychological key level in confluence with the 0.666 Fib retracement, making it the ideal long entry if price sees another drop.
🧩 Confluence Support Zone
0.618–0.702 Fib retracement → primary long entry range
Trend-based Fib extension 1.0: $3.00
0.666 Fib retracement: overlapping $3.00
377 EMA (daily): $2.919
377 SMA (daily): $3.03
🟢 Long Trade Setup
Entry Zone: $3.115 (0.618) → down to $3.00 (extension + retracement confluence)
Best Entry: Around $3.00
Stop-Loss: Below $2.80 (beneath 377 EMA support)
Target: Range highs
Potential Move: +50%
R:R: 1:5+
🔍 Indicators used
Multi Timeframe 8x MA Support Resistance Zones → to identify support and resistance zones such as the weekly 21 EMA/SMA.
➡️ Available for free. You can find it on my profile under “Scripts” and apply it directly to your charts for extra confluence when planning your trades.
_________________________________
💬 If you found this helpful, drop a like and comment!
How to Use - "Volatility Squeeze (NR4/NR7) in Action"Overview
The NR4/NR7 V olatility Squeeze & Breakouts indicator highlights narrow range bars (the tightest candles in the last 4 or 7 bars).
These patterns often signal price contraction before an expansion move.
Performance Snapshot from the Chart
• Multiple NR4/NR7 labels appeared during sideways phases, correctly highlighting compression zones.
• Breakouts above/below the marked levels often triggered short directional bursts.
• The final cluster near the right edge (orange NR bar) preceded a sharp downside breakout, confirmed by both price and volume.
• The 20-period SMA acted as a bias filter:
• Breakouts below the SMA during the downtrend aligned with stronger moves.
• Breakouts against the SMA were generally weaker or faded quickly.
Key Observations
1. Clustering of NR Bars:
• When NR4/NR7 patterns cluster together, it often signals that a bigger move is loading.
2. Breakout Triggers:
• The High/Low of the NR bar served as clean breakout reference levels.
3. Volume Confirmation:
• Strong moves (especially the last breakdown) came with spikes in volume, adding conviction.
How Traders Can Use This
• Identify Volatility Contraction : Spot NR4/NR7 bars as potential setups.
• Set Levels: Use NR High/Low for breakout triggers.
• Add Filters : Combine with trend (SMA), volume, or support/resistance for stronger conviction.
• Risk Management : Opposite side of the NR bar can serve as a logical stop level.
$TDUP - Bullish Before Earnings TodayNASDAQ:TDUP was a pick from my August 3rd, 2025 newsletter, along with NYSE:HWM , NYSE:RBC , and $AMSC. These picks all have the following in common:
Performance 10Y > Performance 5Y - No long term dips in performance
Performance 5Y > Performance 1Y - No short term dips in performance
SMA(300) < Price - Price above moving average
SMA(200) < Price - Price above moving average
Avg Volume 10D > 100K - No lightly traded stocks. Liquidity needed
SMA(200) >= SMA(300) - Stacked long-term simple moving averages
SMA(50 >= SMA(200) - Stacked mid-term simple moving averages
ROE, Trailing 12 Months > 0% - Improving ROE (Return on Equity)
PE increasing quarter-over-quarter
NASDAQ:TDUP has an earnings event after hours on Monday, August 4th - today. On a fundamental note, earlier this year they exited the European market and have gotten a big growth benefit from some of the AI tools, like Style Chat, that they’ve introduced to their ecommerce platform.
With their entire focus being redirected to the US market, and their numbers showing the benefits of this new focus, they have a fighting chance to be a solid pick for the next few years.
EPS and ROE have gained in the last quarter, but there is some overhead resistance right now based on the free TradingView Indicator Magic Order Blocks .
Oh, and they’ve been winning a lot of awards and recognition on the technology front, including a nod for their Chief Product and Technology Officer, Dan DeMeyer, being named a 2024 Vanguard at the beginning of the year, by Modern Retail.
My analysis shows that there is an expected 23% move because of the earnings events based on implied volatility. But the IV is so large, the movement over the last few trading days might take the wind out of the sails of today's announcement. Unless, of course, there's a miss. In which case, bulls might get smashed.
This is a slightly riskier play, considering the IV going into earnings, but could be a big winner if NASDAQ:TDUP stays on their current trajectory.
Or, I could be wrong. 😕🤔

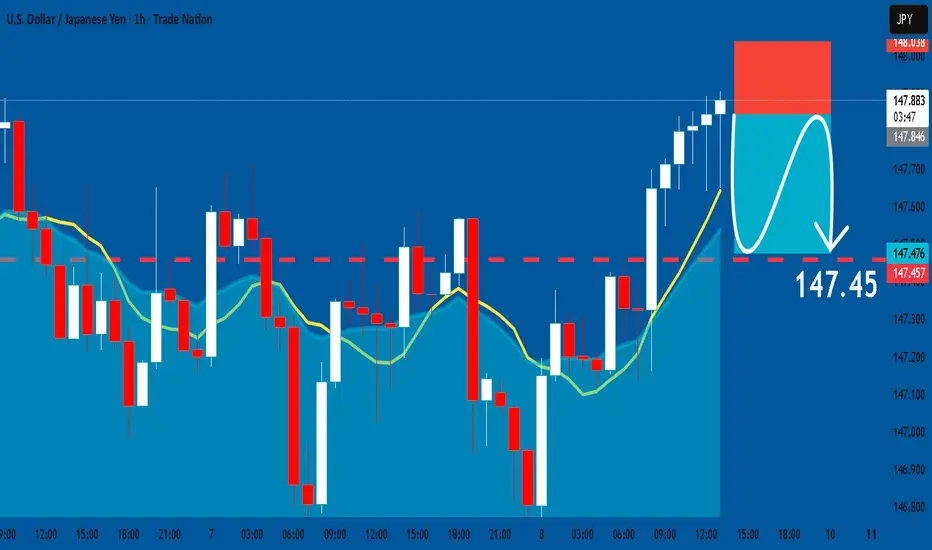
USDJPY: Short Trading Opportunity
USDJPY
- Classic bearish setup
- Our team expects bearish continuation
SUGGESTED TRADE:
Swing Trade
Short USDJPY
Entry Point - 147.84
Stop Loss - 148.03
Take Profit - 147.45
Our Risk - 1%
Start protection of your profits from lower levels
Disclosure: I am part of Trade Nation's Influencer program and receive a monthly fee for using their TradingView charts in my analysis.
❤️ Please, support our work with like & comment! ❤️