NIO — The Spark Before the Storm $10000⚡ NIO: The Spark Before the Storm — A New SuperCycle Is Born ⚡🚗
"The storm that started with Tesla is about to find its next wave."
NIO just finished its deep correction of Wave 2 — and Wave 3 is ready to change everything. 🔥
🌩️ The Setup
From hype to despair — that’s how every SuperCycle begins.
After the 2021 peak, NIO collapsed into silence, grinding through a brutal 0.618 Fibonacci retrace.
But markets don’t die in fear — they reset .
And that reset is complete.
Now, the chart shows what could be the first true SuperCycle ignition for NIO — the same point Tesla stood at a decade ago.
🌊 The Wave Map
1️⃣ Wave 1 (2019–2021) — The hype wave. EV mania, hope, and early adoption.
2️⃣ Wave 2 (2021–2025) — The cleansing wave. Fear, dilution, exhaustion.
3️⃣ Wave 3 (2025–2029) — The expansion wave.
🔥 Projected zone: $450 (1.618)
4️⃣ Wave 4 (2030–2032) — The reset.
5️⃣ Wave 5 (2032–2035) — The final mania.
Every great company survives Wave 2… and dominates in Wave 3.
🧭 The Technical Pulse
Major liquidity sweep below $8 → Smart Money re-entry.
Break of Structure (BoS) confirmation above $10 = start of markup phase.
Fair Value Gap (FVG) near $6–9 = accumulation zone.
Fib geometry + historical rhythm = 3rd wave setup confirmed.
Price is coiling under long-term resistance — the spring before expansion.
⚙️ Macro + Fundamentals
EV market entering mass production maturity.
NIO’s battery swap network gives it an unmatched recurring model.
China’s stimulus & EV subsidies may reignite the sector.
Market cap reset = asymmetric opportunity.
This is where long-term conviction separates traders from investors.
🎯 Projection Timeline
📍 Wave 3 → ~$450
🔄 Wave 4 → $100–150 zone
🚀 Wave 5 → $10,000+
💬 Final Take
⚡ NIO’s not dead — it’s recharging.
When Wave 3 hits, disbelief turns to euphoria.
👇 Drop your take — is this the next EV breakout SuperCycle ?
Follow for deep Elliott + Smart Money confluence setups.
#NIO #EVRevolution #Wave3 #ElliottWave #SmartMoneyConcept #FIBCOS #Fibonacci #MarketStructure #TradingView #StockMarket #MacroCycle #Investing #WaveTheory #ElectricVehicles
Smartmoney

CHF-JPY Will Keep Growing! Buy!
Hello,Traders!
CHFJPY retraced into a horizontal demand area after a clear bullish leg. SMC structure suggests continuation toward the supply area as liquidity above equal highs gets targeted. Time Frame 4H.
Buy!
Comment and subscribe to help us grow!
Check out other forecasts below too!
Disclosure: I am part of Trade Nation's Influencer program and receive a monthly fee for using their TradingView charts in my analysis.

USDCAD FREE SIGNAL|LONG|
✅USDCAD after tapping into the refined 4H demand level, price shows a bullish rejection candle, suggesting a potential long setup targeting the next short-term high. Smart money likely accumulating below liquidity pools.
—————————
Entry: 1.3944
Stop Loss: 1.3931
Take Profit: 1.3958
Time Frame: 4H
Setup Risk: High
—————————
LONG🚀
✅Like and subscribe to never miss a new idea!✅

FTSE 100 (UKX) | Targeting 17K → 23K → 50K The British Bull Awakens 🏴📈 | The British Bull Awakens 🏴📈 | The British Bull Awakens 🏴📈
Macro Wave 3 of SuperCycle 3 in full motion — 17K next, then 23K before Wave 4 reset and grand finale 50K .
The FTSE 100 is mid-way through its most powerful Elliott Wave phase in decades — Macro Wave (3) of SuperCycle (3).
A generational breakout is forming, with Fibonacci confluence and institutional flow pointing toward 17K and beyond. ⚡
🧩 The SuperCycle Map
📈 SuperCycle Wave (1) (1989–2000) → Globalization & tech boom = foundation of modern bull market.
📉 SuperCycle Wave (2) (2000–2009) → Dot-com + GFC reset the system with a 0.618 retrace.
⚡ SuperCycle Wave (3) (2009–Present) → Now in progress — a generational expansion wave unfolding.
Inside it:
Macro (1): 2009–2018 post-crisis recovery
Macro (2): 2018–2020 correction
Macro (3): 2020–Now → Targeting ~17,000
Macro (4): 2029–2033 est. → Retrace to 10–12K
Macro (5): 2033–2037 est. → Push to ~23,000
Then:
🌀 SuperCycle (4) = multi-year correction
🌟 SuperCycle (5) = grand finale toward ~50,000
💹 Wave Confluence & Fibonacci Geometry
2.618 extension → 17K (Macro 3 target)
3.618 extension → 23K (Macro 5 projection)
Historic 0.5–0.618 retraces at every cycle confirm proportional balance.
Long-term regression & wave symmetry both support this structure.
🧭 Smart Money & Market Structure
✅ Accumulation base: 7K–9K (institutional demand zones)
✅ Break of Structure (BoS) → confirmed expansion
✅ Fair Value Gaps below 9K → future liquidity magnets for Macro 4
✅ Continuous higher highs & order block footprints = Smart Money in control
📊 The FTSE remains in expansion phase , pushing through new structural highs as liquidity builds.
🌍 Macro Fundamentals
UK equities undervalued vs. global peers
Normalizing rates + disinflation = valuation tailwinds
Long-term flows into energy, AI, infrastructure
Institutional rotation into real assets supports the multi-decade rally
🎯 Targets Ahead
📍 Macro 3 (short-term): ~17,000
🔄 Macro 4 retrace: ~10–12K
🚀 Macro 5: ~23,000
🌀 SuperCycle 4 correction: multi-year base
🌟 SuperCycle 5: ~50,000
📈 This is the belief phase of a generational bull market — Macro Wave (3) within SuperCycle (3).
Patience now could pay off for decades.
💬 What’s your FTSE target — 17K, 23K, or 50K?
👇 Comment below and Follow for future wave updates & Smart Money confluence setups.
— Team FIBCOS
#FTSE100 #ElliottWave #SmartMoneyConcept #Fibonacci #WaveTheory #MarketStructure #MacroInvesting #TradingView #FIBCOS #BullMarket #Wave3 #PriceAction #UKX #Investing #MacroCycle

EUR-USD Clear Rejection! Buy!
Hello, Traders!
EURUSD After a deep rejection from the horizontal demand area, price shows bullish intent with a clean break of short-term structure. Expect continuation toward the target zone. Time Frame 4H.
Buy!
Comment and subscribe to help us grow!
Check out other forecasts below too!
Disclosure: I am part of Trade Nation's Influencer program and receive a monthly fee for using their TradingView charts in my analysis.

GBPJPY: Bullish Continuation
The price of GBPJPY will most likely increase soon enough, due to the demand beginning to exceed supply which we can see by looking at the chart of the pair.
Disclosure: I am part of Trade Nation's Influencer program and receive a monthly fee for using their TradingView charts in my analysis.
❤️ Please, support our work with like & comment! ❤️

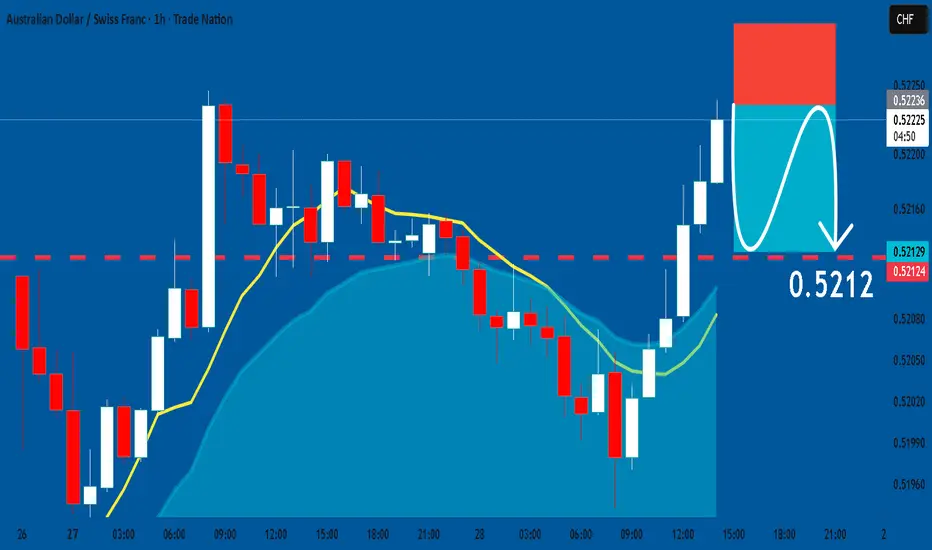
AUDCHF: Short Signal Explained
AUDCHF
- Classic bearish formation
- Our team expects fall
SUGGESTED TRADE:
Swing Trade
Sell AUDCHF
Entry Level - 0.5223
Sl - 0.5229
Tp - 0.5212
Our Risk - 1%
Start protection of your profits from lower levels
Disclosure: I am part of Trade Nation's Influencer program and receive a monthly fee for using their TradingView charts in my analysis.
❤️ Please, support our work with like & comment! ❤️
"AEX to 20,000* — The Wave 3–5 Supercycle Has Only Just Begun"🌊 AEX – The Blueprint of a Generational Bull Market 🚀
Smart Money, Fibonacci, and Fundamentals all point to a generational bull run — are you positioned for the Wave 3 expansion? 💎📈
🌀 Wave 1 (1994–2000): Birth of Optimism
💡 Fundamentals:
Tech innovation + globalization boom 🌍
Credit expansion & strong GDP growth 📈
🔢 Fibonacci: Initial impulsive leg, setting the 0–1 base for future retracements.
📊 Smart Money: Institutions accumulate early; public participation rises late.
⚙️ Price Action: Clear higher highs (HH) and higher lows (HL) confirm the new bullish structure.
🌧️ Wave 2 (2000–2009): Deep Correction & Accumulation Phase
💡 Fundamentals : Dot-com collapse, global deleveraging, QE introduction 🏦
🔢 Fibonacci: Price retraced 78.6% of Wave 1 — deep enough to reset sentiment but still respecting structure.
🧠 Smart Money: Classic accumulation — liquidity sweeps below prior lows; institutions quietly reload while retail exits.
📉 Price Action: Long accumulation base, range-bound market; demand zones forming.
⚡ Wave 3 (2020s–2030): Institutional Expansion Phase
💡 Fundamentals:
AI, automation, and digital transformation 🤖
Green capital flows + fiscal expansion 🌱
Rising European corporate profitability
🔢 Fibonacci Extension: 2.618x of Wave 1 (~5600) = ideal target for Wave 3 climax.
🧠 Smart Money: Expansion leg — institutions push liquidity upward, generating FOMO.
📈 Price Action:
Break & retest of key resistance (~1,000)
Bullish order blocks hold
Higher timeframe structure confirms macro impulse
This is the “wealth creation” wave — power, volume, and velocity align. ⚡
🌊 Wave 4 (2030–2038): The Great Reset Phase
💡 Fundamentals:
Tightening cycle, inflation plateau, slower growth 📉
Rotation between sectors; global rebalancing 🏭
🔢 Fibonacci Retracement: Likely 38.2%–50% pullback of Wave 3 — shallow compared to Wave 2.
🧠 Smart Money: Distribution > Re-accumulation — liquidity engineered via W–X–Y correction.
📉 Price Action: Choppy market; liquidity hunts below supports before reversal.
🚀 Wave 5 (2038–2050+): Euphoria & Singularity
💡 Fundamentals:
Tech maturity → productivity surge ⚙️
Global capital inflows & speculative mania 📱
Retail dominance, institutional distribution 📊
🔢 Fibonacci Extension: 3.618x (~20,000) aligns with parabolic blow-off top.
🧠 Smart Money: Final markup → engineered exit.
📈 Price Action: Steep parabolic structure; divergence signals top.
📊 Overall Market Structure & Smart Money Flow
✅ Higher timeframe structure → bullish continuation since 2009
✅ Liquidity grab → accumulation → expansion → distribution → re-accumulation
✅ Fib extensions + price action align with macro liquidity cycles
💬 The Cycle in a Sentence:
“Wave 3 builds fortunes 💰. Wave 4 tests conviction 💎. Wave 5 crowns legends 👑.”
📢 :
🔥 If you see this macro Wave 3 expansion forming before our eyes —
➡️ Smash that 👍
➡️ Drop your AEX target below 👇
➡️ Follow for weekly Elliott Wave + Smart Money insights 📊
— Team FIBCOS
#AEX #ElliottWave #SmartMoney #Fibonacci #MarketCycle #PriceAction #EuropeanMarkets #Investing #MacroAnalysis #TechnicalAnalysis #WaveTheory #Stocks #TradingViewCommunity #BullMarket #AIRevolution #LongTermInvesting #Fundamentals #ElliottWaveAnalysis #Liquidity #InstitutionalOrderFlow

USDCHF: Growth & Bullish Continuation
Our strategy, polished by years of trial and error has helped us identify what seems to be a great trading opportunity and we are here to share it with you as the time is ripe for us to buy USDCHF.
Disclosure: I am part of Trade Nation's Influencer program and receive a monthly fee for using their TradingView charts in my analysis.
❤️ Please, support our work with like & comment! ❤️

Possible Short Position on GJ we might see a sell off but we still need confirmation so we wait and see how price reacts from that POI

GOLD: Long Signal with Entry/SL/TP
GOLD
- Classic bullish setup
- Our team expects bullish continuation
SUGGESTED TRADE:
Swing Trade
Long GOLD
Entry Point - 3901.6
Stop Loss - 3884.4
Take Profit - 3938.6
Our Risk - 1%
Start protection of your profits from lower levels
Disclosure: I am part of Trade Nation's Influencer program and receive a monthly fee for using their TradingView charts in my analysis.
❤️ Please, support our work with like & comment! ❤️

"Smart Money Alert | RTS Index Could Hit 40,000+"🚀 The next big wave isn’t coming — it’s already forming.
RTSI – The Birth of a New Macro Wave! 🌊
The RTS Index (RTSI) appears to have completed a multi-decade Elliott Wave cycle correction — setting the stage for a massive Wave 5 expansion.
📉 Wave Breakdown:
🌊 Wave 1: The early post-1998 surge — the birth of a new trend and Smart Money accumulation.
⚡ Wave 2: The healthy pullback that shook out weak hands while keeping higher lows intact.
🔥 Wave 3: The impulsive macro rally into the 2008 highs — peak euphoria and full market participation.
🌀 Wave 4: The long, drawn-out correction since 2008 — complex, choppy, and filled with liquidity sweeps.
🎯 Now, with price resting perfectly in the Golden Pocket (0.618–0.65 Fib zone) and showing accumulation footprints, Wave 5 could be ready to ignite.
📊 Confluence & Market Structure
✅ Wave 4 complete in Fibonacci support zone
✅ Liquidity grab beneath major structure lows
✅ Smart Money reaccumulation evident
✅ Structure shifting from range → markup
📈 Wave 5 Projection:
The 2.618 Fibonacci extension aligns with a macro target near 40,000+ — a potential generational move if confirmed ⚡
💼 Fundamental Context:
Despite geopolitical pressure, Russian equities remain deeply undervalued relative to global peers 📉
Commodity resilience + improving liquidity = the perfect backdrop for a bullish macro rotation ⚙️
If this count holds true, RTSI may be entering its Wave 5 super-cycle — where disbelief turns into momentum and patience turns into payoff 🌠
💬 Trader & Analysts!
Do you see the same wave count? Drop your analysis below! 👇
💎 Like if you believe Wave 5 is already loading… 🚀 — Team FIBCOS
#RTSI #ElliottWave #WaveTheory #SmartMoneyConcepts #Fibonacci #TechnicalAnalysis #MarketStructure #PriceAction #Wave5 #MacroCycle #GoldenPocket #BullishSetup #FibConfluence #SmartMoney #TradingView #WaveAnalysis

GER40 Review October 28 2025Short-term price movement ideas.
The price has reached the daily zone of interest and performed a liquidity sweep there, which triggered a bearish move and created conditions for its further continuation.
At the moment, we have a 1H short order flow. If the price confirms the last 1H break-to-sell (BtS), we can then consider opening a position aiming for a continuation toward the 4H low.
Be flexible, adapt to the market, and the results will come quickly. Good luck to everyone.

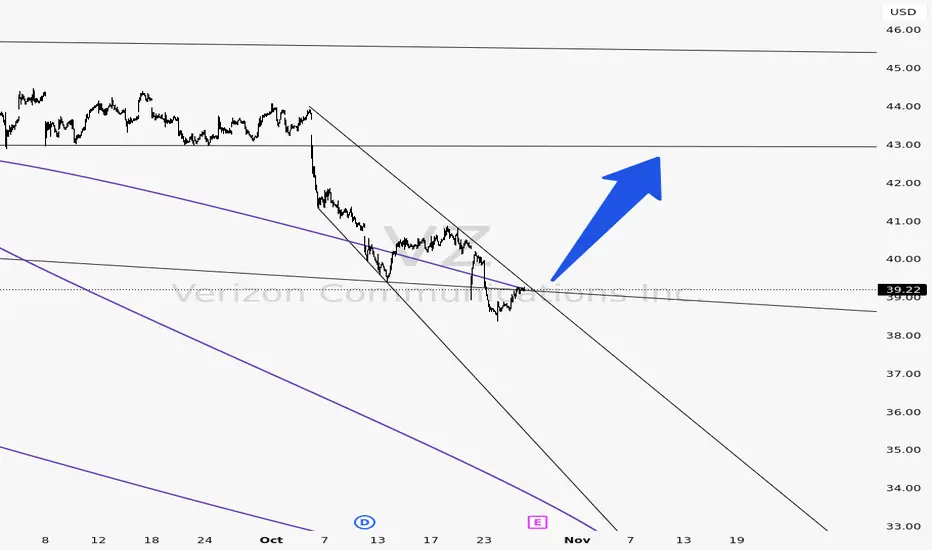
Verizon (VZ) — Bullish Reversal Setup! Smart Money Loading UpNYSE:VZ is showing early signs of a **trend reversal** after a long downtrend. The price is now testing the **upper boundary of its descending channel**, signaling potential breakout momentum.
Technicals suggest that **smart money might be accumulating** before a larger move toward the $45 range.
💎 The structure looks strong — a clean breakout and retest could confirm a new bullish leg.
Watch for volume confirmation and hold above resistance for a possible **momentum breakout**.
“They laughed when NYSE:VZ dipped. They won’t laugh when it rips.” - twitter (WallStMessiah)
👇 Drop your thoughts below — breakout or fakeout?
CRUDE OIL Potential Short! Sell!
Hello, Traders!
CRUDE OIL Price is reacting to a clear Horizontal Supply Area after liquidity sweep above the recent swing high. Smart money positioning suggests a short-term redistribution phase as sell-side liquidity below $61 becomes the draw.Time Frame 4H.
Sell!
Comment and subscribe to help us grow!
Check out other forecasts below too!
Disclosure: I am part of Trade Nation's Influencer program and receive a monthly fee for using their TradingView charts in my analysis.

BITCOIN CLEAR REJECTION|SHORT|
✅BTCUSD made a liquidity grab above the previous high, price sharply rejected from the 4H supply area, confirming a fakeout and shift in order flow. The market structure suggests redistribution, with inefficiency below acting as the draw on liquidity. Expect short-term delivery toward $114,000. Time Frame 4H.
SHORT🔥
✅Like and subscribe to never miss a new idea!✅

From Fallen Giant to Trillion-Dollar Titan — "BlackBerry"From fallen giant to future trillion-dollar titan.
The world forgot BlackBerry… but smart money didn’t. 👀📈
Once the undisputed king of smartphones, BlackBerry (BB) collapsed under the weight of innovation it helped create. But while the world moved on, BlackBerry quietly evolved — transforming from a phone maker into a global cybersecurity, AI, and IoT powerhouse .
Now, the charts and fundamentals whisper the same story: the comeback may already be in motion. 📈🔥
🧠 The New BlackBerry: The Silent Infrastructure of the Digital Age
🔒 Cybersecurity Backbone:
BlackBerry’ s Cylance AI secures over 250M+ endpoints worldwide — protecting enterprises, governments, and critical systems. As AI-driven cyber threats rise, BB’s advanced detection tech is becoming a necessity, not a luxury.
🚗 Automotive Intelligence (QNX):
Over 235M vehicles already run on BlackBerry QNX , trusted by automakers like BMW, Ford, Toyota, and Volkswagen. QNX isn’t just car software — it’s the operating system for the connected vehicle future . With autonomous mobility on the rise, every car is a potential BlackBerry endpoint.
☁️ IoT Expansion with AWS:
Through BlackBerry IVY , co-developed with Amazon Web Services, BB is redefining how vehicles and smart devices share data securely. As the world connects billions of devices, BB could become the security standard behind the Internet of Everything. 🌐
⚡ The Technical Confluence — Smart Money & Wave Theory Alignment
🌀 Elliott Wave 2 correction nearing completion — exhaustion where disbelief reigns.
⚡ Wave 3 ignition potential: historically the most powerful and extended wave.
💰 Smart Money footprints: liquidity sweeps, BOS, and accumulation in key zones hint at institutional accumulation.
📏 Fibonacci 0.786 retracement and 1.618–2.618 extensions align perfectly with historical reversal levels — high-conviction confluence for a generational setup.
This is the phase where patience pays and noise fades .
💎 The Macro Mirror — History Doesn’t Repeat, But It Rhymes
Every great tech story began in disbelief:
NVIDIA (NVDA) was once a $3 stock before AI made it a trillion-dollar icon.
Tesla (TSLA) was ridiculed before redefining transportation.
Palantir (PLTR) quietly built data infrastructure before Wall Street caught up.
Now BlackBerry stands at a similar inflection — undervalued, under-owned, and misunderstood .
It’s no longer about phones — it’s about owning the digital nervous system of the future .
📅 Accumulation: 2024–2028
🚀 Expansion: 2029–2044
🌕 Euphoria: 2045+
"The world once held BlackBerry in its hand. Soon, it might hold the world in its network."🌍✨
Traders!
💬 What do you think — is BlackBerry quietly preparing to shock the world again? — Team FIBCOS
#BlackBerry #ElliottWave #BB #SmartMoney #Fibonacci #IoT #Cybersecurity #AI #LongTermInvesting #TechRebirth #TradingView #ComebackStory

USOIL WILL FALL|SHORT|
✅CRUDE OIL/b] after engineering liquidity above the recent high, price reacted sharply from the 4H supply area, suggesting distribution by institutional players. With buy-side liquidity swept, the market now looks poised to rebalance inefficiency below the $61 handle. Time Frame 4H.
SHORT🔥
✅Like and subscribe to never miss a new idea!✅

GBP-NZD Will Go Down! Sell!
Hello, Traders!
GBPNZD broke the ascending trendline, confirming a structural shift to bearish order flow. Price has already mitigated the last bullish candle before the drop, creating an optimal entry zone for continuation lower. Time Frame 4H.
Sell!
Comment and subscribe to help us grow!
Check out other forecasts below too!
Disclosure: I am part of Trade Nation's Influencer program and receive a monthly fee for using their TradingView charts in my analysis.

EURAUD FREE SIGNAL|LONG|
✅EURAUD is reacting from the higher-timeframe demand area after engineering liquidity beneath recent equal lows. The impulsive bullish candle confirms a shift in market structure, signaling intent to retrace toward the inefficiency gap above 1.7780.
—————————
Entry: 1.7749
Stop Loss: 1.7724
Take Profit: 1.7780
Time Frame: 4H
—————————
LONG🚀
✅Like and subscribe to never miss a new idea!✅

EURCHF Free Signal! Buy!
Hello, Traders!
EURCHF SMC-based setup shows price respecting the horizontal demand area after internal liquidity was swept. A bullish displacement confirms a potential move toward higher liquidity above the previous swing high.
-------------------
Stop Loss: 0.9251
Take Profit: 0.9276
Entry: 0.9262
Time Frame: 2H
-------------------
Buy!
Comment and subscribe to help us grow!
Check out other forecasts below too!
Disclosure: I am part of Trade Nation's Influencer program and receive a monthly fee for using their TradingView charts in my analysis.

RELIANCE — The MONSTER WAVE 3 Isn’t Over Yet!📈 Summary:
Reliance isn’t done yet — the structure shows a powerful Wave 3 still unfolding with institutional strength behind it.
Expect a controlled Wave 4 retracement (₹800–₹500) before the next super rally — Wave 5 toward ₹10,000 (3.618%) .
📈 Elliott Wave count + SMC + Fundamentals all scream continuation!
Smart money is accumulating , not distributing — this is the calm before the storm.
🔥 Wave 3 builds wealth. Wave 5 creates history.
📊 Elliott Wave Confluence:
The stock remains within Wave 3 , unfolding with strong impulsive momentum and clean internal sub-waves.
Wave 3 is expected to mature around the 2.618 extension (~₹2,875) , but structure still supports further upside before exhaustion.
A Wave 4 correction will likely retrace toward the 0.382–0.5 Fib zone (₹800–₹500) , forming a deep yet healthy reset.
The grand finale — Wave 5 — targets the 3.618 Fibonacci extension (~₹10,000) , aligning with long-term macro growth and structural expansion. 🚀
💰 Smart Money Concept (SMC) Insight:
Institutional order flow remains bullishly displaced — no evidence of full distribution yet.
Expect Wave 4 to be the “smart money re-entry zone,” with liquidity sweeps and accumulation before the final push.
Wave 5 could trigger the euphoric phase where late retail chases and institutions start scaling out at premium valuations. 🧠💵
📈 Price Action Perspective:
Trend remains structurally bullish — higher highs and higher lows dominate.
A break above ₹1,600–₹1,700 confirms Wave 3 continuation.
Once the market consolidates into Wave 4, watch for equal lows, demand absorption, and BOS confirmations to catch early Wave 5 entries.
Wave 5 is expected to be sharp, emotional, and momentum-driven — classic of late-cycle impulsive waves. ⚙️📊
🌍 Fundamental Confluence:
Reliance’s expansion across energy, telecom, AI, green tech, and retail supports this wave count perfectly.
The next decade’s growth catalysts — digital ecosystem scale-up, Jio financial inclusion, and renewables — align with Wave 5’s “valuation explosion” narrative.
Fundamentals mirror Elliott psychology: Wave 3 = justified growth, Wave 4 = consolidation, Wave 5 = euphoria-driven expansion . 💹🌏
🔮 Expectations Ahead:
📍 Wave 3 Target: ₹2,800–₹3,000 range (2.618 fib).
⚠️ Wave 4 Retracement: ₹800–₹500 (accumulation & re-entry zone).
🚀 Wave 5 Target: ₹10,000 (3.618 extension — the ultimate cycle peak).
💎 Final Thought:
Reliance is still in the driver’s seat of its Wave 3.
Wave 4 will give patient bulls one final golden entry before Wave 5 — the ₹10,000 super cycle — rewrites market history.
Traders & Analysts
"This might be the mega move of the decade — and it’s happening right in front of us. 🔥
Reliance (RELIANCEIND) is still charging through a powerful Wave 3, and there’s plenty of air above before any major correction even begins. 🚀
Our Elliott Wave models show Wave 3 has not peaked yet — momentum, structure, and institutional flow all confirm that the current rally could still extend toward the ₹2,800–₹3,000 zone before any Wave 4 cooldown.
But here’s the big picture: after Wave 4’s healthy reset, the final Wave 5 explosion could drive prices to a massive ₹10,000 target (3.618 extension) — a potential super-cycle top years in the making. 💎
📈 Smart money isn’t exiting — it’s riding Wave 3 and preparing for the ultimate Wave 5 payoff.
Timing this phase could define your decade in trading. ⚡
So, traders — how far do you think Wave 3 can run before the big reset?
Drop your targets below 👇 and let’s see who rides this wave all the way to ₹10,000! 💰🌊”
— Team FIBCOS
#Reliance #ElliottWave #NSE #SmartMoney #PriceAction #WaveTheory #TechnicalAnalysis #TradingView #Investing #StockMarketIndia #RelianceIndustries #SwingTrading #LongTermInvesting #Wave3 #Wave5 #BullishIndia #ChartAnalysis #WealthBuilding #MarketStructure #Fibonacci #Wave4Accumulation

EURUSD: Market of Sellers
The analysis of the EURUSD chart clearly shows us that the pair is finally about to tank due to the rising pressure from the sellers.
Disclosure: I am part of Trade Nation's Influencer program and receive a monthly fee for using their TradingView charts in my analysis.
❤️ Please, support our work with like & comment! ❤️
