AUDJPY LOCAL SHORT|
✅AUDJPY swept liquidity above the supply zone and is now showing distribution signs. If bearish order flow confirms, expecting a move back into the target zone as the market reprices lower. Time Frame: 3H
SHORT🔥
✅Like and subscribe to never miss a new idea!✅
Smartmoneyconcepts

GBP-USD Bearish Breakout! Sell!
Hello,Traders!
GBPUSD has broken structure beneath the horizontal supply and is now trading below a key distribution zone. A bearish continuation is likely as liquidity from late buyers gets exposed, targeting the clean draw below current lows. Time Frame 3H.
Sell!
Comment and subscribe to help us grow!
Check out other forecasts below too!
Disclosure: I am part of Trade Nation's Influencer program and receive a monthly fee for using their TradingView charts in my analysis!

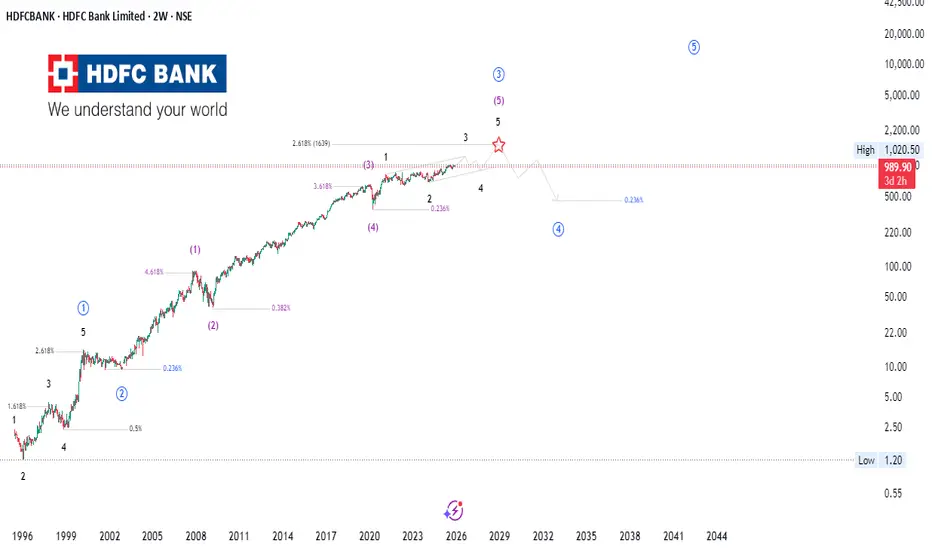
HDFC Bank | Wave-5 Exhaustion or Structural Re-Accumulation?This multi-decade chart of HDFC Bank reflects a compelling confluence of Elliott Wave Theory, Smart Money Concepts (SMC), Price Action, and Fibonacci symmetry —all signaling a maturing macro structure as the market approaches a probable Wave-5 terminal zone.
📈 Institutional Market Structure Outlook
The long-term advance appears to be unfolding within a clean 5-wave impulsive cycle , with the current structure showing:
Wave 3 projecting into the 2.618 extension zone—typical of strong institutional momentum.
A developing Wave-5 that aligns closely with prior impulse proportions, indicating possible trend exhaustion .
Clear structural higher highs and higher lows , yet momentum divergence around the projected terminal region (marked with ⭐), hinting at distribution.
🧠 Smart Money & Price Action Confluence
Price is entering a region historically associated with premium pricing —an area where Smart Money prefers to offload positions.
Multiple internal liquidity grabs near the highs suggest engineered wicks before a potential macro correction.
Market behavior resembles a buy-side liquidity sweep , followed by early signs of distribution on lower-timeframe structures.
🔢 Fibonacci Confluence & Market Cycle Alignment
Long-term impulses consistently respect 1.618 / 2.618 extension geometry.
The projected corrective leg ( Wave 4 ) aligns with the 0.236–0.382 retracement cluster, forming a probable demand re-accumulation zone.
Broader cycle rhythm hints at a transition from growth > distribution > mean reversion before Wave-5 completion.
🔮 What to Monitor Next
Reaction at the terminal Wave-5 zone
Breakdown of internal structure (SMC CHoCH/ BOS)
Volume profile shifts indicating institutional distribution
Retracement into the 0.236–0.382 macro demand zone for long-term opportunities
🚀 Stay Ahead of the Curve
For more institutional-grade analysis, follow our TradingView profile and turn on alerts 🔔 to never miss actionable insights on market structure, macro waves, and smart-money footprints.
⚠️ Disclaimer
This is not financial advice . The analysis is for educational purposes only. Markets are unpredictable—always conduct your own research before taking positions.
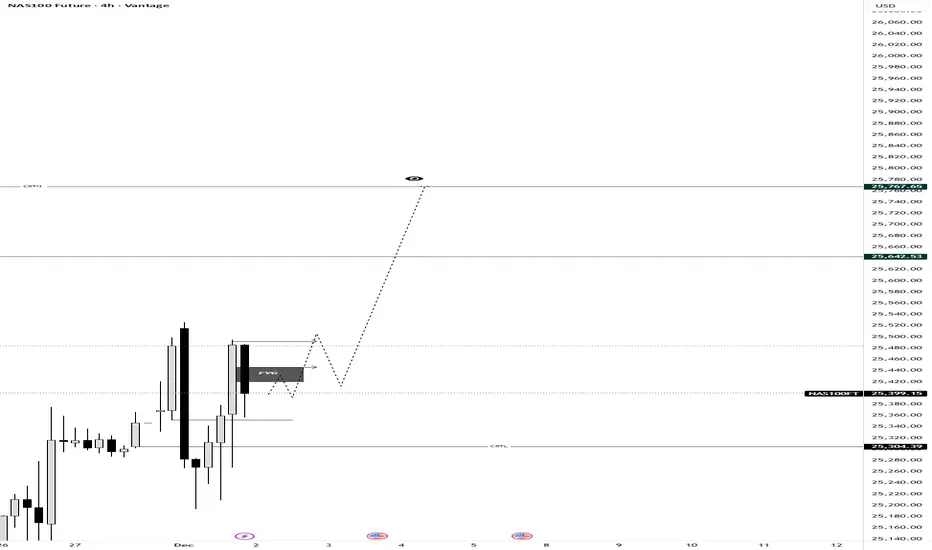
NAS100 Decoded: The Anatomy of a CRT SetupMost traders see random candles; we see a structured story. On this 4H NAS100 chart, we are witnessing a textbook example of Candle Range Theory (CRT) in motion.
If you understand the "Three-Phase Engine" inside every candle, the next move becomes clear.
The 3-Step Logic Behind This Setup:
The Purge (Accumulation): Notice how price dipped to sweep the CRTL (Candle Range Theory Low). This wasn't a random breakdown; it was a Purge Phase designed to grab liquidity and trap retail shorts. By sweeping the low (PL), the market collects the necessary fuel for the reversal.
The Mitigation (The Current Trap): Price has reclaimed the range and is currently mitigating within the FVG (Fair Value Gap). In CRT, this is the Mitigation Phase, where price returns to balance or "Equilibrium" (EQ) to fill imbalances before the real move begins. This phase often confuses traders, but it is simply smart money rebalancing positions.
The Expansion (The Delivery): With the internal liquidity harvested and the imbalance filled, the logic dictates a move toward the CRTH (Candle Range Theory High). This is our Expansion Phase, targeting the "Expansion Level" (EL). The "eye" icon on the chart represents the Draw on Liquidity (DOL)—the magnetic attraction pulling price toward the liquidity pools resting above the highs.
💡 The Lesson: Don't chase the red candles during the purge. Wait for the mitigation. As the theory states:
"The Purge phase creates the opportunity, the Mitigation phase provides the entry, and the Expansion phase delivers the profit".
Are you watching this FVG hold, or are you waiting for a break of structure confirmation? Let me know in the comments! 👇
Greetings,
MrYounity
USDJPY Sell SetupTechnical Context
Break of Structure → Price broke last week’s low at 155.64, extending down to 154.70, confirming bearish momentum.
Supply Zone Retest → Price is now retesting the 155.40–155.70 supply zone on the 1H chart, offering a potential short entry area.
🎯 Trade Plan 🎯
Entry : 155.50 (below supply zone, 1H)
Stop Loss : 155.72 (above supply zone, 1H)
Target : 154.95 (above demand zone, 1H)
Risk–Reward: ~3.5x
⚠️ Disclaimer ⚠️This journal entry is for educational and documentation purposes only. It does not constitute financial advice or a recommendation to trade. All trading involves risk, and past performance does not guarantee future results. Always conduct your own analysis and consult with a licensed financial professional before making trading decisions.

EURJPY FREE SIGNAL|SHORT|
✅EURJPY is tapping into a fresh mitigation block after sweeping local buy-side liquidity, aligning with the higher-timeframe displacement. A corrective pullback is expected before delivering the next move into the downside objective.
—————————
Entry: 180.506
Stop Loss: 180.650
Take Profit: 180.350
Time Frame: 30M
Risk Level: High
—————————
SHORT🔥
✅Like and subscribe to never miss a new idea!✅

US100 Free Signal! Buy!
Hello,Traders!
US100 shows price reacting inside a horizontal demand zone, with a clean liquidity sweep beneath recent lows. Structure suggests a retest of demand before expansion, aiming toward the next intraday target above.
--------------------
Stop Loss: 25,115
Take Profit: 25,601
Entry: 25,309
Time Frame: 5H
--------------------
Buy!
Comment and subscribe to help us grow!
Check out other forecasts below too!
Disclosure: I am part of Trade Nation's Influencer program and receive a monthly fee for using their TradingView charts in my analysis.

CHFJPY REBOUND AHEAD|LONG|
✅CHFJPY price is drawing back toward the demand leg, setting up a clean retest after a shallow liquidity grab beneath the wick lows. If the rejection confirms, price should expand toward the target premium zone above. Time Frame 2H.
LONG🚀
✅Like and subscribe to never miss a new idea!✅

GBP-NZD Local Rebound! Buy!
Hello,Traders!
GBPNZD shows price drawing back toward the horizontal demand, with liquidity resting below recent wicks. Market is about to retest the zone, where SMC flow favors a reactive buy toward the upside imbalance. Time Frame 3H.
Buy!
Comment and subscribe to help us grow!
Check out other forecasts below too!
Disclosure: I am part of Trade Nation's Influencer program and receive a monthly fee for using their TradingView charts in my analysis.

GBPUSD DEMAND LEVEL AHEAD|LONG|
✅GBPUSD is poised to retest the demand zone after sweeping nearby liquidity, signaling a potential draw back into the imbalance before targeting higher pricing. Time Frame 2H.
LONG🚀
✅Like and subscribe to never miss a new idea!✅

EUR-USD Bullish Bias! Buy!
Hello,Traders!
EURUSD price is approaching a major demand block, building bullish orderflow as liquidity from the downside sweep fuels a mitigation push toward the intraday target level. Time Frame 1H.
Buy!
Comment and subscribe to help us grow!
Check out other forecasts below too!
Disclosure: I am part of Trade Nation's Influencer program and receive a monthly fee for using their TradingView charts in my analysis.

Gold (XAUUSD) – Don’t Get Trapped: Sell High, Buy LowGold (XAUUSD) – Structural Outlook
Price action continues to develop within a corrective framework, forming a potential A–B–C structure following the recent impulsive advance. The market is approaching a key resistance zone aligned with the 0.786 retracement , where liquidity above the internal swing high may be targeted before a broader downside continuation toward the $3,880–$3,790 demand region. A confirmed sweep and rejection from the upper boundary would strengthen the case for the final leg of the correction, completing wave (C) before a higher-time-frame bullish continuation resumes.
⚠️ Disclaimer
This analysis is provided for educational purposes only and does not constitute financial advice. Trading financial markets involves risk, and you are solely responsible for your own investment decisions. Always conduct your own research and use proper risk management.
If you found this analysis valuable, leave a like, drop your thoughts in the comments, and follow for more structured market insights.

Zcash(ZEC/USDT) | Don’t Get Caught in the Whales’ Trap🧠 ZEC/USDT – Smart Money Trap Before the Drop?
Zcash just swept liquidity below a key short-term low 👀 — now reacting from a demand zone, but volume confirms weak bullish intent.
Expect a liquidity grab + distribution phase before price dives toward the $300–$350 range, aligning with higher-timeframe imbalance fills and unmitigated demand below.
Smart Money might be engineering one last bull trap before the real markdown begins.
📉 Watch for rejection from the $620–$650 supply zone to confirm the move!
#ZECUSDT #Zcash #CryptoAnalysis #PriceAction #SmartMoneyConcepts #LiquidityGrab #BearishSetup #CryptoTraders #TradingView #Fibonacci #SwingTrade #MarketStructureBreak #Wyckoff #SMC
💬 What’s your bias — bull trap or reversal? Drop your thoughts below 👇

EURJPY PULLBACK AHEAD|SHORT|
✅EURJPY Price is rejecting the supply zone after a sweep of highs, with a mitigation of the last bearish displacement candle pointing to bearish order flow targeting the next liquidity pocket below. Time Frame: 2H
SHORT🔥
✅Like and subscribe to never miss a new idea!✅

AUDUSD STRONG BREAKOUT|LONG|
✅ AUDUSD is breaking structure as it trades out of the demand block, signalling a continuation toward the upside liquidity pocket. With momentum shifting, the pair aims to draw toward the next clean inefficiency above before reaction. Time Frame 4H.
LONG🚀
✅Like and subscribe to never miss a new idea!✅

USD-JPY Will Grow! Buy!
Hello, Traders!
USDJPY shows price reacting around the rising trendline, with liquidity building beneath the minor swing lows. Smart Money may engineer a corrective move before a continuation toward the target level as the structure remains bullish and higher-timeframe momentum supports further expansion. Time Frame 7H.
Buy!
Comment and subscribe to help us grow!
Check out other forecasts below too!
Disclosure: I am part of Trade Nation's Influencer program and receive a monthly fee for using their TradingView charts in my analysis.

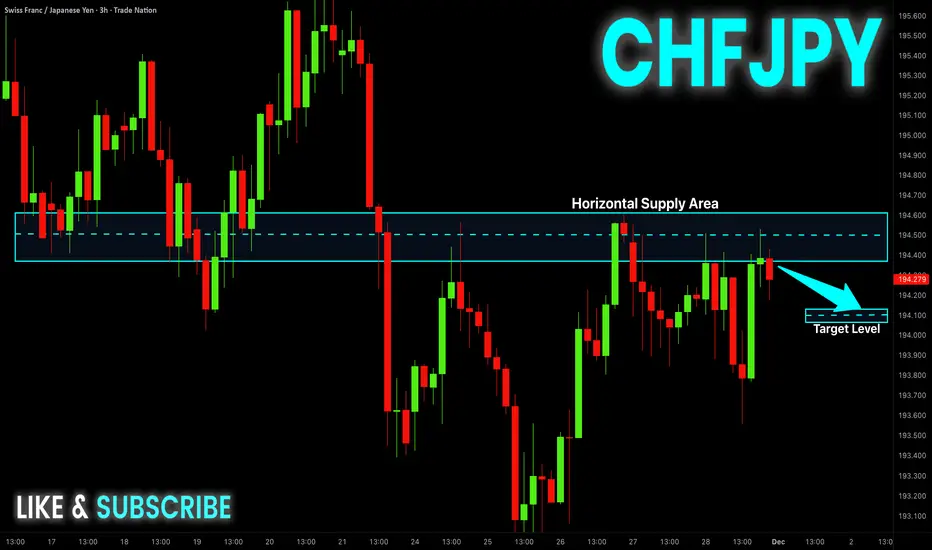
CHF-JPY Local Short! Sell!
Hello,Traders!
CHFJPY is reacting inside a major supply block after sweeping liquidity above the previous swing high. With structure shifting bearish, the pair is poised for a continuation lower toward the next downside inefficiency. Time Frame 3H.
Sell!
Comment and subscribe to help us grow!
Check out other forecasts below too!
Disclosure: I am part of Trade Nation's Influencer program and receive a monthly fee for using their TradingView charts in my analysis.
GOLD FREE SIGNAL|SHORT|
✅XAUUSD strong sweep into the supply zone triggered a premium-priced rejection, aligning with the ICT narrative shift for a short-term distribution leg targeting inefficiency below.
—————————
Entry: 4,215$
Stop Loss: 4,240$
Take Profit: 4,185$
Time Frame: 4H
—————————
SHORT🔥
✅Like and subscribe to never miss a new idea!✅

AUD-JPY Free Signal! Sell!
Hello,Traders!
AUDJPY tapped into a high-timeframe supply block and printed rejection wicks, signalling distribution after a premium sweep. With liquidity taken above the range, the setup aligns for a displacement down into the next draw-on-liquidity.
Sell!
Comment and subscribe to help us grow!
Check out other forecasts below too!
Disclosure: I am part of Trade Nation's Influencer program and receive a monthly fee for using their TradingView charts in my analysis.

AUDJPY FREE SIGNAL|SHORT|
✅AUDJPY price swept the upper supply wick and tapped into a premium zone, triggering a clean bearish displacement. A corrective pullback into the breaker block is expected before continuation lower.
———————————
Entry: 102.29
Stop Loss: 102.49
Take Profit: 102.01
Time Frame: 2H
———————————
SHORT🔥
✅Like and subscribe to never miss a new idea!✅

GBP-NZD Free Signal! Sell!
Hello, Traders!
GBPNZD has executed a clean bearish breakout beneath the horizontal supply area, shifting order-flow decisively to the downside. The recent liquidity sweep above the structure acted as distribution, and price is now delivering into discount levels with bearish momentum.
--------------------
Stop Loss: 2.3145
Take Profit: 2.3026
Entry: 2.3097
Time Frame: 2H
--------------------
Sell!
Comment and subscribe to help us grow!
Check out other forecasts below too!
Disclosure: I am part of Trade Nation's Influencer program and receive a monthly fee for using their TradingView charts in my analysis.

EUR-JPY Bearish Bias! Sell!
Hello,Traders!
EURJPY is reacting inside a major H2 supply block after sweeping short-term liquidity, signalling distribution and a probable displacement lower toward inefficiencies below. Time Frame 2H.
Sell!
Comment and subscribe to help us grow!
Check out other forecasts below too!
Disclosure: I am part of Trade Nation's Influencer program and receive a monthly fee for using their TradingView charts in my analysis.

EURNZD BEARISH BREAKOUT|SHORT|
✅EURNZD has broken down from the supply level and is now trading in a discount leg, with liquidity resting below recent equal lows. As long as order flow stays bearish, the draw remains toward the target zone. Time Frame 7H.
SHORT🔥
✅Like and subscribe to never miss a new idea!✅
