AUD-USD Bullish Breakout! Buy!
Hello,Traders!
AUDUSD broke the descending trendline after a liquidity grab beneath the recent swing low, shifting structure bullish. With demand now holding, price is likely to revisit the upside target as liquidity draws higher. Time Frame 5H.
Buy!
Comment and subscribe to help us grow!
Check out other forecasts below too!
Disclosure: I am part of Trade Nation's Influencer program and receive a monthly fee for using their TradingView charts in my analysis.
Smartmoneyconcepts

EURUSD LOCAL SHORT|
✅EURUSD reacted off the supply zone after a clear liquidity grab above the prior swing high, shifting order flow back bearish. With the draw on liquidity set below, the market is likely to seek the next inefficiency toward the target area. Time Frame 1H.
SHORT🔥
✅Like and subscribe to never miss a new idea!✅

US100 Bullish Bias! Buy!
Hello,Traders!
US100 is expanding from the demand zone after a clean mitigation and a shift in structure, with liquidity resting above the recent swing highs. Market is poised to draw toward the next premium target as inefficiencies get filled. Time Frame 5H.
Buy!
Comment and subscribe to help us grow!
Check out other forecasts below too!
Disclosure: I am part of Trade Nation's Influencer program and receive a monthly fee for using their TradingView charts in my analysis.

GOLD IS OVERBOUGHT|SHORT|
✅XAUUSD After sweeping liquidity above the supply zone, price is about to retest the rejection point in a premium area. A draw on liquidity toward the next inefficiency is favored as the market seeks a balanced repricing leg. Time Frame: 3H.
SHORT🔥
✅Like and subscribe to never miss a new idea!✅

GOLD Free Signal! Sell!
Hello,Traders!
GOLD taps a clean supply zone after an extended move, showing rejection wicks and shifting orderflow that signal potential distribution. A short-term pullback into discounted levels may unfold toward the downside target.
--------------------
Stop Loss: 4,246$
Take Profit: 4,192$
Entry Level: 4,216$
Time Frame: 2H
--------------------
Sell!
Comment and subscribe to help us grow!
Check out other forecasts below too!
Disclosure: I am part of Trade Nation's Influencer program and receive a monthly fee for using their TradingView charts in my analysis.

CHFJPY FREE SIGNAL|SHORT|
b]✅CHFJPY taps the H2 supply array and shows displacement as bearish orderflow confirms a potential reversal cascade. A corrective pullback into the imbalance is likely before delivering downside toward the target zone.
—————————
Entry: 194.40
Stop Loss: 194.63
Take Profit: 194.15
Time Frame: 2H
—————————
SHORT🔥
✅Like and subscribe to never miss a new idea!✅

EUR-NZD Free Signal! Sell!
Hello,Traders!
EURNZD Price broke through the supply zone, confirming bearish orderflow as the breakout shifts structure lower. A clean mitigation of the origin block suggests continuation toward the downside target.
--------------------
Stop Loss: 2.0286
Take Profit: 2.0159
Entry: 2.0236
Time Frame: 4H
--------------------
Sell!
Comment and subscribe to help us grow!
Check out other forecasts below too!
Disclosure: I am part of Trade Nation's Influencer program and receive a monthly fee for using their TradingView charts in my analysis.

GOLD FREE SIGNAL|LONG|
✅XAUUSD bullish displacement out of the consolidation shows price drawing toward buy-side liquidity after mitigating the prior sell-side sweep. Upside imbalance remains unfilled, pulling price toward the next target zone.
—————————
Entry: 4166$
Stop Loss: 4135$
Take Profit: 4204$
Time Frame: 4H
—————————
LONG🚀
✅Like and subscribe to never miss a new idea!✅

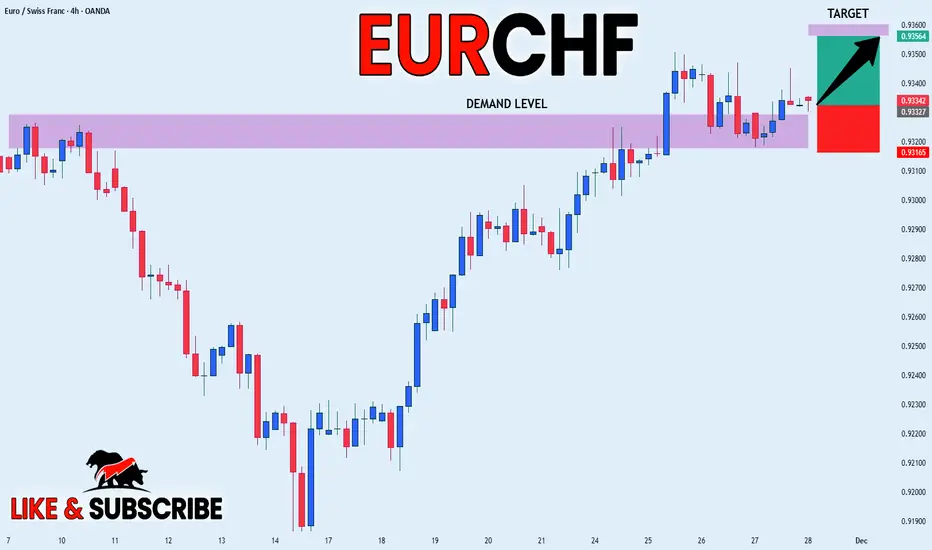
EURCHF FREE SIGNAL|LONG|
✅EURCHF is reacting from the higher-timeframe demand block after clearing sell-side liquidity and showing bullish displacement. With inefficiency above acting as a magnet, price may draw toward the next buy-side target.
—————————
Entry: 0.9332
Stop Loss: 0.9316
Take Profit: 0.9356
Time Frame: 4H
—————————
LONG🚀
✅Like and subscribe to never miss a new idea!✅
NATGAS Free Signal! Sell!
Hello,Traders!
NATGAS is reacting inside a major horizontal supply zone after sweeping local buy-side liquidity. With displacement shifting bearish, a move toward the discounted target zone below becomes likely.
--------------------
Stop Loss: 4.693$
Take Profit: 4.549$
Entry Level: 4.636$
Time Frame: 4H
--------------------
Sell!
Comment and subscribe to help us grow!
Check out other forecasts below too!
Disclosure: I am part of Trade Nation's Influencer program and receive a monthly fee for using their TradingView charts in my analysis.

USDCAD BEARISH BREAKOUT|SHORT|
✅USDCAD broke below the supply zone with clean displacement, leaving a fresh imbalance that may act as a breaker on any pullback. Expect price to draw toward sell-side liquidity resting near the lower target area. Time Frame 3H.
SHORT🔥
✅Like and subscribe to never miss a new idea!✅

AUD-USD Bullish Bias! Buy!
Hello,Traders!
AUDUSD pair reclaimed the demand zone after sweeping sell-side liquidity, shifting structure bullish. If momentum holds, price may target the premium inefficiency above as buy-side liquidity gets drawn. Time Frame 3H.
Buy!
Comment and subscribe to help us grow!
Check out other forecasts below too!
Disclosure: I am part of Trade Nation's Influencer program and receive a monthly fee for using their TradingView charts in my analysis.

EURAUD LOCAL LONG|
✅EURAUD has tapped the higher-timeframe demand after clearing sell-side liquidity, signaling a potential bullish reversal. If displacement confirms, algos may drive price toward the next buy-side liquidity target above. Time Frame 3H.
LONG🚀
✅Like and subscribe to never miss a new idea!✅

EUR-CHF Will Keep Growing! Buy!
Hello,Traders!
EURCHF is holding above the horizontal demand after a sweep of sell-side liquidity, hinting at accumulation. If bullish intent confirms, expect continuation toward the next buy-side liquidity at the target level.
Time Frame 8H.
Buy!
Comment and subscribe to help us grow!
Check out other forecasts below too!
Disclosure: I am part of Trade Nation's Influencer program and receive a monthly fee for using their TradingView charts in my analysis.

USOIL FREE SIGNAL|SHORT|
✅WTI OIL is returning into the higher-timeframe supply after clearing buy-side liquidity, signaling distribution. If rejection confirms, bearish displacement could drive price toward the sell-side liquidity target below.
—————————
Entry: 58.70$
Stop Loss: 59.00$
Take Profit: 58.12$
Time Frame: 3H
—————————
SHORT🔥
✅Like and subscribe to never miss a new idea!✅

GOLD Free Signal! Buy!
Hello,Traders!
GOLD has reacted from the horizontal demand after sweeping sell-side liquidity, suggesting early accumulation. If bullish intent holds, SMC order-flow favors a move toward the next buy-side liquidity above.
--------------------
Stop Loss: 4,134$
Take Profit: 4,202$
Entry Level: 4,161$
Time Frame: 3H
--------------------
Buy!
Comment and subscribe to help us grow!
Check out other forecasts below too!
Disclosure: I am part of Trade Nation's Influencer program and receive a monthly fee for using their TradingView charts in my analysis.

ANDNZD WILL FALL|SHORT|
✅AUDNZD has broken down from the higher-timeframe supply with strong displacement, confirming bearish order-flow. A shallow corrective retrace may form before algos drive price toward the next sell-side liquidity target below. Time Frame 3H.
SHORT🔥
✅Like and subscribe to never miss a new idea!✅

EUR-AUD Demand Level Ahead! Buy!
Hello,Traders!
EURAUD is approaching the horizontal demand after sweeping sell-side liquidity, hinting at early accumulation. If bullish intent confirms, expect a move toward the next buy-side liquidity target above. Time Frame 3H.
Buy!
Comment and subscribe to help us grow!
Check out other forecasts below too!
Disclosure: I am part of Trade Nation's Influencer program and receive a monthly fee for using their TradingView charts in my analysis.

EURNZD BEARISH BREAKOUT|SHORT|
✅EURNZD has broken down through the higher-timeframe supply with clear displacement, confirming bearish order-flow. A corrective pullback may form before algos drive price toward the next sell-side liquidity target below. Time Frame 4H.
SHORT🔥
✅Like and subscribe to never miss a new idea!✅

EUR-USD Local Short! Sell!
Hello,Traders!
EURUSD is pushing into the horizontal supply after a liquidity sweep, signaling potential distribution. If rejection confirms, expect a move toward the next sell-side liquidity at the target level. Time Frame 2H.
Sell!
Comment and subscribe to help us grow!
Check out other forecasts below too!
Disclosure: I am part of Trade Nation's Influencer program and receive a monthly fee for using their TradingView charts in my analysis.

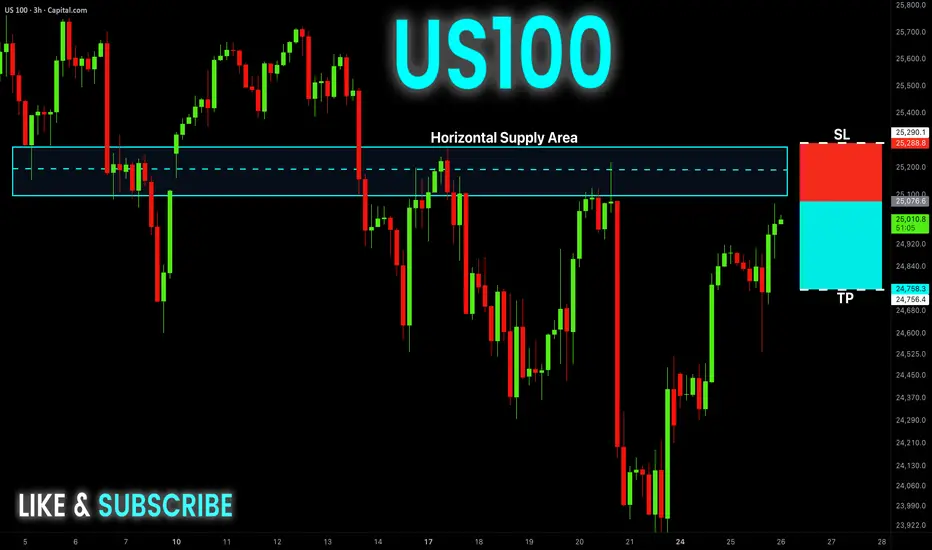
US100 Free Signal! Sell!
Hello,Traders!
US100 has swept internal liquidity and is now approaching the horizontal supply but hasn’t retested it yet. If the retest confirms distribution, SMC flow favors a drop toward the next sell-side liquidity zone.
--------------------
Stop Loss: 25,288
Take Profit: 24,756
Entry: 25,076
Time Frame: 3H
--------------------
Sell!
Comment and subscribe to help us grow!
Check out other forecasts below too!
Disclosure: I am part of Trade Nation's Influencer program and receive a monthly fee for using their TradingView charts in my analysis.
EUR-USD Strong Breakout! Buy!
Hello,Traders!
EURUSD broke above the horizontal demand after sweeping liquidity, signaling bullish expansion. A retest of the breakout zone could fuel continuation toward the next buy-side liquidity above. Time Frame 2H.
Buy!
Comment and subscribe to help us grow!
Check out other forecasts below too!
Disclosure: I am part of Trade Nation's Influencer program and receive a monthly fee for using their TradingView charts in my analysis.

AUDJPY WILL GO UP|LONG|
✅AUDJPY has returned to the mitigation block within higher-timeframe demand after clearing sell-side liquidity. If bullish displacement follows, expect the market participants to reprice toward the next buy-side liquidity target above. Time Frame 3H.
LONG🚀
✅Like and subscribe to never miss a new idea!✅
