NZD-CHF Bearish Bias! Sell!
Hello,Traders!
NZDCHF already pulled back into the horizontal supply, filling imbalance and grabbing buy-side liquidity. With distribution forming, price is expected to extend lower toward the target sell-side liquidity zone. Time Frame 2H.
Sell!
Comment and subscribe to help us grow!
Check out other forecasts below too!
Disclosure: I am part of Trade Nation's Influencer program and receive a monthly fee for using their TradingView charts in my analysis.
Smartmoneyconcepts

AUDCAD RISKY LONG|
✅AUDCAD is sliding into a clean demand zone where liquidity rests below recent lows. Expect a reaction as price taps this imbalance. Targeting a retracement toward the marked FVG before continuation. Time Frame 2H.
LONG🚀
✅Like and subscribe to never miss a new idea!✅

AUD-JPY Local Short! Sell!
Hello,Traders!
AUDJPY reacts from a premium supply zone, showing clear distribution and a shift in structure. Liquidity below remains the next draw as bearish orderflow continues. Time Frame 4H.
Sell!
Comment and subscribe to help us grow!
Check out other forecasts below too!
Disclosure: I am part of Trade Nation's Influencer program and receive a monthly fee for using their TradingView charts in my analysis.

NZDUSD WILL FALL|SHORT|
✅ NZDUSD taps a premium supply zone and shows corrective delivery. A shift in order flow suggests downside repricing toward the next draw on liquidity. Time Frame 4H.
SHORT🔥
✅Like and subscribe to never miss a new idea!✅

NZD-USD Free Signal! Sell!
Hello,Traders!
NZDUSD taps into a clean supply block after an extended upside delivery, creating potential for a distribution shift. If the rejection holds, liquidity below the recent swing becomes the draw.
--------------------
Stop Loss: 0.5692
Take Profit: 0.5665
Entry Level: 0.5680
Time Frame: 4H
--------------------
Sell!
Comment and subscribe to help us grow!
Check out other forecasts below too!
Disclosure: I am part of Trade Nation's Influencer program and receive a monthly fee for using their TradingView charts in my analysis.

US100 LOCAL SHORT|
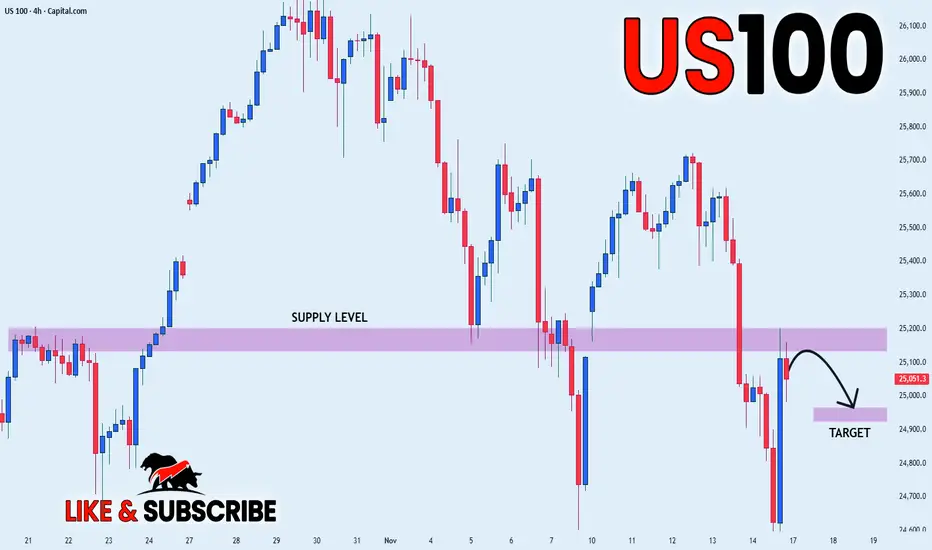
✅US100 price rejects the supply block and forms a clean displacement lower, hinting at a draw on liquidity toward the inefficiency below. A corrective retrace before targeting the marked zone is likely. Time Frame 4H.
SHORT🔥
✅Like and subscribe to never miss a new idea!✅
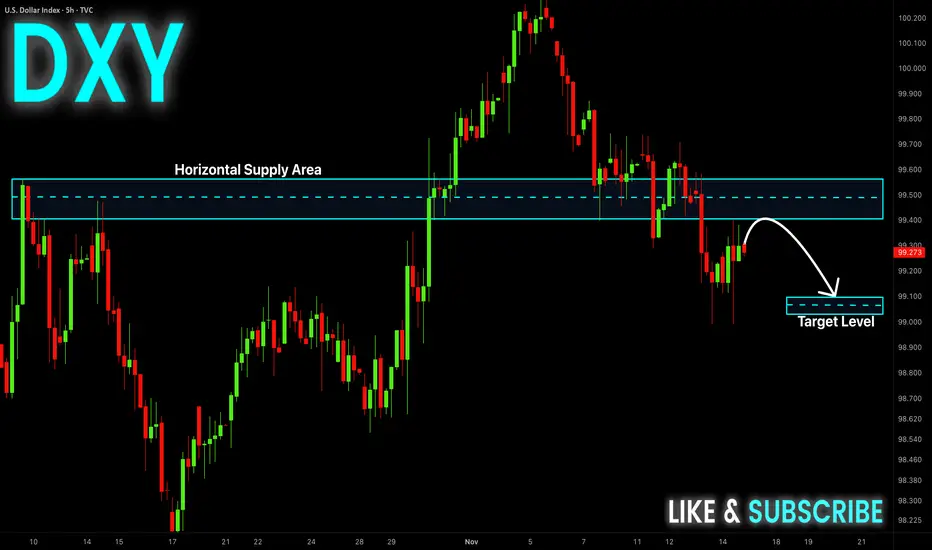
DXY Will Fall! Sell!
Hello,Traders!
DXY price taps into a clean supply block, creating a shift in order flow as liquidity above the highs gets swept. A corrective push toward the next demand pocket is likely. Time Frame 5H.
Sell!
Comment and subscribe to help us grow!
Check out other forecasts below too!
Disclosure: I am part of Trade Nation's Influencer program and receive a monthly fee for using their TradingView charts in my analysis.
GBPJPY | Institutional Sell Setup – D1 & W1 Sweeps AlignGBPJPY has completed a multi-timeframe liquidity sweep, with both W1 and D1 sweeps aligning inside a premium price zone.
The structure has shifted bearish following a clear CHOCH and a rejection from the FVG imbalance area, confirming potential downside continuation.
🔹 Execution Bias: Instant Sell
🔹 Entry Zone: 202.60–202.80
🔹 Stop-Loss: Above 203.40 (protected high)
🔹 Target: 199.00 (liquidity zone)
🔹 Bias: Bearish
Technical Breakdown:
• Weekly sweep confirms distribution.
• Daily sweep adds confluence of liquidity grab.
• CHOCH at discount confirms bearish intent.
• FVG + refined OB = smart-money entry zone.
• Targeting inefficiency and old liquidity lows.

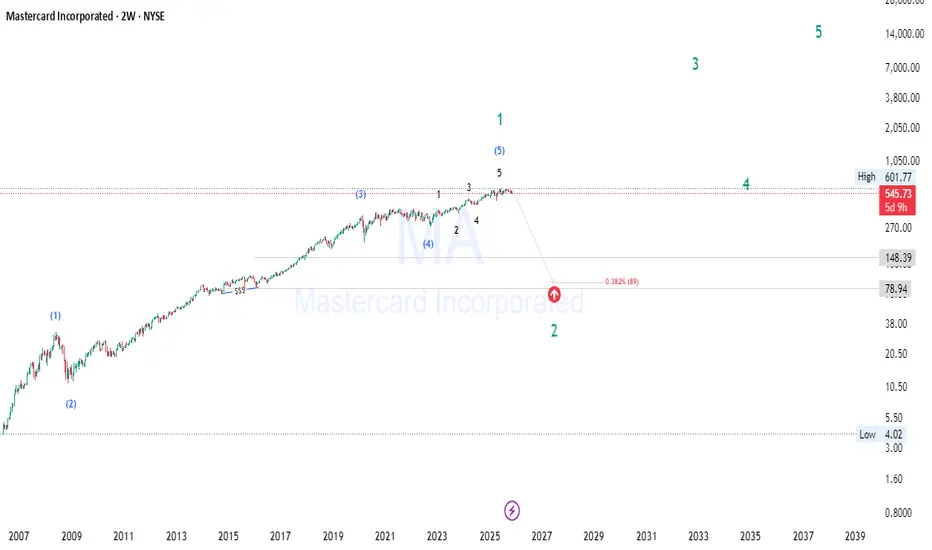
Mastercard (MA) Hits Key Cycle Top — Correction Incoming!🧠 Mastercard (MA) — In-Depth Multi-Framework Market Analysis
Mastercard’s long bull run has matured into a classic Wave 5 exhaustion.
Multiple frameworks agree: a deep corrective phase is likely ahead.
Understanding market structure, smart money moves, and Fibonacci levels can help you navigate this reset .
🌀 Wave Theory & Elliott Wave Context
Mastercard’s chart shows a clear completed 5-wave impulsive structure spanning roughly 15+ years, typical of a major secular bull cycle. The small sub-waves within Wave 5 suggest final exhaustion:
Wave 5 ending near key Fibonacci extensions signals an exhaustion climax.
After such extended waves, expect a significant corrective ABC pattern or even a complex correction resetting much of the prior gains.
The correction here is likely a large Wave 2 on the higher degree, meaning the retracement could be deep and prolonged, typically lasting multiple years.
📉 Market Structure Breakdown & Key Price Action Signals
Price has failed to push to new highs with conviction, showing lower highs and a breakdown of previous support levels.
This breakdown in market structure suggests the shift from an accumulation or markup phase to distribution and markdown.
Multiple wick rejections and volume spikes near highs imply liquidity sweeps and stop hunts by institutions, signaling transfer of risk.
Price action shows signs of fatigue — smaller candles, overlapping bars, and diminished momentum — classic exhaustion signals.
🧠 Smart Money Concepts (SMC)
Institutional players often engineer liquidity grabs above key levels (stop hunts) to shake out retail participants.
The immediate reversal following those liquidity grabs is a hallmark of distribution , where "smart money" sells into retail enthusiasm.
The absence of strong demand at these levels reinforces the notion of a shift from bullish to bearish control.
📊 Fibonacci Retracement & Extension Levels
Wave 5 terminated near the 2.618 Fibonacci extension , an extreme but well-documented exhaustion zone for extended impulses.
The retracement target aligns with the 0.382 Fibonacci retracement (~$89–95) , the first major support for Wave 2 corrections.
More conservative estimates place support near 0.5–0.618 retracement , which historically mark deep correction zones in longer cycles.
These levels also coincide with significant prior consolidation zones, increasing their validity as support.
💼 Fundamental Context & Market Cycles
Mastercard’s underlying fundamentals remain solid, with strong revenue growth and market dominance.
However, market cycles are driven by liquidity and psychology — no fundamentally strong company is immune to price corrections during macro resets.
This correction could coincide with broader economic or sector rotation phases, impacting valuation multiples and capital flows.
🔮 Strategic Outlook & Trading Implications
Expect a multi-year correction phase , potentially volatile, with several retracements and consolidations along the way.
Patience is key: major Wave 2 corrections often shake out weak holders and reset risk/reward dynamics for the next bull phase (Wave 3).
Traders should look for confluence zones combining Fibonacci support, prior market structure, and volume profile for entries.
Watch for price action confirmation of a base formation before resuming a bullish stance.
💡 Key Takeaways for Traders
Long-term cycle completion means caution: avoid chasing new highs here.
Use Fibonacci and wave structure to anticipate price targets and exits.
Monitor volume and liquidity sweeps to identify distribution phases.
Be prepared for deep, sometimes painful corrections even in high-quality stocks.
Focus on risk management and position sizing during volatile cycle resets.
Stay ahead of the market — follow for advanced wave counts, Fibonacci setups, and smart money insights.
Comment 👇 your ticker to get a personalized deep-dive analysis next! 🚀
Disclaimer:
This analysis is for educational purposes only and does not constitute financial advice. Always conduct your own research and consult a professional before trading.
#Mastercard #MA #WaveTheory #ElliottWave #SmartMoneyConcepts #SMC #Fibonacci #MarketStructure #PriceAction #TradingView #TechnicalAnalysis #StocksToWatch #MarketCycles #LiquidityHunt #TradingEducation #InvestSmart #StockAnalysis
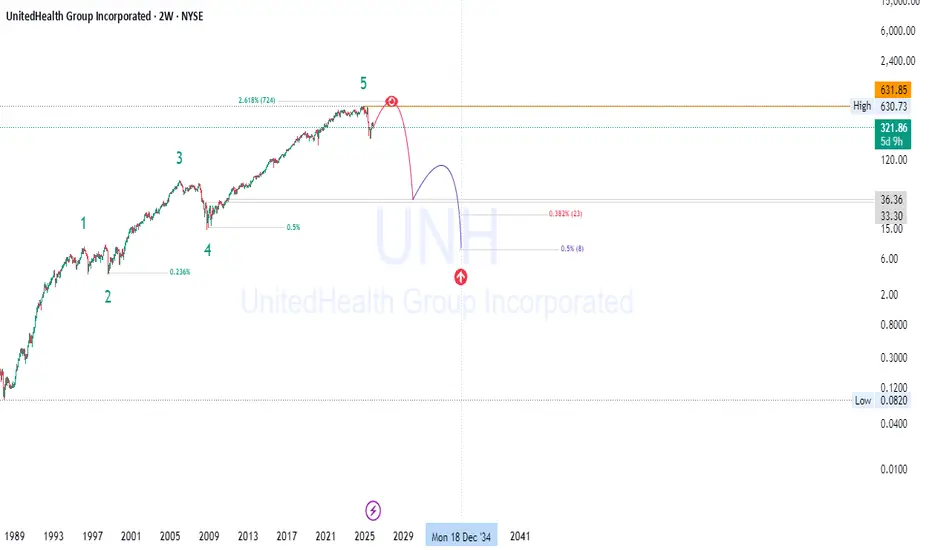
UNH Liquidity Grab Signals Cycle Reversal - Are you ready?A multi-decade bull cycle doesn’t end quietly.
UNH’s Wave 5 has reached exhaustion, and the chart is finally revealing what the next macro chapter might look like.
When price, structure, Fibonacci geometry, and smart money behavior all align — the market is speaking.
🌀 Wave Theory
UNH has completed a full 5-wave macro cycle , with Wave 5 extending unusually far. Extended fifth waves often lead to deep corrections as the trend matures.
🔍 Market Structure
For the first time in years:
higher highs stopped forming
internal structure broke
price failed to reclaim the breakdown
These are early signs of long-term reversal.
🧠 Smart Money Concepts
Institutional behavior is visible at the top:
liquidity sweeps above prior highs
distribution in premium pricing
immediate sell-offs after stop hunts
These are not accumulation behaviors.
📈 Price Action
Wicks, compression, and fading demand show exhaustion.
Large inefficiencies remain unfilled far below current price — and markets revisit these over time.
📊 Fibonacci Geometry
Wave 5 halted nearly at the 2.618 extension , a textbook termination point.
Retracement zones at 0.382–0.5 match the likely landing zone for a large ABC correction.
🔮 Takeaway
Even fundamentally strong companies undergo cycle resets.
This setup suggests UNH may be entering a multi-year corrective phase , fully consistent with long-term market cycles and technical exhaustion.
If you found this breakdown valuable, follow for more multi-timeframe analysis, wave theory insights, and institutional-level charting.
Drop your tickers in the comments 👇 — We’ll analyze the next one 📊🔥
#UNH #WaveTheory #ElliottWave #SmartMoneyConcepts #SMC #FibonacciTrading #MacroCycles
#PriceAction #MarketStructure #TradingView #TechnicalAnalysis #ChartPatterns
#LongTermInvesting #MarketCycles #Liquidity #TraderEducation #StocksAnalysis
SPY FREE SIGNAL|SHORT|
✅SPY price rejects a major supply block after running buy-side liquidity, shifting intraday flow bearish. With displacement confirming downside intent, a draw toward the discount target zone is likely.
———————————
Entry: 671.95$
Stop Loss: 675.80$
Take Profit: 667.20$
Time Frame: 2H
———————————
SHORT🔥
✅Like and subscribe to never miss a new idea!✅

NZD-CHF Free Signals! Sell!
Hello,Traders!
NZDCHF taps into a clean horizontal supply after a displacement down, creating a corrective pullback into a premium zone where liquidity sits above minor highs. 3H setup favors continuation lower.
--------------------
Stop Loss: 0.45168
Take Profit: 0.45019
Entry Level: 0.45110
Time Frame: 3H
--------------------
Sell!
Comment and subscribe to help us grow!
Check out other forecasts below too!
Disclosure: I am part of Trade Nation's Influencer program and receive a monthly fee for using their TradingView charts in my analysis.

NZD-CAD Local Long! Buy!
Hello,Traders!
NZDCAD is reacting from a demand area after collecting liquidity below the equal lows, setting up a bullish continuation into the next premium target above. Time Frame 2H.
Buy!
Comment and subscribe to help us grow!
Check out other forecasts below too!
Disclosure: I am part of Trade Nation's Influencer program and receive a monthly fee for using their TradingView charts in my analysis.

EUR-USD Will Grow! Buy!
Hello,Traders!
EURUSD price is tapping into a clean demand zone after sweeping short-term liquidity, setting the stage for a bullish displacement toward the next premium target above. Time Frame 1H.
Buy!
Comment and subscribe to help us grow!
Check out other forecasts below too!
Disclosure: I am part of Trade Nation's Influencer program and receive a monthly fee for using their TradingView charts in my analysis.

Bitcoin - Is This Where The Pain Finally Ends?Bitcoin has been grinding lower for about a month after sweeping the previous all time high, which created the shift that kicked off this broader downtrend. Since that sweep, every push up has been met with selling, and the market has slowly bled its way back into a major support zone that has been significant in earlier cycles. This is the kind of level where the market usually makes a statement, either by holding and reversing or by breaking and opening the door to a deeper move.
Support Structure and Key Reaction Point
Price is sitting inside a wide support band that has given strong reactions in the past. It is a level traders know well and one that typically slows the market down. The difference this time is the structure leading into it. The downtrend has been consistent, with a string of lower highs showing that sellers remain in control for now. How the daily candle closes inside this zone will tell us a lot about whether buyers still have enough strength to defend it or if this level finally gives way.
Recent Liquidity Events and Daily Gap Behavior
Before dropping into this support, Bitcoin ran a recent daily high and instantly filled the gap above it, making it clear that the move was more about collecting liquidity than shifting the trend. After that, price slid lower again and retested the inside of the daily imbalance, but the retest failed to spark any meaningful demand. That kind of behavior often hints at a market that is still hunting lower levels rather than building upside structure.
Bullish Scenario
For sentiment to turn, Bitcoin needs to close back above the midline of this zone. That level is the one that would show buyers are actually stepping back in and absorbing the sell side. If the market can reclaim it, a short term reversal becomes possible, and the first targets would be the inefficiencies left behind during the recent selloff. From there, the market would still need to break a series of lower highs before a proper shift is confirmed on the daily timeframe.
Bearish Scenario
If the daily candle fails to close above that internal level highlighted on the chart, viewers should expect continuation lower to become the more probable scenario. A failed close there tells you buyers did not manage to hold the midpoint of the range, which usually means the market is preparing to reach for deeper liquidity. In that situation, the next major support zone below becomes the logical draw, and the path shown on the chart, a small bounce followed by another leg down, fits well with the current momentum.
Conclusion
Bitcoin is sitting at a decision point. Either this support zone does its job again and gives the market enough fuel for a recovery, or the daily close confirms that the level has weakened and the market is ready to reach for the next higher timeframe support. Until that close gives clarity, patience is key, since this is typically where traders get chopped if they try to force a direction too early.
___________________________________
Thanks for your support!
If you found this idea helpful or learned something new, drop a like 👍 and leave a comment, I’d love to hear your thoughts! 🚀

Sony Primed for Explosive Gains| Are You On Board?📈 SONY Long-Term Outlook: A Powerful Multi-Decade Bullish Setup
Sony’s price history tells the story of a giant evolving through different market cycles, reflecting both fundamental strength and classic price behavior expected in large-cap growth leaders.
🌊 Wave Theory Confluence — Clear Impulsive and Corrective Phases
The price pattern shows a strong rhythm of impulsive advances followed by corrective pullbacks, typical of major Elliott Wave cycles. The current leg looks like a robust third wave , often the most powerful phase in any cycle, characterized by accelerating price moves and increasing market participation.
After this wave completes, a corrective phase is likely, giving the market a healthy breather before the final leg higher in the long-term cycle.
📐 Fibonacci Retracement & Extension — Precision Targets
Using Fibonacci levels, we see clear alignment between price targets and wave progression:
The 1.618 extension zone marks a natural resistance and profit-taking area for the current wave.
The 2.618 extension sets a more ambitious target for the full completion of this cycle, indicating the potential for substantial upside.
These fib levels offer strong confluence zones where smart money often takes profits or enters fresh positions.
🧱 Market Structure — Well-Defined Support and Resistance
Sony’s price action respects key support and resistance levels on a multi-decade scale. The structure shows:
Clear higher lows confirming the uptrend
Breakouts from prolonged ranges indicating fresh momentum
Price respecting previous highs as new support zones
This behavior signals a healthy and sustainable bullish market structure, reducing the risk of sudden, sharp reversals.
🧠💼 Smart Money Concepts — Evidence of Institutional Accumulation
Long-term sideways periods likely represent institutional accumulation, where ‘smart money’ builds positions quietly. The recent sustained advances confirm that these large players are confident in Sony’s future growth, supporting the ongoing uptrend.
🔄 Price Action — Controlled and Sustainable
Sony’s price action avoids erratic spikes or parabolic moves, which often precede sharp corrections. Instead, the steady stair-step advances suggest a controlled, disciplined trend, favored for lasting growth rather than short-term hype.
🔄 Market Cycle — Early to Mid Expansion Phase
The broader cycle context suggests we are in an early to mid-stage expansion , meaning there is significant room for price growth before market psychology reaches euphoric levels. This phase typically features strong institutional buying, positive fundamentals, and growing investor confidence.
🎯 Summary and Outlook
The current trend aligns with an impulsive wave in a long-term cycle, supported by Fibonacci targets.
Market structure and price action confirm a strong, sustainable uptrend.
Smart money accumulation adds conviction to the bullish case.
Fundamentals underpin Sony’s ability to grow revenues and earnings over decades.
Expect a correction phase after reaching initial targets, followed by a final leg to new highs.
Sony looks set for a major multi-year bull run , driven by a powerful confluence of technical, fundamental, and behavioral factors. Patience and discipline will be key as this setup unfolds over time.
Tap in now and ride the wave—comment your thoughts below! 👇
⚠️ Disclaimer: For educational purposes only. Not financial advice. DYOR before trading.
#StockMarket #Sony #ElliottWave #Fibonacci #SmartMoney #TradingView #Investing #LongTermGrowth #MarketAnalysis #BullRun

US100 Free Signal! Sell!
Hello,Traders!
US100 is reacting inside the horizontal supply, where bearish orderflow continues to cap every rally attempt. With liquidity sitting below the prior swing lows, price is positioned for a corrective push lower.
--------------------
Stop Loss: 25,210
Take Profit: 24,901
Entry Level: 25,048
Time Frame: 2H
--------------------
Sell!
Comment and subscribe to help us grow!
Check out other forecasts below too!
Disclosure: I am part of Trade Nation's Influencer program and receive a monthly fee for using their TradingView charts in my analysis.

EUR-GBP Will Keep Growing! Buy!
Hello,Traders!
EURGBP is retesting a horizontal demand area, aligning with premium–discount dynamics. If the level holds, bullish delivery could target liquidity resting above 0.8850. Time Frame 4H.
Buy!
Comment and subscribe to help us grow!
Check out other forecasts below too!
Disclosure: I am part of Trade Nation's Influencer program and receive a monthly fee for using their TradingView charts in my analysis.

EURUSD – Bullish Setup Toward 1.16EURUSD – Bullish Setup Toward 1.17
EURUSD is showing strong signs of a bullish reversal after an extended period of downside movement. The 3H chart highlights several Market Structure Shifts (MSS) and Breaks of Structure (BOS) suggesting that bearish momentum is fading and buyers are regaining control near the 1.1500 demand zone.
The price is forming a solid accumulation base, indicating that smart money may be positioning for a move higher. A clean break above the 1.1680–1.1730 resistance area could confirm a trend reversal, opening the way for a sustained bullish rally toward the mid-1.18 region.
With momentum strengthening and structure turning positive, EURUSD looks poised for a potential breakout continuation in the days ahead.
📈 Key Insights:
Structure: Bullish reversal forming on 3H timeframe
Support zone: 1.1500 – strong accumulation base
Upside targets: 1.1680 → 1.1730 → 1.1800
Outlook: Buyers regaining control; bullish continuation likely

Bitcoin – From Break to Battle: Will the Bulls Hold the Line?Bitcoin has broken its four-hour downtrend line, marking a potential shift in momentum after an extended bearish phase. The move has sparked renewed interest from buyers, signaling the first real attempt to reclaim structure after consistent lower highs. Despite this progress, the market remains trapped beneath a strong resistance area that has historically acted as a ceiling for price action.
Structure and Key Levels
Following the breakout, Bitcoin left behind a fair value gap, which has now been fully filled, resulting in a healthy bullish reaction. This confirms that the imbalance served as an effective demand zone, attracting buyers back into the market. Above current price, however, lies a key resistance zone that aligns with a previous liquidity sweep, keeping the risk of rejection in play.
Bullish Scenario
If buyers can maintain control above the filled gap and sustain momentum, the structure could expand higher as liquidity above recent highs becomes the next target. A decisive break and hold above the resistance zone would confirm the continuation of bullish intent and potentially establish a higher low formation on the four-hour timeframe.
Bearish Scenario
If price struggles to gain acceptance above resistance and fails to hold its current structure, a rejection could trigger a deeper retracement. This would likely drive the market back into the range below, turning the breakout into a liquidity grab rather than a true reversal. A return toward previous demand areas would then become likely as sellers reclaim control.
Price Outlook
At this point, Bitcoin appears to be consolidating between the strong resistance above and the fair value gap below. This range may act as a decision zone for the next leg. A clean break to the upside would confirm strength and validate the recent shift in structure, while a hard rejection would suggest that the broader downtrend is not yet over.
Conclusion
Bitcoin is at a crucial juncture, trading between a proven supply area and a fresh demand zone that just produced a strong reaction. The market’s next move will reveal whether this breakout can evolve into a sustained trend reversal or if it was simply another liquidity sweep within a broader bearish context.
___________________________________
Thanks for your support!
If you found this idea helpful or learned something new, drop a like 👍 and leave a comment, I’d love to hear your thoughts! 🚀

GBPJPY FREE SIGNAL|SHORT|
✅GBPJPY traded into a clear supply level where premium pricing aligns with prior liquidity grabs. Smart money could engineer a short-term distribution before delivery to lower inefficiency.
—————————
Entry: 204.000
Stop Loss: 204.420
Take Profit: 203.297
Time Frame: 4H
—————————
SHORT🔥
✅Like and subscribe to never miss a new idea!✅

EUR-USD Local Short! Sell!
Hello,Traders!
EURUSD is approaching a horizontal supply area where short-term liquidity above recent highs may attract smart money reactions, creating a potential short setup. Time Frame 2H.
Sell!
Comment and subscribe to help us grow!
Check out other forecasts below too!
Disclosure: I am part of Trade Nation's Influencer program and receive a monthly fee for using their TradingView charts in my analysis.

XAU Empire | Bullish FlowXAU Empire | Bullish Flow
The market maintains a bullish structure after confirming a break of structure (BOS). Price is currently retracing into a short-term demand zone near 4,100, showing healthy correction within trend. This zone is acting as accumulation before potential continuation.
Momentum supports a move toward 4,316 – 4,386, aligning with unfilled imbalance and previous supply area. Institutional flow remains on the buy side as long as price holds above 4,080.
---
Market Bias: Bullish
Short-Term Range: 4,100 – 4,386
Key Focus: Retracement for continuation
