CAD-CHF Bearish Breakout! Sell!
Hello,Traders!
CADCHF broke structure below the supply zone, confirming bearish order flow. Price is likely to retrace toward premium before extending into lower liquidity pools. Time Frame 4H.
Sell!
Comment and subscribe to help us grow!
Check out other forecasts below too!
Disclosure: I am part of Trade Nation's Influencer program and receive a monthly fee for using their TradingView charts in my analysis.
Smartmoneyconcepts

Gold Traders Beware | Sell the Trap, Buy the Expansion💥 GOLD: Smart Money is setting the trap! 💰 Expect a dip to 🟩 3800 before the $5,100 breakout. Don’t chase — position smart. 🚀
Gold has been unstoppable — printing higher highs and leaving emotional traders behind.
But now… the Smart Money trap is loading ⚠️
Price has tapped into the 🟥 4160–4220 premium zone , where liquidity is stacked and institutions quietly prepare their next move. Before the massive bullish rally to $5,100+ , expect one last shakeou t — a dip engineered to flush retail longs and reload institutional buys near 🟩 3880–3800.
The crowd will panic. The pros will accumulate. Stay patient, trade smart. 🧠✨
📊 Smart Money Breakdown:
🧠 Institutional Playbook:
Liquidity resting above recent highs 🧲
🟥 4160–4220 = Smart Money Distribution Zone
🟩 3880–3800 = Discount Reaccumulation Zone
Expect a fake-out drop → explosive bullish reversal
💡 Trade Plan:
🔻 Sell Zone: 🟥 4,161 – 4,219
🎯 Targets: 🟩 3,880 – 3,800 (ideal long re-entry area)
🚀 Ultimate Target: $5,100+ (once discount OB holds)
🟨 Price Action Confluences:
Liquidity sweep above structure highs 🩸
Fair Value Gap + Order Block alignment ⚙️
Higher-timeframe BOS still intact 💪
Elliott-style wave 2 correction before next expansion 🌊
🧭 Bias Overview:
🟥 Short-term: Controlled bearish correction
🟩 Mid-term: Explosive bullish continuation → $5,100+
💭 Mindset: Trade the trap — not the emotion .
⚠️ Disclaimer:
This content is for educational and informational purposes only.
It does not constitute financial advice.
Always apply your own analysis and risk management before trading. 💡
🔥 Follow for Smart Money + Price Action setups the big banks don’t share!
💬 Comment below — are you selling the trap or waiting to buy the dip?
⚡ Let’s ride the Gold move together — with precision, not emotion.
#Gold #XAUUSD #SmartMoneyConcepts #PriceAction #LiquiditySweep #OrderBlock #SwingTrading #Commodities #GoldAnalysis #FVG #TradingView #InstitutionalTrading #MarketStructure #GoldForecast #Forex

GBPCAD LOCAL LONG|
✅GBPCAD swept sell-side liquidity below a key low and rebounded from a refined demand zone, signaling potential bullish displacement toward the next internal range high. Time Frame 3H.
LONG🚀
✅Like and subscribe to never miss a new idea!✅

GBP-JPY Free Signal! Sell!
Hello,Traders!
GBPJPY is tapping into a key supply area where prior liquidity rests above equal highs. The market structure hints at exhaustion and a potential move lower toward discount levels as the supply level was clearly rejected!
---------------------
Stop Loss: 203.440
Take Profit: 202.300
Entry: 202.863
Time Frame: 4H
---------------------
Sell!
Comment and subscribe to help us grow!
Check out other forecasts below too!
Disclosure: I am part of Trade Nation's Influencer program and receive a monthly fee for using their TradingView charts in my analysis.

EURUSD REBOUND AHEAD|LONG|
✅EURUSD broke structure to the upside, reclaiming a key demand block after sweeping sell-side liquidity. Price may continue expanding toward the next buy-side imbalance. Time Frame 3H.
LONG🚀
✅Like and subscribe to never miss a new idea!✅

GOLD Free Signal! Sell!
Hello,Traders!
GOLD formed a clear double-top at the premium area and broke below the neckline, confirming bearish intent. A retest of structure offers short opportunities toward discount liquidity.
---------------------
Stop Loss: 4,149$
Take Profit: 4,097$
Entry: 4,126$
Time Frame: 1H
---------------------
Sell!
Comment and subscribe to help us grow!
Check out other forecasts below too!
Disclosure: I am part of Trade Nation's Influencer program and receive a monthly fee for using their TradingView charts in my analysis.

NZD-CAD Free Signal! Buy!
Hello,Traders!
NZDCAD is reacting within a premium zone after filling imbalance and tapping into a horizontal supply area. The move shows potential redistribution for a leg higher.
---------------------
Stop Loss: 0.7955
Take Profit: 0.7905
Entry: 0.7925
Time Frame: 2H
---------------------
Sell!
Comment and subscribe to help us grow!
Check out other forecasts below too!
Disclosure: I am part of Trade Nation's Influencer program and receive a monthly fee for using their TradingView charts in my analysis.

EUR-AUD Local Short! Sell!
Hello,Traders!
EURAUD is trading inside a premium range, rejecting from a horizontal supply area with strong bearish reaction and clean imbalance left below—suggesting a potential continuation lower. Time Frame 2H.
Sell!
Comment and subscribe to help us grow!
Check out other forecasts below too!
Disclosure: I am part of Trade Nation's Influencer program and receive a monthly fee for using their TradingView charts in my analysis.

USD-CHF Bullish Rebound! Buy!
Hello,Traders!
USDCHF is showing reaction off a key demand reaccumulation block after a strong displacement move, hinting at potential short-term retracement toward the inefficiency above. Time Frame 4H.
Buy!
Comment and subscribe to help us grow!
Check out other forecasts below too!
Disclosure: I am part of Trade Nation's Influencer program and receive a monthly fee for using their TradingView charts in my analysis.

Bitcoin – Bulls Need Confirmation Before the Next Leg UpBitcoin first swept the all-time high, taking out liquidity before showing signs of exhaustion. This move triggered a sharp selloff that rebalanced the previous inefficiency left behind on the daily chart. The rejection from that premium area set the tone for a corrective phase, bringing price back into discount levels where buyers are now attempting to re-establish control.
Consolidation Structure
After the ATH sweep, Bitcoin formed a clear lower high structure. The subsequent drop not only filled an existing daily Fair Value Gap but also created another sweep within that same range. This type of double sweep formation often acts as a transition phase between bearish distribution and potential accumulation, provided the market finds enough volume support at lower levels.
Bullish Scenario
The most recent move filled the lower wick and swept local lows, which typically indicates a liquidity grab before a shift in sentiment. If bulls can close above the highlighted level with strong volume, this would suggest a market structure shift on higher timeframes and could trigger a push toward the 111,000–114,000 region, where the next daily inefficiency lies inside the previous sweep zone.
Bearish Scenario
Failure to reclaim and close above the key resistance level would suggest that the current move is only a retracement within the broader bearish leg. In that case, Bitcoin could revisit the 100,000–101,000 area to re-test the liquidity base created by the recent wick fill, potentially even running the lows one more time before forming a clearer accumulation range.
Price Target and Expectations
If bullish confirmation comes through, the initial target sits near 111,000, aligning with the lower boundary of the daily FVG. A clean breakout beyond 114,000 would further confirm strength and possibly open the way back toward the 118,000–120,000 region where prior inefficiencies remain unmitigated.
Conclusion
Bitcoin has completed a deep corrective sweep, but bulls have yet to prove dominance. A decisive close above the marked resistance with solid volume would confirm that buyers are regaining control and set the stage for continuation toward the higher daily imbalance. Until then, patience is key, as the current move remains a potential retracement rather than a confirmed reversal.
___________________________________
Thanks for your support!
If you found this idea helpful or learned something new, drop a like 👍 and leave a comment, I’d love to hear your thoughts! 🚀

When the Data Says EUR/USD Is 89.5% Likely to Go Higher…Most traders stare at price.
We measure the behavior driving it.
What happens when you data-mine market structure itself?
You stop guessing — and start seeing probabilities behind every move.
Structure Lab’s data shows an 89.5% probability that EUR/USD reaches the 50% retracement (EQ) of the prior internal leg — sitting above current price.
Here’s what the data says:
– Swing structure remains bullish (last BOS to the upside)
– Internal structure turned bearish to form the pullback, bottoming Nov 5 in a Phase C configuration (Counter Swing + Pro Internal)
– Now in Phase B (Pro Swing + Counter Internal), pushing higher
Monday printed an inside day — full range inside Friday’s high-low.
Price is drifting lower, stacking buy-side liquidity with descending highs — the kind of structure that often fuels the next impulse.
Three high-probability statistical levels rest above:
1.21%
1.65%
1.78%
(measured from the recent internal low)
Here’s the kicker — 80% of Phase B legs take 5–9 days to complete.
We’re only 2 days in.
The math leans higher.
📊 1-hour timeframe — price as behavior, not noise.
More high-probability setups dropping every week—follow for statistical edges you won't find anywhere else.
Want the full breakdown? Entry trigger, invalidation, and scaling strategy? Drop a "📊" in the comments and I'll share the complete game plan.
Let me know what you want to see more of. 👇

USDCAD Alert! — Smart Money + Elliott Wave + Price Action + Fib🚨 USDCAD Wave C Correction Alert!
According to Wave Theory Confluence , we’re likely approaching the end of Wave B (Y) around the 1.4150–1.4300 zone — aligning with the 0.5–0.618 Fibonacci retracement levels. 📉
Price is showing exhaustion near this area with signs of liquidity grab (BSL hit) and smart money distribution , suggesting potential bearish reversal setups ahead. 🔍
Expecting Wave C to unfold next, targeting deeper downside correction before the next impulsive leg resumes.
📊 Key Confluences:
Elliott Wave B completion zone
Smart Money liquidity sweep
Bearish structure shift forming
Fibonacci rejection area
Fundamentals still favor short-term CAD strength
💡 Trade Idea: Watch for confirmation of bearish momentum and structure break before entering shorts toward 1.33–1.32 region.
Stay sharp — Wave C could be fast and decisive! ⚡
What’s your take, traders? 🤔
Do you think Wave C is about to drop hard or will bulls surprise us again? 🐻📉🐂
Drop your analysis 👇 — let’s see who nails the next big move! 🚀
#USDCAD #ForexAnalysis #ElliottWave #SmartMoneyConcepts #PriceAction #WaveTheory #ForexTrading #SwingTrade #Fibonacci #FXForecast #TechnicalAnalysis #TradeSetup #MarketStructure #USD #CAD #ForexCommunity

USD-CHF Free Signal! Sell!
Hello,Traders!
USDCHF is retracing from a horizontal supply area after internal liquidity sweep. Smart money traders may look for a bearish continuation toward 0.8017 as liquidity below equal lows gets targeted.
---------------------
Stop Loss: 0.8077
Take Profit: 0.8017
Entry: 0.8048
Time Frame: 5H
---------------------
Sell!
Comment and subscribe to help us grow!
Check out other forecasts below too!
Disclosure: I am part of Trade Nation's Influencer program and receive a monthly fee for using their TradingView charts in my analysis.

CAD-CHF Short From Supply Area! Sell!
Hello,Traders!
CADCHF is reacting from a premium supply zone where liquidity was previously engineered. Expect a short-term drop toward the next demand imbalance as smart money rebalances the range.Time Frame 5H.
Sell!
Comment and subscribe to help us grow!
Check out other forecasts below too!
Disclosure: I am part of Trade Nation's Influencer program and receive a monthly fee for using their TradingView charts in my analysis.

DOGEUSDT – Bearish Setup Toward $0.15 DOGEUSDT – Bearish Setup Toward $0.15 📉
Dogecoin remains under strong bearish pressure, following multiple Breaks of Structure (BOS) and Market Structure Shifts (MSS) on the 3H timeframe. After a brief consolidation phase, price continues to respect the descending trend, indicating a lack of bullish strength.
Currently, DOGEUSDT is attempting a minor upward correction, likely to retest the $0.20 supply zone — a region that could act as a liquidity grab before the next major downside move. If price fails to hold above that zone, the market may trigger a sharp drop toward the $0.15 level, confirming continuation of the broader bearish trend.
Momentum remains weak, and sellers continue to dominate short-term rallies — suggesting further downside pressure in the coming sessions.

GBP-NZD Bullish Bias! Buy!
Hello,Traders!
GBPNZD has retested a bullish demand zone after breaking structure to the upside. Smart money may engineer a deeper pullback before pushing toward the next liquidity pool above. Time Frame 3H.
Buy!
Comment and subscribe to help us grow!
Check out other forecasts below too!
Disclosure: I am part of Trade Nation's Influencer program and receive a monthly fee for using their TradingView charts in my analysis.

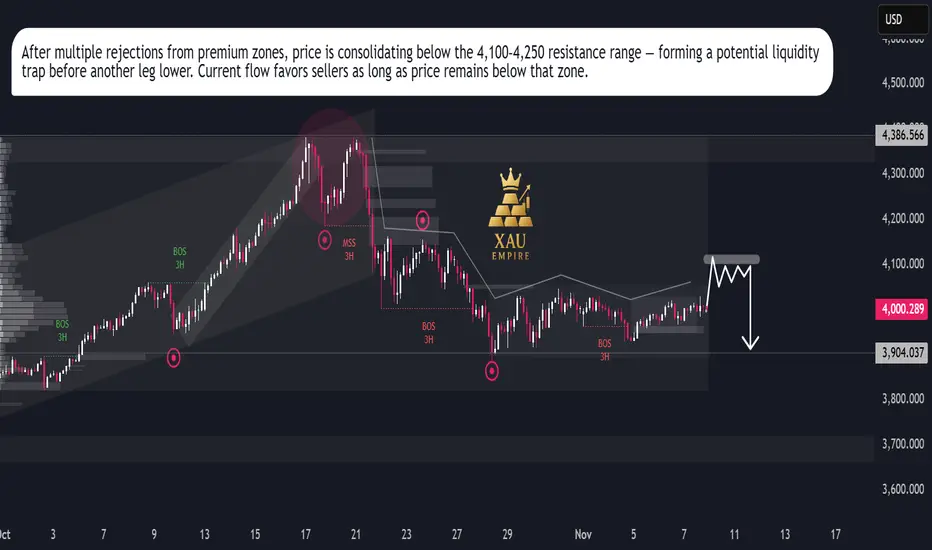
Gold – Distribution Before DropGold – Distribution Before Drop
Gold is showing signs of exhaustion after the recent corrective bounce. The 3H market structure highlights a clear distribution pattern, as price continues to reject from the 4,100–4,250 supply zone. Repeated Break of Structure (BOS) signals that bearish momentum remains dominant.
Institutional activity suggests that liquidity is being built above local highs, preparing for another downside leg. The current market sentiment stays bearish as long as price trades below the key premium area. A confirmed rejection from this zone could trigger a decline toward the 3,904 liquidity pool.
Only a breakout and hold above 4,250 would invalidate this scenario and shift bias back to bullish accumulation.
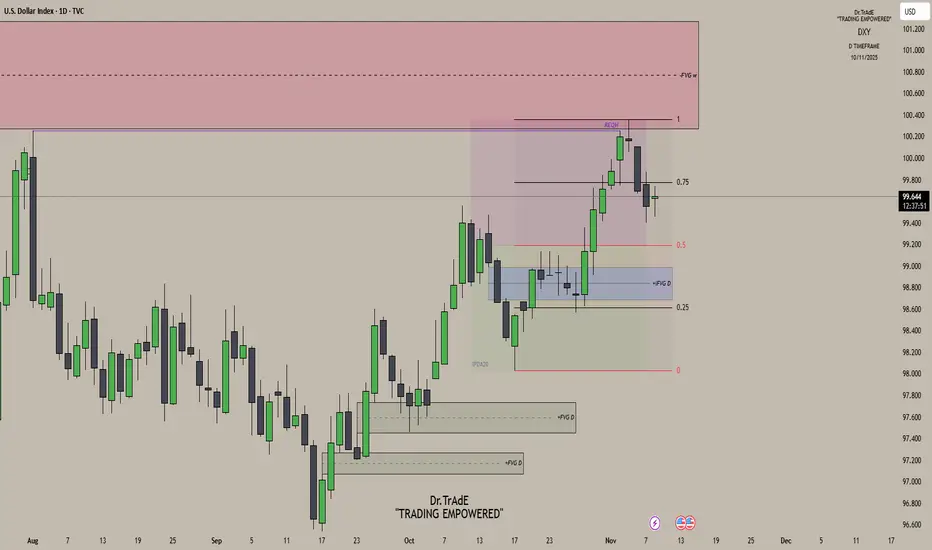
DXY Daily AnalysisLast Week’s Review:
Monday: Bullish delivery as price continued higher.
Tuesday: Price maintained bullish momentum but failed to take out the previous high, leaving equal highs — liquidity resting above.
Wednesday: That liquidity was swept as price reached into the weekly fair value gap, completing delivery to the premium array and initiating bearish distribution.
Current Outlook:
On the daily chart, we’re still trading deep inside premium, and price is showing clear signs of exhaustion after that delivery into the weekly FVG. With bearish distribution now in play, my bias remains bearish. Any short-term push back into the 0.75 quadrant, I’ll treat as a retracement — a chance for price to reprice some lower-timeframe inefficiencies before the next leg lower. On the 4H chart, I’ll be watching for price to trade back into short-term FVGs or inefficiencies that align with this overall bearish narrative.
Back to the opening price?1.845 > just under 1.85 looks interesting on GBP/CAD today.
Price has traded below the Asian Lows this morning and given a bullish bounce off!
I'm sharing the 15m chart, and price has currently retraced back into a potential zone where we have the following confluences:
- 50% FIB
- 15m FVG
- 15m BR
Kind regards,
Aman

US100 Free Signal! Buy!
Hello,Traders!
US100 Price has retraced back into a premium supply area after internal liquidity sweep. Smart money is likely to reprice lower, targeting inefficiency and equal lows beneath the recent range.
---------------------
Stop Loss: 25,256$
Take Profit: 24,951$
Entry Level: 25,133$
Time Frame: 3H
---------------------
Sell!
Comment and subscribe to help us grow!
Check out other forecasts below too!
Disclosure: I am part of Trade Nation's Influencer program and receive a monthly fee for using their TradingView charts in my analysis.

GBP-USD Will Keep Growing! Buy!
Hello,Traders!
GBPUSD smart money confirmed a bullish structure shift after sweeping sell-side liquidity. Price broke out from a demand range and is likely to retest before expansion to premium levels. Time Frame 2H.
Buy!
Comment and subscribe to help us grow!
Check out other forecasts below too!
Disclosure: I am part of Trade Nation's Influencer program and receive a monthly fee for using their TradingView charts in my analysis.

GOLD Will Fall! Sell!
Hello,Traders!
GOLD smart money tapped into a premium supply zone, engineering liquidity above equal highs before reacting lower. Expect price to deliver downside toward the next demand imbalance. Time Frame 2H.
Sell!
Comment and subscribe to help us grow!
Check out other forecasts below too!
Disclosure: I am part of Trade Nation's Influencer program and receive a monthly fee for using their TradingView charts in my analysis.

CHF-JPY Free Signal! Sell!
Hello,Traders!
CHFJPY tapped into a horizontal supply area after engineering liquidity above internal highs. Expect a bearish reaction as smart money delivers price toward the next demand imbalance.
---------------------
Stop Loss: 190.714
Take Profit: 190.165
Entry: 190.493
Time Frame: 2H
---------------------
Sell!
Comment and subscribe to help us grow!
Check out other forecasts below too!
Disclosure: I am part of Trade Nation's Influencer program and receive a monthly fee for using their TradingView charts in my analysis.
