BTC hitting the Monthly 20EMA supportBTC has touched the Monthly 20EMA (overlayed on this 4H chart) on a huge sell off, should make a strong bounce here or it's off to the pits of hell going into December.
SMAS

EURCAD testing weekly SMA on 1H oversold RSIAs per subject, standard simple setup, EURCAD testing the weekly 20SMA on an oversold RSI on hourly. Also hitting the top of FVG created on Sept 5th. Nothing is certain. Tight SL.

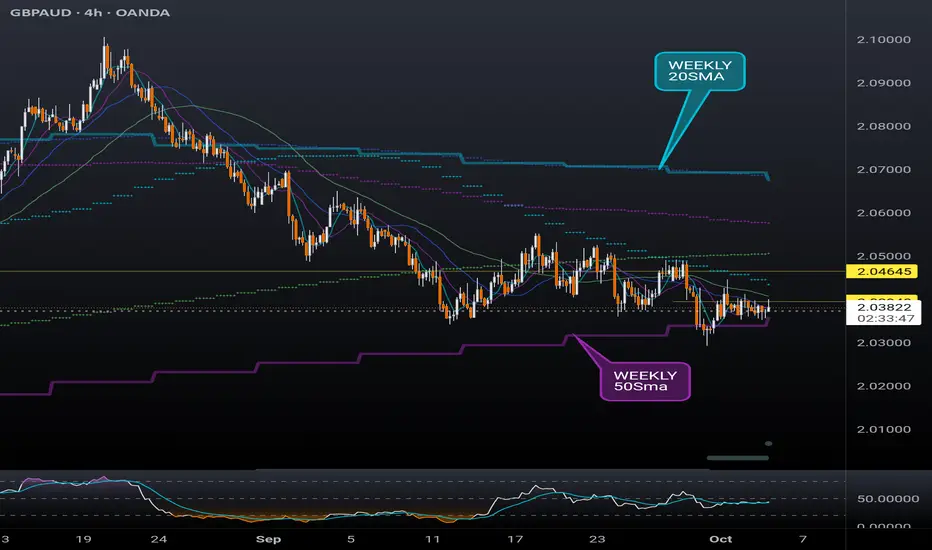
BXY approaching weekly 50SMA & monthly 20EMAThe pound is due for a rally as it is nearing critical SMA and EMA. The algorithm presumably has to test these moving averages before higher highs. If support holds, all pound pairs should see some bullish momentum.

GBPCAD Weekly 50SMA testPrevious idea failed at the 200SMA which is why tight SL was key. Now testing a stronger support at the weekly 50SMA and a daily support level dating back to early August. Tight SL for this kind of play. Fundamentally, BoC rate cut today should play a factor in the long hypothesis but the conference after the rate decision leaned towards a hawkish stance.

GBPCAD daily 200SMA testPair is reaching the daily 200SMA (overlayed on this 4H chart). Looking for a bounce here into tomorrow morning, BoC announcing an expected rate cut, could send longs if forecast is met. Hourly RSI oversold, 4H RSI entering oversold territory. Simple play, tight SL.

AUDCAD potential long setupLooking at AUDCAD this morning and noticed the 3 bounces off the Monthly 50EMA (overlayed on this 4H chart). The pair is stuck in a wide range after a strong September rally linked to the gold (commodities) strength and above forecast AUD economic data. The pair is also sitting at a critical trend line support while RSI is positioned well for a move upward.
Fundamentally, precious metals are erasing Friday's losses while a meeting between President Trump and Australian PM Albanese is set to take place Monday morning to discuss a critical minerals deal (among other topics), which could boost the AUD significantly. In the meantime the Canadian government continues to follow Brussel's lead in economic obliteration and CAD insignificance.
I could be wrong, I'm a nobody.

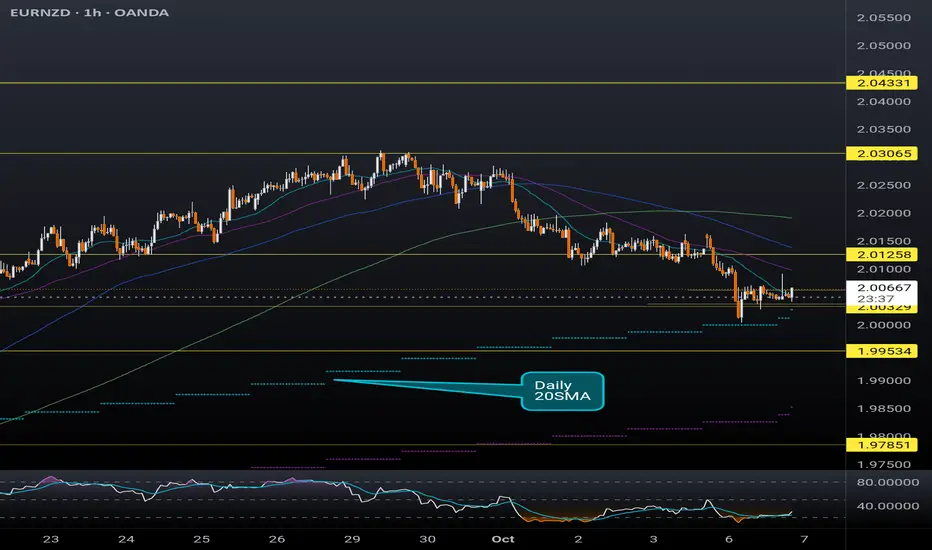
EURNZD finding support at the daily 20SMASimilar to the previous 2 posts regarding GBP pairs, EURNZD is currently riding support at the daily 20SMA (overlayed on this 1H chart). The hourly RSI is also indicating this pair is oversold. RBNZ is expected to cut interest rate tomorrow by another 25 basis points which could be the catalyst to realizing this potential bullish move. Recent weakness in the NZD came after the latest interest rate cut, and if further dovish comments follow the interest rate decision tomorrow, this pair could retest the 2.03xx high hit in late September.
GBPAUD finding support on Weekly 50SMASimilar to the previous post regarding GBPJPY, the British pound is finding support at the weekly 50SMA (overlayed on this 4H chart) after a long sell off indicated in the RSI. Cautiously bullish on GBPAUD considering recent strength in the Aussie dollar due to gold hitting new ATHs (and commodities rallying in general). Approach this with expectations of lots of rejections and chop as price action breaks through the daily moving averages wedged between the 50 and 20 weekly SMA (daily and weekly SMAs overlayed on the 4H chart). This could potentially bounce to retest the weekly 20 currently at 2.06 area.
EMA, SMA and which one to choose? Educational PostArticle Written by Author of the book: The Happy Candles Way to wealth creation.
There is always a lot of debate while using chart whether to use EMA or SMA.
EMA = Exponential Moving Average.
SMA = Simple Moving Average.
In the below chart Black and Orange lines represent 50 and 200 EMA. Blue and the Lavender line represent the 50 and 200 SMA.
Simple Moving average is the actual average of the kind of SMA you are using that is 50 SMA is average of last fifty closings. Exponential moving average gives more importance to the recent price and less to the past prices in that order. For example, if you are calculating 50 EMA the weightage given to yesterday’s price is more than the weightage given to the price before 49 days. I personally use EMA for my charts when I want to take entry to some stocks. As I feel recent price influence the move of the candles more than past prices for future upward movement. At the same time for Profit booking I give more importance to SMA and 21 SMA in particular as I base my trailing stop losses based on monthly average.
To know more about EMAs and SMAs and importance of EMAs in particular you can read my book. The Happy Candles Way to wealth creation available in Paperback and Kindle version on Amazon where I have explained my Mother, Father and Small Child theory where I consider 50 EMA as mother line 200 EMA as father line and movement of a candle is compared to movement of a child playing in garden. In a very simple way I have tried to explain Techincal analysis related to stock price movement and their relation to EMAs.
Now whichever EMA or SMA you use. What I feel is you should remain consistent with it. Do not keep switching between the two. As you can see from the chart there is no major difference in position of both lines in the chart specially when the EMA or SMA is smaller in number. Moving averages are very helpful in determining the trend of the stock. Chances of its correction and support the stock price will get while falling down or resistance it might face if the price is below those lines.
EMAs and SMAs are excellent support when the stock price is above them and become fierce resistnace when the stock price is below these lines. Thus knowing where they are with respect to price is very important. My advice will be EMA or SMA should be part of your chart. Which one you use is a matter of choice. Staying consistent to the moving average you choose is important as Harivansh Rai Bachhan the famous Poet has said in his most famous poem Madhushala and I quote him, “Rah Pakad tu ek chala chal pa jayega Madhushala”. Meaning be consistent to your path and you will find your target.
Disclaimer: There is a chance of biases including confirmation bias, information bias, halo effect and anchoring bias in this write-up. Investment in stocks, derivatives and mutual funds is subject to market risk please consult your investment advisor before taking financial decisions. The data, chart or any other information provided above is for the purpose of analysis and is purely educational in nature. They are not recommendations of any kind. We will not be responsible for Profit or loss due to descision taken based on this article. The names of the stocks or index levels mentioned if any in the article are for the purpose of education and analysis only. Purpose of this article is educational. Please do not consider this as a recommendation of any sorts.

RENEWE LONG (RENEWE ENERGY GLOBAL PLC)s.e 10.38
s.l. 9.56
t.p. 12.43
The graph shows an important bull trend, the indicators divergence like MACD and SMAs show how we are not yet in the best position of entrance so we have to wait in order to clarify the message of indicators. however the sentiments is quite good on this company so a long position is good to do, that's why the stop loss is so closed.
no financial advice
