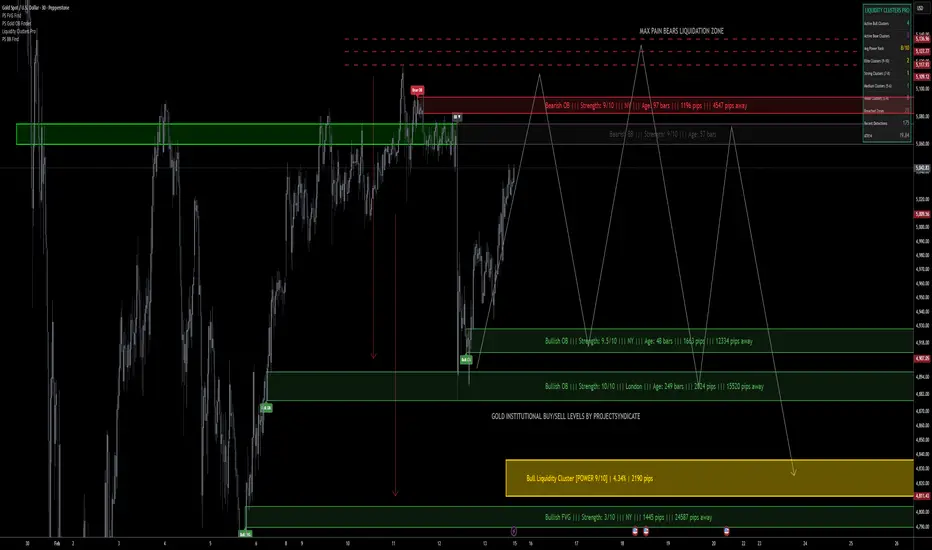
Gold Weekly Levels: Bears will target Liquidity: 4800 → 4900🔱 XAUUSD — GOLD WEEKLY OUTLOOK Price now: 5042
⬛ ProjectSyndicate FREE TradingView Smart Money Concepts Indicators
🩶 Want to get all key levels marked up on your gold chart Automatically?
🩶 Get the latest FREE SMC 2026 PS script via link below.
🩶 Add to your Favorites List and then just add to any chart From Favorites
🩶Liquidity Clusters Pro | ProjectSyndicate
🩶FVG Finder | NRP | ProjectSyndicate
🩶Order Block Finder | Gold | ProjectSyndicate
🩶Breaker Blocks Finder | Gold | ProjectSyndicate
Market remains in equilibrium / range conditions after the strong sell-off.
Bias stays the same: sell-side favored as long as price is capped below overhead liquidity.
🧭 MARKET STATE
Price is consolidating near balance → expect range + stop-hunts before the next rotation.
🧨 Weekly Bias: Short-side remains priority while below Premium liquidity.
🔻 OVERHEAD LIQUIDITY SHORT ZONES
Rallies are for selling — focus on these distribution pools:
• 5090 — Overhead liquidity stack (primary fade zone)
→ First stop-run / rejection area
• 5150 — Bear OB overhead
→ High-quality short trigger if expansion occurs
• 5150+ Max Pain Extension
→ Bears liquidation zone = potential squeeze before sell continuation
🎯 DOWNSIDE MAGNETS PROFIT POOLS BELOW
Primary draw remains sell-side liquidity underneath:
• 4920 — First downside rotation target
• 4890 — Continuation liquidity shelf
• 4800 — Bull OB / FVG major reaction zone
• 4820 — Heavy bullish liquidity cluster (strongest bounce risk)
🛡 HIGH-CONVICTION REACTION ZONES
Shorts should scale out aggressively into:
• 4800 Bull OB / FVG
• 4820 bullish liquidity cluster (hard defense zone)
Expect bounce attempts here — do not overstay shorts without confirmation.
🎯 WEEKLY STRATEGY UNCHANGED
✅ Primary Play: Short sell rips into overhead liquidity
📍 Entries: 5090 → 5150
🎯 Targets: 4920 → 4890 → 4800
⚠️ Longs are counter-trend unless price reaches 4800–4820 with clean confirmation.
🏦 Core execution:
Fade rallies into 5090, reload into 5150 Max Pain, take profits into 4800–4820.
🗳️ WEEKLY SCENARIOS
🅰️ Rip → 5090 rejection → rotation into 4920
🅱️ Squeeze → 5150 Max Pain → sharp dump into 4890–4800
🅲 Bounce at 4800–4820 → sellers reload next rip → continuation lower
📌 KEY LEVELS SUMMARY
Short Zones: 5090 / 5150
Targets: 4920 / 4890 / 4800
Major Bounce Risk: 4820 cluster
SMC
XAUUSD Bullish Break: Higher Low Confirms Gold UpsideGold (XAUUSD) is currently trading around the 5,040 – 5,050 zone, holding above a key internal support area after printing a clear Change of Character (ChoCH) followed by a Higher Low (HL).
The structure shows:
Previous Lower High (LH) formation
Break in structure → ChoCH
Formation of Higher High (HH)
Recent pullback into demand → New Higher Low (HL)
This sequence confirms a bullish market structure shift on the short-term timeframe.
🔎 Key Technical Observations
1️⃣ Change of Character (ChoCH)
Price broke the prior lower high, signaling the first shift from bearish to bullish order flow. This was the early indication that sellers were losing control.
2️⃣ Higher High (HH)
After the ChoCH, price expanded and printed a new higher high, confirming bullish intent and continuation potential.
3️⃣ Higher Low (HL) Retest
The current pullback respected the internal demand zone (green area) and formed another higher low — maintaining bullish structure integrity.
As long as price holds above the 4,900–4,950 support zone, upside pressure remains valid.
📈 Bullish Scenario
If buyers maintain control:
Short-term pullbacks remain buy opportunities
Liquidity above 5,100–5,200 becomes the next target
Expansion toward 5,300+ is possible if momentum increases
The projected path suggests consolidation followed by impulsive continuation toward previous supply liquidity.
📉 Bearish Invalidation
Bullish bias fails if:
Price closes strongly below 4,900
Structure shifts back into lower highs and lower lows
Demand zone gets decisively broken
Until then, the market structure favors buyers.
🧠 Trading Insight
This setup reflects classic Smart Money Concepts (SMC):
Liquidity sweep
Structure break (ChoCH)
Internal demand mitigation
Higher low continuation
Patience during pullbacks is key. Chasing breakouts without structure confirmation increases risk.
🔑 Key Levels to Watch
Support: 4,900 – 4,950
Intraday Resistance: 5,100
Liquidity Target: 5,200 – 5,300
Invalidation: Below 4,900
📌 Conclusion
Gold has transitioned from corrective behavior into a structured bullish phase. The formation of higher highs and higher lows suggests accumulation rather than distribution.
If demand continues to hold, XAUUSD could expand toward new short-term highs in the coming sessions.

Bitcoin - Weekly Outlook: Smart Money Defends the WickMarket Context
Bitcoin recently delivered an aggressive move lower, printing a large weekly wick that immediately signaled strong participation from buyers. Instead of allowing price to drift deeper, the market reacted precisely around the midpoint of that wick, an area that often acts as a technical equilibrium between buyers and sellers. When price respects such a level, it typically suggests that higher timeframe participants are stepping in, rather than short-term traders attempting a temporary relief rally.
Higher Timeframe Signal
Filling half of a weekly wick is rarely random. It represents a partial rebalance of inefficiency created during the impulsive move, while still leaving room for continuation in the original direction once the market stabilizes. The bounce that followed reinforces the idea that the sell pressure may have reached a short-term exhaustion point. When a reaction aligns this cleanly with a higher timeframe reference, it often becomes the foundation for the next structured move.
Lower Timeframe Confirmation
Dropping into the 4H chart, the reaction becomes even more convincing. Price not only respected the midpoint but also generated a clear displacement away from the level, leaving behind a gap. Gaps tend to act as magnets because the market naturally seeks efficiency, and unfinished business often gets revisited before continuation occurs. As long as structure remains supportive, the expectation shifts toward a retracement into that imbalance rather than immediate weakness.
The Role of the Gap
The newly formed gap provides a logical pathway for price. Rather than chasing momentum, a controlled pullback into the imbalance would signal healthy market behavior, absorbing liquidity while preparing for a potential expansion. These types of movements are typically constructive, not bearish, because they demonstrate that buyers are willing to defend higher territory instead of allowing price to collapse back into prior ranges.
Daily Objective
With the weekly reaction acting as the anchor and the 4H gap offering a technical roadmap, the next area of interest becomes the daily key level above. Daily levels tend to attract price once momentum shifts, especially when the market transitions from a defensive bounce into a more deliberate recovery phase. If buyers maintain control, a move toward that daily objective would represent a natural progression rather than an overextension.
Conclusion
The combination of a weekly midpoint reaction, strong bounce behavior, and the presence of a fresh imbalance creates a structured narrative: rebalance first, then rotate higher. While short-term fluctuations are always possible, the current framework favors a gap fill followed by continuation toward the daily level, provided buyers continue to defend the higher timeframe support.
___________________________________
Thanks for your support!
If you found this idea helpful or learned something new, drop a like 👍 and leave a comment, I’d love to hear your thoughts! 🚀

USDJPY FREE SIGNAL|LONG|
✅USDJPY sell-side liquidity swept into 4H demand level with bullish displacement from discount area. Internal range holding, expect continuation toward external buy-side liquidity and premium FVG above.
—————————
Entry: 152.58
Stop Loss: 152.07
Take Profit: 153.31
Time Frame: 2H
—————————
LONG🚀
✅Like and subscribe to never miss a new idea!✅

SOLANA Huge Opportunity ---FOLLOW FOR MORE IDEASNot A Financial Advice.
Solana Just Raid Major Weekly Support So Best Case Scenario Is To Look For Only Longs .
I Try My Best To Show You The Current POI (Point Of Interest).
If The Supportive Gap That I Mark Is Voilate ,It Means It Doesn't Want To Yet Higher.
Wait & Look For Reclaim The Same Gap.
FOLLOW FOR MORE.

EURUSD NFP Reaction Confirms Supply StrengthQuick Summary
The strong 90+ pip drop after NFP confirms the strength of the supply zone and Price has not fully reached the main supply area yet
Current movement may represent liquidity engineering and a sweep above Equal Highs is likely before bearish continuation
Selling before liquidity is taken may be premature
Full Analysis
The sharp 90+ pip bearish reaction following the NFP release reinforces the idea that the supply zone above remains significant and respected by the market. Strong fundamental catalysts often reveal where real institutional orders are positioned, and this reaction suggests active sellers are present.
However, price has not yet fully tapped into the primary supply level. This raises the probability that the current structure is part of a broader liquidity-building phase rather than the start of an immediate sustained decline.
The recent price behavior indicate potential accumulation of liquidity. Equal Highs sitting above current price act as a clear liquidity magnet. From a market structure perspective, it would be logical for price to push higher, sweep those resting buy stops, and only then initiate the true bearish continuation.
For that reason, initiating short positions before a liquidity sweep above the Equal Highs may be premature. A cleaner scenario would involve:
1 - Liquidity sweep above EQH
2 - Clear rejection or bearish displacement
3 - Lower timeframe CHOCH confirming shift in control

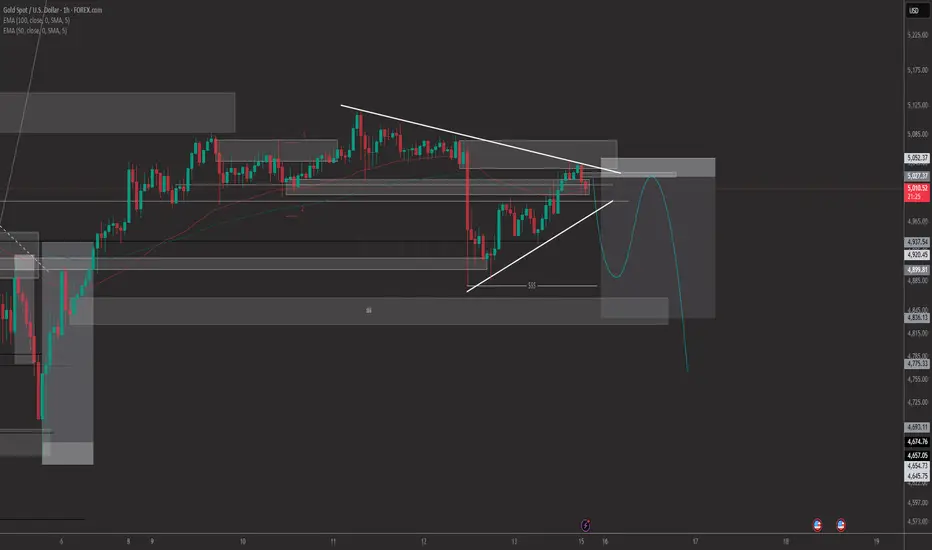
XAUUSD SELLPrice is currently consolidating inside a tightening structure with a clear descending resistance and rising support, showing compression right below a key supply zone around the 5,040–5,060 area. The rejection from the top of the range suggests buyers are losing momentum while price remains capped under the trendline and moving averages. If this structure breaks to the downside, the move could accelerate toward the lower liquidity zone and previous imbalance around the mid-4,8xx region, following a typical sweep-and-drop pattern. Overall bias remains bearish unless price can break and hold above the supply zone, which would invalidate the short setup.
AUDUSD MOVE DOWN AHEAD|SHORT|
✅AUDUSD bearish rejection from 4H supply with shift in structure and strong displacement. Price trading back in premium, expecting continuation toward sell-side liquidity and discount imbalance at target.Time Frame 4H.
SHORT🔥
✅Like and subscribe to never miss a new idea!✅

EUR-JPY Will Go Down! Sell!
Hello,Traders!
EURJPY strong bearish breakout below 7H horizontal supply confirms shift in structure. Premium liquidity taken, momentum accelerating lower. Expect continuation toward sell-side liquidity at target.Time Frame 7H.
Sell!
Comment and subscribe to help us grow!
Check out other forecasts below too!
Disclosure: I am part of Trade Nation's Influencer program and receive a monthly fee for using their TradingView charts in my analysis.

Week of 2/15/25: AUDUSDPrice has hit an unmitigated daily supply level after breaking daily structure so we can expect a pullback in structure which it's already doing. We are going to remain bearish until 1h structure is broken.

EURJPY STRONG BEARISH BIAS|SHORT|
✅EURJPY strong bearish displacement confirmed breakout below 5H supply. Structure shifted lower with sell-side liquidity in play. Expect minor retrace into premium before continuation toward external liquidity at target.Time Frame 5H.
SHORT🔥
✅Like and subscribe to never miss a new idea!✅

XAUUSD: FVG Resistance Hold Targeting the $4,700 Discount FloorThe recent attempt to reclaim the $5,100 psychological handle has met significant institutional selling pressure. The price is currently reacting to the bottom of the Fair Value Gap (FVG) and a bearish Order Block located between $5,100 and $5,130. This zone is acting as a solid ceiling, as the market lacks the volume to fill the entire imbalance.
Technical Evidence for the Short:
FVG Resistance: The $5,120 – $5,140 area represents the 61.8% Fibonacci retracement level, which is currently holding as major resistance.
Exhaustion Signals: Short-term indicators show "exhaustion of bullish strength" after gold reached its weekly high, suggesting a technical reversal is imminent.
Liquidity Magnet: Below the current price, there is a large pocket of downside liquidity and a secondary Discount Zone near the 200 EMA at $4,799.
Fundamental Pressure: Stronger-than-expected US labor data has bolstered the US Dollar Index, keeping gold under pressure and preventing a sustained breakout above $5,100
Neutral / Invalidation Dashboard
Bearish Bias: High conviction as long as gold fails to consolidate above the $5,140 mark.
Neutral Zone: $5,000 – $5,060 (Consolidation range).
Invalidation: A decisive break and close above $5,140 would negate the short setup and potentially trigger a move toward $5,312.
Final Thought: The "fill and drop" play is in full effect. After tapping the $5,120 Order Block, gold is showing clear signs of topping out. Expect a move back toward the $4,700 – $4,800 discount zone where long-term institutional support is likely to be re-tested.

AUD-USD Local Short! Sell!
Hello,Traders!
AUDUSD sharp rejection from 2H horizontal supply confirms bearish order flow. Liquidity grab above range completed, price trading back in discount. Expect continuation toward sell-side liquidity at target.Time Frame 2H.
Sell!
Comment and subscribe to help us grow!
Check out other forecasts below too!
Disclosure: I am part of Trade Nation's Influencer program and receive a monthly fee for using their TradingView charts in my analysis.

GBP-USD Free Signal! Buy!
Hello,Traders!
GBPUSD demonstrates strong reaction from discount FVG with bullish shift in structure. Liquidity swept below equal lows, momentum building higher, targeting buy-side liquidity near prior highs.Time Frame 6H.
Buy!
Comment and subscribe to help us grow!
Check out other forecasts below too!
Disclosure: I am part of Trade Nation's Influencer program and receive a monthly fee for using their TradingView charts in my analysis.

EURUSD Awaiting Liquidity Sweep above1.19570Quick Summary
Price is currently moving in a slow sideways range and still Waiting for a break of the candle wick at 1.19570 because Liquidity pool rests below this level
A minor push upward may follow to sweep retail liquidity
Bearish continuation is expected toward an unmitigated zone
Full Analysis
The market is currently trading within a very slow and tight consolidation phase, suggesting a temporary equilibrium between buyers and sellers rather than directional intent. At this stage, patience remains essential as the next meaningful move will likely be driven by liquidity objectives rather than pure momentum.
The key level being monitored is the candle wick at 1.19570. A break above this point could act as the initial trigger for a downside move, especially considering the presence of a liquidity pool resting beneath it. Taking this liquidity may provide the fuel required for the next phase of price delivery.
Following this liquidity grab, price may stage a minor upward retracement. This move would likely aim to sweep the wick highs once again, as they represent potential resting liquidity from retail traders who placed stop losses above recent highs.
After completing this double-sided liquidity sweep, the probability increases for bearish continuation toward the unmitigated zone left behind previously. Once price reaches that area, the reaction will determine whether it acts as support or if bearish momentum remains strong enough to drive the market even lower.

AUDNZD | Long IdeaLooking for this pair to continue it's uptrend this week.
Seeing a small reaction now on the Wednesday low, we could see price dropping a little further to find liquidity followed by a move up.
I would like a lower entry here. best case somewhere in the green zone.
If this does not happen I am not taking any positions.
Will be looking further then...
Let me know what your analysis is!
This is not investment advice!

USD-CHF Will Fall! Sell!
Hello,Traders!
USDCHF strong rejection from 7H horizontal supply confirms bearish order flow. Liquidity grab above range completed, price shifting lower from premium. Expect continuation toward sell-side liquidity at target. Time Frame 7H.
Sell!
Comment and subscribe to help us grow!
Check out other forecasts below too!
Disclosure: I am part of Trade Nation's Influencer program and receive a monthly fee for using their TradingView charts in my analysis.

EURCHF WILL KEEP FALLING|SHORT|
✅EURCHF clean bearish breakout below 7H supply confirms BOS and shift in structure. Price trading under premium range, expecting minor retrace before continuation toward external sell-side liquidity at target.Time Frame 7H.
SHORT🔥
✅Like and subscribe to never miss a new idea!✅

Week of 2/15/26: EURUSD ForecastThe daily timeframe is currently retracing and 1h structure with it's internal is also bearish so we will follow the 1h structure for now until internal breaks to the upside. Last week EU is been in a large range, and we have marked a 4h supply zone above the range. We're going to wait patiently for buy side liquidity to be taken, look for an entry model, then enter short.

BTCUSD 4H Swing Long: Expanding Flat Meets Breaker Block BTC/USD 4H Swing Long: Expanding Flat Meets Breaker Block 🚀
The Structural Bias
As a swing trader, I am always hunting for higher timeframe structural alignments. Right now, Bitcoin is presenting a beautiful confluence on the 4H chart, combining both Wave Analysis and Smart Money Concepts (SMC).
Here is the exact breakdown of why I am taking this Long position.
1. The Wave Analysis: The Expanding Flat
After the recent push, price action entered a complex corrective phase.
The structure has formed a textbook Expanding Flat.
This specific wave pattern is a massive liquidity trap. It sweeps the highs to bait the breakout buyers, and then violently sweeps the lows to stop out the early buyers and trap the sellers.
Now that the final sweep of the lows is complete, the correction is over. The next impulsive move should be to the upside.
2. The SMC Confluence: The Breaker Block
Wave analysis tells us what the market is doing, but SMC tells us exactly where the entry is.
Look at where the final leg of this Expanding Flat terminated.
Price tapped perfectly into the 4H Breaker Block resting in the $67,000 - $68,000 zone.
This is not random. This shows clear institutional order flow stepping in to defend the level and absorb the remaining selling pressure.
The Trade Execution
I am playing the reaction off this zone. The Risk-to-Reward on this setup is incredibly clean.
Direction: LONG
This is a high-probability swing setup. Let the market structure dictate the execution, and let the trade breathe.
Disclaimer: This analysis is for educational purposes only and represents my own view of the market. Trading involves significant risk. Please manage your risk according to your own capital rules.

Nasdaq short planNasdaq looks weaker — we’re seeing downside movement within a bearish 1D OF. I expect a test of the 1D FVG, followed by continuation toward the 24,000 area.

SP500 Short planOn the index, I expect the correction to continue at least toward 6720, as price is showing weakness by forming a bearish 1W OB after taking ATH. I anticipate a pullback to the 1W OB / 1D FVG, followed by further downside continuation.

Gold isn’t moving yet — it’s loading.
🟡 Hello Goldies —
Gold starts the week at the top of a strong weekly expansion.
Structure is still intact ✅
Momentum remains bullish 📈
But — we’re now in a mature trend phase.
At these levels, continuation and rebalancing tend to alternate.
This isn’t early-trend pricing anymore.
This is positioning territory.
🌍 Macro Focus – USD-Driven Week
Gold will react mainly to key US data:
• FOMC Minutes → Tone on rate-cut timing = yield direction
• US GDP → Growth vs slowdown narrative
• Core PCE → Key inflation gauge for Fed expectations
• PMI + Initial Jobless Claims → Short-term economic pulse
📌 Scenario Mapping:
• Yields soften + stronger rate-cut expectations → Gold continuation higher
• Strong data + rising yields → Corrective rotation first
Macro sets the direction.
Structure decides the reaction zones.
Gold Multi-Timeframe Outlook
Gold remains structurally bullish on the higher timeframes, but price is currently rotating inside equilibrium rather than expanding. Momentum has slowed, and the market is deciding its next leg.
🔵 Weekly
Trend intact.
Price trading inside 4950–5100 equilibrium zone.
• Acceptance above → 5200–5350 supply
• Rejection → 4850 demand
• Loss of 4700 → deeper corrective phase
Continuation needs macro support.
🔵 Daily
Bullish structure, but compression phase.
5000–5120 = active decision zone
• Hold above → continuation toward 5200
• Break below 5000 → rotation into 4900
• Lose 4700 → structural shift
🔵 H4
5020–5080 = reaction band
• Break & accept above 5080 → 5160 → 5240
• Break below 5020 → 4960 → 4840
• Inside range → liquidity sweeps & fake breakouts
Not a trade zone. Wait for displacement.
🔵 H1
Intraday structure mildly bullish while higher-lows hold.
Bias weakens below 4920.
Acceptance outside 5020–5080 will define direction.
Summary
Gold is not trending — it’s positioning.
Higher timeframe structure favors continuation, but expansion requires acceptance above equilibrium.
Above 5080 → continuation.
Below 5020 → corrective rotation first.
Waiting for the displacement move.
Disclaimer ** For Educational purposes only, Trade at your own risk and use proper risk management
