EURUSD potential short ahead of CpiUnderlying conditions for this: USD Strength across the board.
Setup criteria
✅ Quick fall
✅ Pullback to a good level
What is still pending?
A clean sweep of that level and then an engulfing bearish candle into the level
What do we do now? We wait.
If this doesn't happen what do we do? Nothing.
" The game taught me the game "
SMC-ICT

The Ultimate GOLD || Intraday Trading Plan (10/23/2025)Welcome to Trade with Decrypters!
DETAILED AND COMPLETE ANALYSIS ( 5 TRADE SETUPS )
Central Bank Buying
Central banks added net 19t in August led by Kazakhstan (14t), Bulgaria and El Salvador, Q3 on pace for 1,000t+ annually up 41% from historical norms. BRICS drivers like China (300t+ YTD) and India's $100B reserves fuel de-dollarization and inflation hedges; Poland reaffirms targets amid risks. Silver links to EV/solar boom (+70% China demand). Outlook: Unfazed 1,000t buys lift prices into 2026.
ETF Inflows & Sentiment
Gold ETFs hit $472B AUM in Q3 (+23% q/q) with $64B YTD inflows, September $17B record led by North America/Europe; Asia minor outflows. Safe-haven rush amid trade wars, minor profit-taking post $4k peak. RSI 75 overbought, $3,900 support holds. Silver +$2B YTD on industry bets. Forecast: Gold $4,200 test, silver $50+.
Macro & Geopolitical Events
Fed Oct cut vs. 2.9% inflation/shutdown-delayed jobs—labor firmer but risks grow.
Trump's China tariffs fuel wars; BRICS stalls de-dollarization but boosts gold; Ukraine/Mideast hikes energy/inflation. Drives 50%+ YTD metals gains; tariffs add 1–2% CPI.
Silver Deficit
Fifth straight deficit at 118M oz in 2025 (down 21% YoY), demand stable 1.20B oz vs supply +3% to 1.05B oz, industrial record 680M+ oz from solar/EVs. Renewables offset jewelry drops
Futures & Options Flow
CME gold OI ~528k contracts, steady amid volumes; CVOL moderate, call/put skew bullish for rate-cut squeezes
Fundamentals & Forecast
Gold +51% to $4,062, silver +43% to $48—via 1,000t+ CB buys, inflation, cuts, 7% GDP deficits. De-dollarization/geo-risks dominate. Projection: Gold $4,400 Q4, silver $57 mid-2026

AUDCHF SHORT FROM SUPPLY ZONE|
✅AUDCHF is showing rejection from a major supply zone, suggesting that smart money is preparing for a bearish continuation toward the lower liquidity pool. The setup remains valid while below the supply range. Time Frame 3H.
SHORT🔥
✅Like and subscribe to never miss a new idea!✅

SPY FREE SIGNAL|SHORT|
✅SPY is reacting from the all-time-high zone where institutional orders previously accumulated. A short-term retracement is likely as price sweeps liquidity above premium highs before rebalancing to the nearest fair-value gap. Time Frame 2H.
SHORT🔥
✅Like and subscribe to never miss a new idea!✅

EURGBP REBOUND AHEAD|LONG|
✅EURGBP is respecting the ascending trendline, showing signs of institutional accumulation near the dynamic support. A potential move toward 0.8690 is anticipated as liquidity builds above the recent highs. Time Frame 2H.
LONG🚀
✅Like and subscribe to never miss a new idea!✅

EURUSD 1H Analysis: Bearish Pressure Builds📊 EURUSD – 1 Hour Analysis
Hello Guys,
Here’s my EURUSD analysis for you.
On the 1-hour chart, bears seem to have taken control, as selling pressure is clearly dominating the picture.
If EURUSD falls below 1.16446 and closes a candle there, my first target will be 1.16106.
🙏 Every like is my biggest motivation to keep sharing these analyses. Thanks to everyone supporting me!

AUDUSD FREE SIGNAL|SHORT|
✅AUDUSD price will soon enter the supply zone and may show a corrective reaction. A short-term pullback could confirm the retest, aligning with the next downside target near 0.6500. Time Frame 2H.
SHORT🔥
✅Like and subscribe to never miss a new idea!✅

AUDCAD SUPPLY LEVEL AHEAD|SHORT|
b]✅AUDCAD is approaching a previously defined supply zone where institutional orders are likely positioned. A reaction from this area could trigger short-term bearish flow toward the 0.9130 objective, completing a liquidity draw to the downside. Time Frame 2H.
SHORT🔥
✅Like and subscribe to never miss a new idea!✅

EURUSD Weekly analysis,4 Hours chartThe EURUSD is currently moving in a sideways, and it's somewhat difficult to predict its next move because there's a liquidity swing above the current price, an area that will strongly attract the price. But when will that happen?
This could happen after more liquidity is collected at the equal lows at 1.15423, so I'll only monitor the price when it reaches that level.
In this case, the entry signal will be either a change of character (choch) or SMT for the beginning of the rise to the liquidity swing.

The EURUSD will start to fallWe may see the beginning of a decline in the EURUSD when it touches the order block at 1.17186 levels, and if the 15-minute candle closes within the order block range, it will be a good opportunity to sell

EURUSD 4 Hour analysis - Sell opportunityThere is a selling opportunity on the EURUSD in the long term (4Hour chart) as the price may fall from the 1.16950 level because it left behind a liquidity void that will attract the price to fall in addition to the EQL at the bottom, which makes the possibility of breaking this level very likely.

EURJPY WILL GROW|LONG|
✅EURJPY retraced perfectly into the demand level after clearing liquidity below previous lows. Price shows bullish intent, with upside imbalance toward 177.00 likely to be filled. Time Frame 4H.
LONG🚀
✅Like and subscribe to never miss a new idea!✅

EURAUD BEARISH BIAS|SHORT|
✅EURAUD retraced into a clear supply level after a sharp displacement move. ICT traders anticipate distribution, targeting inefficiency around 1.7830 as price seeks sell-side liquidity. Time Frame 3H.
SHORT🔥
✅Like and subscribe to never miss a new idea!✅

CADJPY LOCAL SHORT|
✅CADJPY retraces toward a premium supply level before resuming its bearish leg. Price is likely to dive lower to target liquidity beneath 108.30 as Smart Money rebalances the range. Time Frame 2H.
SHORT🔥
✅Like and subscribe to never miss a new idea!✅

EURCAD BULLISH BREAKOUT|LONG|
✅EURCAD shows a clean breakout above the key level, confirming a bullish shift in market structure. ICT concepts suggest a potential retest before continuation toward 1.63000 where buy-side liquidity rests. Time Frame 3H.
LONG🚀
✅Like and subscribe to never miss a new idea!✅

EURUSD BEARISH BREAKOUT|SHORT|
✅EURUSD confirms a clean breakout below the key level, showing bearish continuation as price rejects premium pricing. Liquidity has been cleared above structure, and Smart Money targets the 1.1520 zone for rebalancing. Time Frame 6H.
SHORT🔥
✅Like and subscribe to never miss a new idea!✅

GBPNZD RISKY LONG|
✅GBPNZD is reacting from a clean demand level after liquidity grab below short-term lows. Price structure remains bullish, suggesting a possible continuation toward the 2.3200 target zone as Smart Money accumulates long positions. Time Frame 2H.
LONG🚀
✅Like and subscribe to never miss a new idea!✅

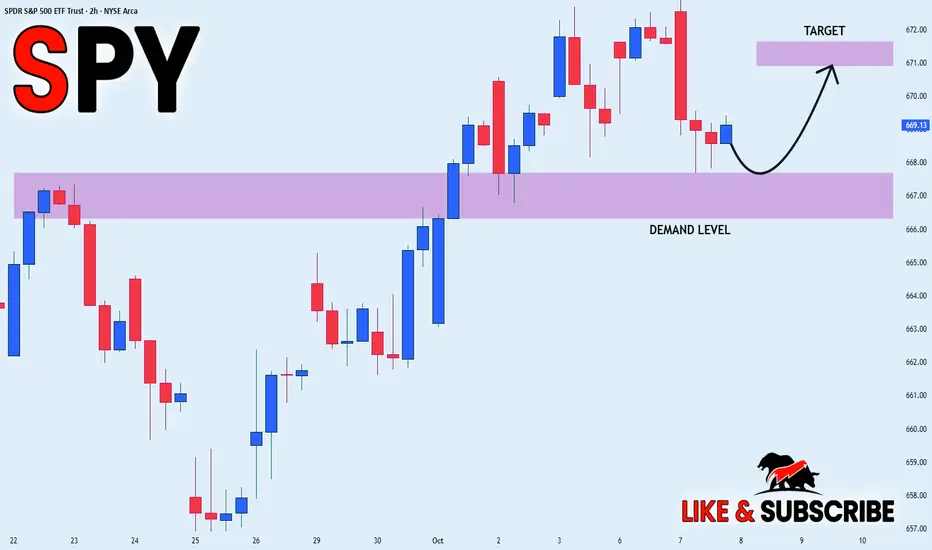
SPY STRONG UPTREND|LONG|
✅SPY showing a strong bullish structure with clear rejections from the demand level. Price continues to form higher lows, confirming institutional support and momentum toward the 671$ target zone. Time Frame 2H.
LONG🚀
✅Like and subscribe to never miss a new idea!✅
Gold battles within 3,860–3,900 Hello Goldies, ✨
Gold locks another bullish weekly close, extending its climb into high-altitude territory with barely a pause since mid-summer. The market now stands in a tactical battlefield — with buyers defending momentum while sellers quietly prepare to fade the top.
Gold’s broader structure remains clean and bullish, printing higher highs and higher lows since early 2024. However, price now trades deep inside the weekly supply belt (3,860–3,900) — a zone where liquidity historically transitions from accumulation to distribution.
Momentum stays firm, but upper-wick reactions and short-bodied closes hint at early exhaustion. The EMA stack (5–21–50) keeps control with the bulls, though the structure is primed for either a healthy pause or a short-term retracement before the next impulsive leg.
Macro & News Context 🌍
This week brings a USD-heavy calendar:
multiple FOMC speeches (Powell, Bowman, Barr, Kashkari), Unemployment Claims, and the all-important Non-Farm Payrolls (NFP) on Friday.
Soft U.S. data continues to weigh on the dollar, while gold benefits from falling yields and elevated geopolitical risk. However, a hot NFP print or hawkish tone from Powell could briefly lift the dollar and trigger a technical correction in gold.
Expect event-driven volatility — fast rotations as markets recalibrate expectations around future Fed rate cuts.
🟡 Weekly Gold Outlook – Bulls at Altitude, Momentum Fading
Bias: Bullish, but stretched
Key Weekly Zones:
🟥 Supply: 3,860 – 3,900 → Major resistance pocket; potential distribution area
⚪ Mid-Control: 3,700 – 3,740 → Tactical pivot; must hold for continuation
🟦 Demand: 3,440 – 3,480 → Structural re-test zone from prior breakout
🔼 Above 3,900 → Expansion toward 3,940–4,020
🔽 Below 3,700 → Correction toward 3,480
🔵 Daily Structure — Bullish but Hyper-Extended
Gold trades inside premium territory (3,875–3,905), where rejection tails and volume absorption reveal fading strength.
The 3,820–3,850 base remains the near-term lifeline — a break below it could trigger a 300–500 pip washout into lower demand layers.
Daily Zones:
🟥 Supply: 3,875–3,905 → Premium ceiling
🟦 Demand: 3,820–3,850 → Micro base | 3,720–3,750 → Immediate re-test
🔼 Above 3,905 → Extension toward 3,940–3,970
🔽 Below 3,750 → Correction phase confirmed
🟢 H4 Flow — Compression Before Expansion
Structure remains bullish but congested under 3,900.
Equal highs and tight-bodied candles signal compression — a volatility coil that will define this week’s direction.
H4 Zones:
🟥 3,880–3,900 → Immediate supply
🟦 3,820–3,840 → Short-term demand
🟦 3,760–3,780 → Re-test zone
🔼 Break above 3,900 → Targets 3,920–3,940, then 3,960–3,980
🔽 Break below 3,820 → Opens rotation to 3,760–3,780
🔸 H1 Tactical View — Decision Box Active
The 3,860–3,895 range forms this week’s tactical decision zone — a battleground between fading momentum and bullish control.
Bulls still hold structure, but exhaustion is visible; another failed breakout could trigger a deeper correction.
H1 Key Pivots:
🔼 3,885–3,895: Short-term cap → breakout unlocks 3,910–3,930
🔽 3,860–3,875: Near-term floor → break below opens pullback to 3,820–3,840
⚙️ Above 3,905 → Expansion
⚙️ Below 3,820 → Correction
⚙️ Between 3,860–3,895 → Compression zone — patience required
Summary
Gold remains structurally bullish but stretched at altitude.
The 3,860–3,895 pocket is the tactical decision belt — the level that will define whether the market expands into new highs or breathes out for a well-deserved correction.
🎯 Above 3,905 → Continuation
🩸 Below 3,820 → Correction
⚖️ Between → Compression until catalyst resolution (FOMC / NFP).
Disclaimer: For educational context only.

USOIL WILL GO DOWN|SHORT|
✅WTI OIL Price rejects supply after distribution and forms bearish orderflow, ICT suggests liquidity is being targeted below. Market likely seeks drawdown into 60.00 demand imbalance. Time Frame 4H.
SHORT🔥
✅Like and subscribe to never miss a new idea!✅

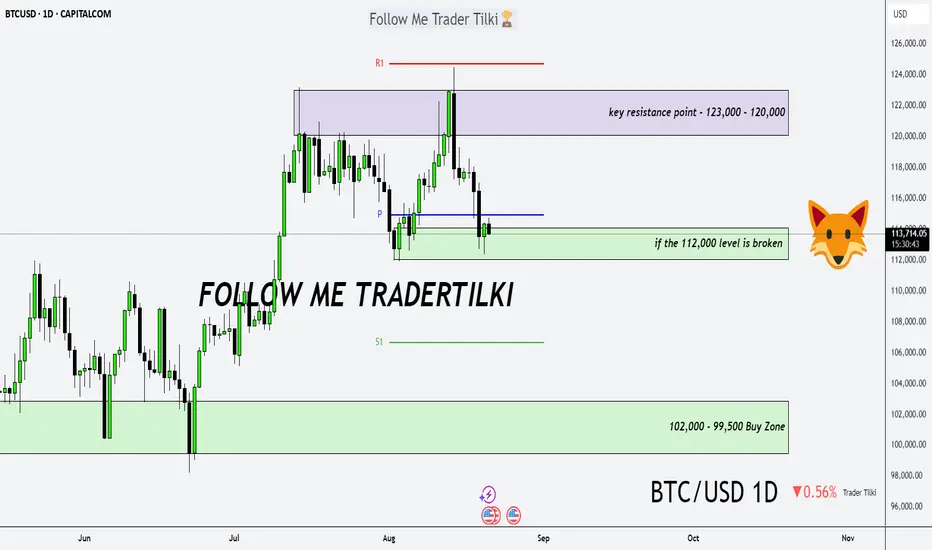
Bitcoin Daily Analysis – The Trend Is Our FriendGood morning, Guys,
I’ve prepared a fresh Bitcoin analysis for you.
🔹 First off, I stand firmly behind my long-term targets of **127,000 – 137,000 – 146,000**. I previously shared these levels with you in a weekly analysis.
🔍 Now let’s shift to the 1-day chart:
What is Bitcoin telling us right now?
📉 If the **112,000 level breaks downward**, we could enter a correction phase toward **102,000** or even **99,500**. I expect strong buying interest to return from those zones.
📈 After that, we’re facing a key resistance structure between **123,000 – 120,000**.
But I believe this zone will also be broken—because we’re in an **uptrend**, and…
💬 **The trend is our friend. Never forget that.**
EURUSD buy opportunity There is a current buying opportunity on the EURUSD to break the previous high and collect more liquidity and fill the large liquidity void resulting from the sharp drop that occurred on September 24th

USOIL STRONG DEMAND AREA|LONG|
✅WTI OIL price reacts at demand level, showing signs of absorption with liquidity grabs. ICT model points to bullish orderflow aiming for the nearby target zone. Time Frame: 4H.
LONG🚀
✅Like and subscribe to never miss a new idea!✅
