EUR_CAD WAIT FOR BREAKOUT|LONG|
✅EUR_CAD is trading in a
Strong uptrend and the pair
Has formed a range pattern
So IF we see a bullish breakout
We will be expecting a further
Bullish move up next week
LONG🚀
✅Like and subscribe to never miss a new idea!✅
SMC

EUR-AUD Local Short! Sell!
Hello,Traders!
EUR-AUD is trading in a
Downtrend and the pair
Made a bearish breakout
Of the key horizontal level
Of 1.7699 which is now
A resistance and the pair
Is now making a local
Correction but after the
Price retests the resistance
We will be expecting a
Further bearish move down
Sell!
Comment and subscribe to help us grow!
Check out other forecasts below too!
Disclosure: I am part of Trade Nation's Influencer program and receive a monthly fee for using their TradingView charts in my analysis.

AUD_USD WILL KEEP GROWING|LONG|
✅AUD_USD will soon make
A retest of the horizontal
Support level around 0.6620
And as the pair is trading in
An uptrend we will be expecting
Growth on Monday
LONG🚀
✅Like and subscribe to never miss a new idea!✅

EUR-USD Will Keep Growing! Buy!
Hello,Traders!
EUR-USD is trading along
The rising support line and
We are already seeing a bullish
Rebound from the support
So we think that the pair
Will keep growing on Monday
Buy!
Comment and subscribe to help us grow!
Check out other forecasts below too!
Disclosure: I am part of Trade Nation's Influencer program and receive a monthly fee for using their TradingView charts in my analysis.

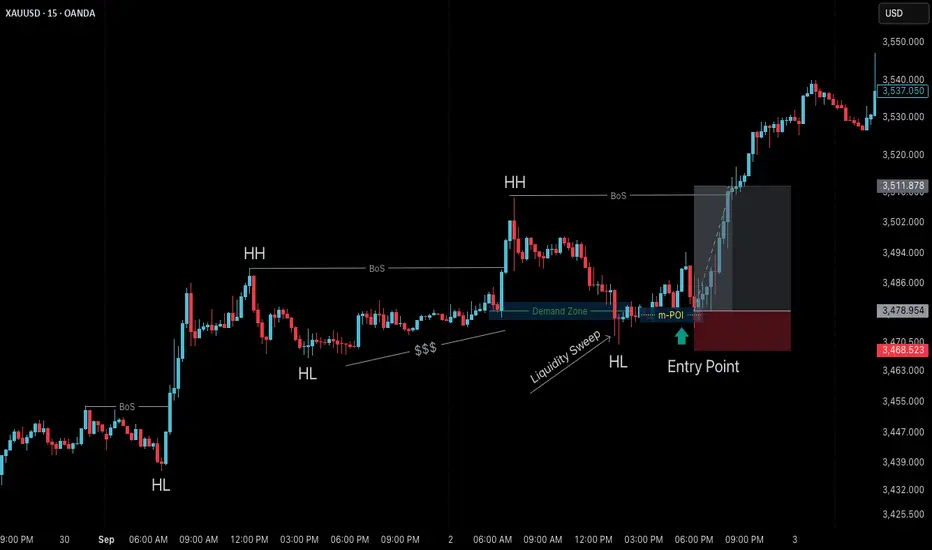
Sniper Entries Made Simple: The Power of Confirmation“Smart traders don’t predict.
They wait for the market to confirm their idea — then act.”
Finding a mitigation zone is only half the job.
Confirmation is what separates professional patience from random guessing.
It’s the step that keeps you from catching a falling knife or buying too soon.
Why Confirmation Matters
Jumping in blindly at the zone can work sometimes — but most of the time, it’s a gamble.
Confirmation gives you:
Higher probability setups (not every zone holds)
Tighter entries (better RR)
Fewer unnecessary stop-outs
The Confirmation Playbook
Here’s a simple process you can use.
Refer to the Gold M15 Bullish Chart (Sep 2, 2025) above — it shows this process step by step.
Step 1: Mark the Zone
Identify your mitigation block or demand zone after a BoS.
Step 2: Wait for Price to Tap
Be patient — let price react at this zone.
Step 3: Look for a Sweep
Notice how price often sweeps liquidity below the zone first — this fuels the reversal.
Step 4: Drop to Lower Timeframe (M1 or M5)
Watch for micro-structure shift in your favor:
micro-ChoCH
micro-BoS
Strong rejection wicks or engulfing candles
Step 5: Enter with Tight Risk
Take the trade after confirmation and set SL just beyond the sweep.
This gives you a small stop with a high RR potential.
Live Example (Gold)
In the XAUUSD bullish M15 chart above, you can see:
BoS creates a demand zone
Price returns and sweeps liquidity below demand zone
On lower timeframe, we get micro-ChoCH → micro-BoS confirmation
Entry is taken at micro-POI with tight SL, catching the next impulsive leg
Notice how confirmation turned a risky breakout buy into a sniper entry with a clean risk-reward profile.
📘 Shared by @ChartIsMirror
Do you already use confirmation techniques like ChoCH + BoS, or do you prefer instant entries at zones?
Share your experience in the comments — what’s your go-to trigger?
EUR_GBP WILL GROW|LONG|
✅EUR_GBP fell again to retest
The support of 0.8640
But it is a strong key level
So I think that there is a high chance
That we will see a bullish
Rebound and a move up
LONG🚀
✅Like and subscribe to never miss a new idea!✅

USD-CAD Bearish Bias! Sell!
Hello,Traders!
USD-CAD is making a
Retest of the horizontal
Resistance of 1.3863
So as we are locally
Bearish biased we will
Be expecting a further
Bearish move down
Sell!
Comment and subscribe to help us grow!
Check out other forecasts below too!
Disclosure: I am part of Trade Nation's Influencer program and receive a monthly fee for using their TradingView charts in my analysis.

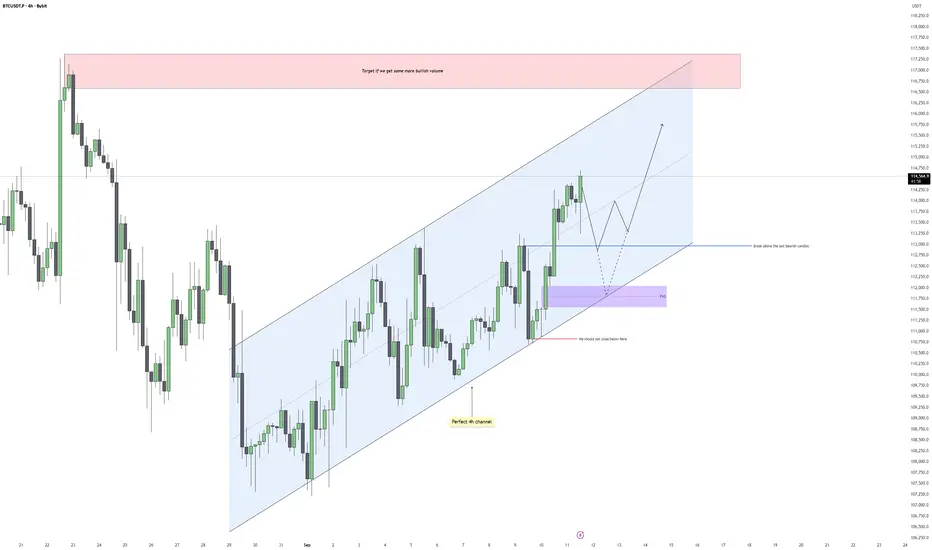
Bitcoin - Clearing the Gaps on the Way to 117kBitcoin continues to respect the ascending channel on the 4H chart, showing steady higher highs and higher lows with clean structure. Price has been climbing with solid bullish momentum, and each retracement so far has been contained within the channel. This gives us a clear framework to track both short-term pullbacks and the next potential leg higher.
Channel Dynamics
The channel is holding perfectly, with both the upper and lower bounds being respected almost to the point. As long as price trades within this structure, the bias remains bullish. A deep pullback into the lower side of the channel would not necessarily invalidate the setup, but we should avoid closing below the last key demand zone if we want to keep the bullish structure intact.
Fair Value Gaps Below
Before continuing higher, Bitcoin may dip back into inefficiencies left behind. A key fair value gap sits below around the 111,700–112,300 region, aligning with prior support. Price filling this gap would be healthy for the structure, giving bulls a better base to push from. If price respects that level, the probability of a continuation toward the channel highs increases significantly.
Bullish and Bearish Scenarios
On the bullish side, if we hold the demand zone and reclaim the blue structure line, price should attempt to sweep short-term highs and extend into the upper channel boundary. A clean break above would open the door to the red supply zone around 117,000–118,000. On the bearish side, any decisive close below the purple fair value gap would shift momentum and put pressure on the lower channel boundary, signaling weakness and invalidating the immediate bullish scenario.
Price Target and Expectations
If the structure continues to play out, I expect Bitcoin to first dip into the imbalance below, find support, then make another leg higher toward 116,500–118,000. This area is a logical liquidity pool where stops above recent highs are clustered, and also aligns with a major supply zone. That zone should be closely monitored for reactions and potential reversals.
Conclusion
Bitcoin remains in a constructive bullish channel, but gaps below need to be addressed before a push into higher liquidity levels. I will be looking for a retracement into the imbalance to set the stage for a continuation higher into the upper red supply zone. As long as we hold above the key demand region, the bullish play remains valid.
___________________________________
Thanks for your support!
If you found this idea helpful or learned something new, drop a like 👍 and leave a comment, I’d love to hear your thoughts! 🚀
GBP_AUD LOCAL SHORT|
✅GBP_AUD is trading in a
Downtrend and the pair
Is about to retest a horizontal
Resistance of 2.0450 from where
A bearish move down is
To be expected
SHORT🔥
✅Like and subscribe to never miss a new idea!✅

EUR-CHF Local Short! Sell!
Hello,Traders!
EUR-CHF made a retest
Of the horizontal resistance
Of 0.9354 and we are
Already seeing a bearish
Reaction so as we are
Bearish biased we will
Be expecting a further
Bearish move down
Sell!
Comment and subscribe to help us grow!
Check out other forecasts below too!
Disclosure: I am part of Trade Nation's Influencer program and receive a monthly fee for using their TradingView charts in my analysis.

TESLA BULLISH BREAKOUT|LONG|
✅TESLA is going up
Now and the stocks is trying to
Made a bullish breakout
Of the key horizontal
Level of 367.50$ and IF breakout
Is confirmed we will be expecting
A further bullish move up
LONG🚀
✅Like and subscribe to never miss a new idea!✅

AUD-USD Support Below! Buy!
Hello,Traders!
AUD-USD is trading in an
Uptrend and the pair is
Now making a local bearish
Correction to retest the
Horizontal support below
Around 0.6620 from where
We will be expecting a
Further bullish move up
Buy!
Comment and subscribe to help us grow!
Check out other forecasts below too!
Disclosure: I am part of Trade Nation's Influencer program and receive a monthly fee for using their TradingView charts in my analysis.

EURUSD Buy Signal after Tokyo has been sweepedAfter a sweep of liquidity for Tokyo, this level is expected to be protected, and the price will continue its upward trend to reach higher levels and break the previous peak. It is preferable to enter after the price declines and a 15-minute candle closes with a Wick as a rejection signal.

Institutional Demand: EUR/AUD longsHey,
This chart is looking good for a pullback play, the zone is broken but the 4-hour closed within our extended zone criteria, which makes the trade valid and the breakout fake.
Let's see how this plays out!
Kind regards,
Max Nieveld
@ mnieveld dm for questions.

Gold (XAUUSD) – Watch for Break or Rejection at Key Resistance Gold is trading around $3,641 per ounce, just shy of its recent highs and pressing resistance zones. Price action suggests we’re in a squeeze between strong resistance up top and support below, waiting for a clean breakout or pullback.
Possible Short / Long Trade Setup:
• Entry (Long): Consider going long if Gold breaks & closes above $3,655-$3,658 with good follow-through and buyer strength.
• Entry (Short): Could consider a short if price rejects that resistance zone ($3,655-$3,658) and shows bearish structure, with confirmation below ~$3,630.
Target Levels:
• 🎯 1st Target Long → $3,670+
• 🎯 1st Target Short → $3,620-$3,616
Invalidation / Risk Zones:
• A sustained close above $3,658 for long trades
• A break below $3,600 would weaken bullish bias and favor more downside
Please hit the like 👍 and comment 💬 to support my post!
Your engagement gets me to drop more setups like this.
Best Regards,
KeswanTrades 🕊️
Disclosure: This is educational only, not financial advice.
NAS still charging HighsEverything explained in video, please let me know if I may have missed any details!

GBP-USD Local Short! Sell!
Hello,Traders!
GBP-USD went up sharply
But the pair will soon hit
A strong horizontal resistance
Of 1.3595 so despite my
Mid-term bullish bias
I think that we will see
A local correction after
The resistance is hit
Sell!
Comment and subscribe to help us grow!
Check out other forecasts below too!
Disclosure: I am part of Trade Nation's Influencer program and receive a monthly fee for using their TradingView charts in my analysis.

NZD_JPY MOVE UP AHEAD|LONG|
✅NZD_JPY broke the key
Structure level of 87.760 while
Trading in an local uptrend
Which makes me bullish biased
And I think that after the retest
Of the broken level is complete
A rebound and bullish
Continuation will follow
LONG🚀
✅Like and subscribe to never miss a new idea!✅

US100 Strong Bullish Bias! Buy!
Hello,Traders!
US100 keep trading in
A strong uptrend and
The index is now trying
To breakout the key
Horizontal level of 23,940
So IF the breakout is
Confirmed we will be
Expecting a further
Bullish move up
Buy!
Comment and subscribe to help us grow!
Check out other forecasts below too!
Disclosure: I am part of Trade Nation's Influencer program and receive a monthly fee for using their TradingView charts in my analysis.

BITCOIN Growth Ahead! Buy!
Hello,Traders!
BITCOIN is going up now
And the coin made a bullish
Breakout of the key horizontal
Level of 113k$ so we are
Bullish biased and we will
Be expecting a further
Bullish move up
Buy!
Comment and subscribe to help us grow!
Check out other forecasts below too!
Disclosure: I am part of Trade Nation's Influencer program and receive a monthly fee for using their TradingView charts in my analysis.

AUD_CHF BULLISH BREAKOUT|LONG|
✅AUD_CHF is going up currently
And the pair broke the key structure level of 0.5290
Which is now a support, and after the pullback
And the retest, I think the price will go up
LONG🚀
✅Like and subscribe to never miss a new idea!✅
GBP-AUD Bearish Breakout! Sell!
Hello,Traders!
GBP-AUD is trading in a
Downtrend and the pair
Made a bearish breakout
Of the key horizontal
Level of 2.0449 so we are
Bearish biased now and
We will be expecting a
Bearish continuation
Sell!
Comment and subscribe to help us grow!
Check out other forecasts below too!
Disclosure: I am part of Trade Nation's Influencer program and receive a monthly fee for using their TradingView charts in my analysis.

This Aussie Tech Gem Is Screaming BUY – If This Zone Holds!SDR (SiteMinder) is showing massive potential both technically and fundamentally:
- Trading 75.4% below fair value
- Forecasted to grow 65.36% YoY
- Earnings up 28.2% p.a. over the last 5 years
- Analysts expect 91%+ upside
On the chart, we’re sitting right on a high-probability monthly FVG + OB zone. If respected, we could see a strong rally back toward the $6.90–$7.78 buyside liquidity levels and beyond.
Key Levels to Watch:
📍 FVG support: ~$3.50
📈 Targets: $6.90 – $7.78
🧠 Confirmation needed via strong candle closes
🔥 Could be a high-reward play — but as always, DYOR!
