GBPJPY | Institutional Sell Setup – D1 & W1 Sweeps AlignGBPJPY has completed a multi-timeframe liquidity sweep, with both W1 and D1 sweeps aligning inside a premium price zone.
The structure has shifted bearish following a clear CHOCH and a rejection from the FVG imbalance area, confirming potential downside continuation.
🔹 Execution Bias: Instant Sell
🔹 Entry Zone: 202.60–202.80
🔹 Stop-Loss: Above 203.40 (protected high)
🔹 Target: 199.00 (liquidity zone)
🔹 Bias: Bearish
Technical Breakdown:
• Weekly sweep confirms distribution.
• Daily sweep adds confluence of liquidity grab.
• CHOCH at discount confirms bearish intent.
• FVG + refined OB = smart-money entry zone.
• Targeting inefficiency and old liquidity lows.
SMC

SPY Free Signal! Sell!
Hello,Traders!
SPY Price taps the horizontal supply area and shows rejection, signaling potential distribution as liquidity thins above the zone. With bearish orderflow returning, a corrective move toward lower liquidity pockets is likely.
--------------------
Stop Loss: 675$
Take Profit: 667$
Entry Level: 672$
Time Frame: 2H
--------------------
Sell!
Comment and subscribe to help us grow!
Check out other forecasts below too!
Disclosure: I am part of Trade Nation's Influencer program and receive a monthly fee for using their TradingView charts in my analysis.

“Gold’s about to choose violence or victory — watch the map.”Hello Goldies,
Gold steps into the new week perched at the peak of an extraordinary rally. Last week’s candle left a strong rejection wick from premium territory — a clear sign of absorption and the first hint of exhaustion after weeks of near-vertical momentum. We’re now sitting at a pivotal weekly inflection point, where the next candle could set the tone for the rest of the month.
Macro & News Landscape
The USD-heavy calendar is loaded:
FOMC Minutes could reshape expectations around future policy easing
Labour & PMI data may sway short-term dollar flows
Geopolitical tensions continue to simmer, keeping volatility elevated
From a weekly standpoint, this mix creates prime conditions for a decisive move in either direction — making key structural levels more critical than ever.
Hello traders,
Gold steps into the new week perched at the peak of an extraordinary rally. Last week’s candle left a strong rejection wick from premium territory — a clear sign of absorption and the first hint of exhaustion after weeks of near-vertical momentum. We’re now sitting at a pivotal weekly inflection point, where the next candle could set the tone for the rest of the month.
Macro & News Landscape
The USD-heavy calendar is loaded:
FOMC Minutes could reshape expectations around future policy easing
Labor & PMI data may sway short-term dollar flows
Geopolitical tensions continue to simmer, keeping volatility elevated
From a weekly standpoint, this mix creates prime conditions for a decisive move in either direction — making key structural levels more critical than ever.
WEEKLY STRUCTURE — Macro Map
🟥 Premium Supply Layers
You’ve correctly mapped a three-tier premium distribution stack:
1️⃣ 4150–4300 (Upper Weekly Supply)
• The origin of last week’s rejection.
• 4150 = first upside draw
• 4300 = full delivery of the block
2️⃣ 4450–4600 (Mid-Premium Supply)
• Reactivates only after 4300 clears
• 4450 = next premium imbalance boundary
3️⃣ 4750–4900 (Extreme Premium Supply)
• The deepest untouched layer
• Only activates in a strong bullish continuation phase
🟦 Weekly Demand Layers
1️⃣ 3570–3720 (First Weekly Demand)
• Last valid W1 OB before bullish BOS
• 3720 = first downside target
• 3570 = full mitigation
2️⃣ 3200–3350 (Mid-Weekly Demand)
• Corrective consolidation base
• Next stop if 3570 breaks
3️⃣ 2670–2820 (Deep Weekly Demand)
• Long-term accumulation
• Not active unless multi-month unwinding begins
⚪ Weekly Decision Zone: 3950–4085
The key zone directly beneath price.
This determines whether gold returns to premium or unwinds the entire macro leg.
W1 Expectation Flow
BULLISH PATH
Hold above 4085 → reclaim 4150 → break 4300 → target 4450 → extend toward 4750.
BEARISH PATH
Lose 3950 → target 3720 → break exposes 3570 → fall through opens 3350 → 3200.
DAILY STRUCTURE — Short-Term Macro Pulse
Bias
Neutral → leaning bearish, due to:
• Strong rejection off ATH sweep
• Compression under resistance
• Short EMAs softening
• No bullish reversal structures on D1
Macro trend = bullish, but D1 = controlled correction.
🟥 Daily Supply Zones
1️⃣ 4180–4240 (First Ceiling)
2️⃣ 4360–4420 (ATH Sweep Supply)
3️⃣ 4470–4570 (Extension Supply)
These three create a layered ceiling above the Decision Zone.
🟦 Daily Demand Zones
1️⃣ 3850–3950 (First Demand)
2️⃣ 3600–3700 (Deep Daily Demand)
⚪ Daily Decision Zone: 4050–4100
Where gold is currently stalling.
Holding = bullish rotation
Losing = continuation deeper into discount.
D1 Expectation Flow
BULLISH
Hold 4050 → reclaim 4100 → 4180 → 4240 → sweep-zone 4360 → higher targets open.
BEARISH
Close below 4050 → target 3950 → lose it → 3600–3700 discount zone.
H4 STRUCTURE — Tactical Cycle
H4 Bias: Bullish Corrective
• 4380 → 3885 created the macro discounted base
• 3885 → 4245 formed the new bullish leg
• Current drop to ~4085 = mid-leg retracement (healthy)
Demand intact, supply unmitigated above.
🟥 H4 Supply
1️⃣ 4205–4240 (Primary)
2️⃣ 4345–4380 (ATH Rejection)
3️⃣ 4450–4480 (Premium Extension)
🟦 H4 Demand
1️⃣ 4005–4035 (Immediate)
2️⃣ 3890–3920 (Mid-Level Accumulation)
3️⃣ 3760–3790 (Deep Structural)
⚪ H4 Decision Zone: 4080–4110
Mid-range control.
Acceptance = upside
Rejection = continuation lower
🎯 First Upside Draw: 4120–4147 (H4 Imbalance)
A clean inefficiency, not supply.
H4 Expectation Flow
BULLISH
Defend 4005 → reclaim 4080–4110 → fill 4120–4147 → attack 4205–4240.
BEARISH
Reject 4080–4110 → fail 4070 → retest 4005 → break → 3890.
H1 STRUCTURE — Intraday Battle Map
Gold is compressing between local demand and the mid-range FVG.
Momentum undecided.
🟥 H1 Supply Above
4160–4175
4197–4211
4240–4255
Each level forms a staircase of intraday liquidity caps.
🟦 H1 Demand Below
4073–4087 (Continuation Base)
4027–4044 (Structural Support)
3986–4000 (Origin of the entire bullish leg)
⚪ H1 Decision Zone: 4118–4132
Intraday pivot.
Reclaim = bullish shift
Rejection = deeper pullback
H1 Expectation Flow
BULLISH
Defend 4073 → reclaim FVG → target 4160 → break → 4197.
BEARISH
Reject FVG → fall to 4027 → lose it → 3986 origin.
🌍 FULL SYSTEM SYNTHESIS — The Real Story
Gold is at a perfect confluence point:
Weekly → sitting on the macro W1 decision zone
Daily → trapped under multiple supply layers in a corrective leg
H4 → bullish structure but correcting into demand
H1 → compression waiting for breakout
All timeframes point to one master battleground:
⭐ 4080–4130
(W1 Decision Zone + D1 Decision Zone + H4 Decision Zone + H1 FVG)
This single zone will dictate the next 10–20 days of price delivery.
📌 Final Summary
If gold holds 4080–4050, it rotates back upward into premium.
If gold fails 4050–3950, deeper discount zones activate in sequence.

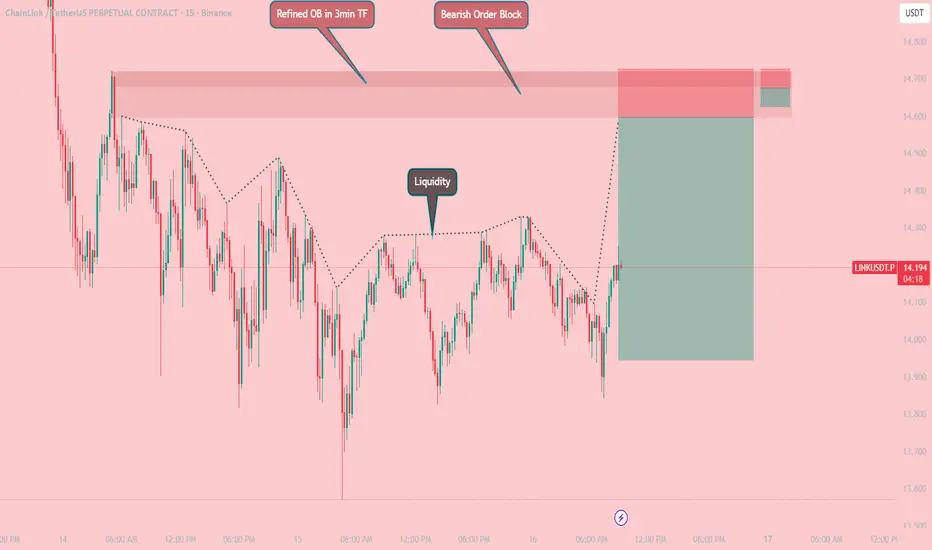
AVAXUSDT – Bearish Order Block + Liquidity Sweep Setup (SMC AnalMarket is clearly in a downtrend, continuously forming impulsive drops followed by corrective pullbacks. Price recently created Equal Highs and Equal Lows, which act as visible liquidity pools.
A Major Pullback Order Block is identified at:
Bearish OB (15m): 14.721 – 14.594
To improve precision and maximise probability, the OB is refined on the 3-minute timeframe to:
Refined OB (3m): 14.721 – 14.676
This refined zone aligns with a premium area of the range, making it a high-probability entry for a short setup. Price is expected to tap into the refined OB, sweep liquidity above equal highs, and then continue the downtrend.
📉 Trade Setup – SHORT
Entry: 14.676
Stop Loss: 14.726
Take Profit: 14.626
SPY FREE SIGNAL|SHORT|
✅SPY price rejects a major supply block after running buy-side liquidity, shifting intraday flow bearish. With displacement confirming downside intent, a draw toward the discount target zone is likely.
———————————
Entry: 671.95$
Stop Loss: 675.80$
Take Profit: 667.20$
Time Frame: 2H
———————————
SHORT🔥
✅Like and subscribe to never miss a new idea!✅

DXY LOCAL SHORT|
✅DXY rejects a premium-zone supply block, with intraday structure shifting bearish after collecting liquidity above recent highs. A drawdown toward the inefficiency below remains likely as momentum weakens. Time Frame 1H.
SHORT🔥
✅Like and subscribe to never miss a new idea!✅

CADCHF FREE SIGNAL|SHORT|
✅CADCHF price taps a clean supply block after an aggressive displacement lower, forming a premium-zone retracement ideal for continuation. Liquidity above minor highs has been harvested, favoring downside flow.
———————————
Entry: 0.56650
Stop Loss: 0.56740
Take Profit: 0.56480
Time Frame: 2H
———————————
SHORT🔥
✅Like and subscribe to never miss a new idea!✅

NZD-CHF Free Signals! Sell!
Hello,Traders!
NZDCHF taps into a clean horizontal supply after a displacement down, creating a corrective pullback into a premium zone where liquidity sits above minor highs. 3H setup favors continuation lower.
--------------------
Stop Loss: 0.45168
Take Profit: 0.45019
Entry Level: 0.45110
Time Frame: 3H
--------------------
Sell!
Comment and subscribe to help us grow!
Check out other forecasts below too!
Disclosure: I am part of Trade Nation's Influencer program and receive a monthly fee for using their TradingView charts in my analysis.

NZD-CAD Local Long! Buy!
Hello,Traders!
NZDCAD is reacting from a demand area after collecting liquidity below the equal lows, setting up a bullish continuation into the next premium target above. Time Frame 2H.
Buy!
Comment and subscribe to help us grow!
Check out other forecasts below too!
Disclosure: I am part of Trade Nation's Influencer program and receive a monthly fee for using their TradingView charts in my analysis.

EUR-USD Will Grow! Buy!
Hello,Traders!
EURUSD price is tapping into a clean demand zone after sweeping short-term liquidity, setting the stage for a bullish displacement toward the next premium target above. Time Frame 1H.
Buy!
Comment and subscribe to help us grow!
Check out other forecasts below too!
Disclosure: I am part of Trade Nation's Influencer program and receive a monthly fee for using their TradingView charts in my analysis.

Gold — Liquidity Delivered Into WCL BreakerGold just tapped its higher-timeframe C target , completing the previous bullish cycle and leaving behind a clean WCL on the pullback. That WCL is now the boundary where the next phase should begin.
On the lower timeframes, price has been forming a controlled micro-bearish sequence. The important detail is that this micro-wave is delivering its C target directly into the 5-minute breaker block that's sitting inside the HTF WCL.
That combination is rare and powerful:
Liquidity has already been swept beneath the WCL
Momentum into the breaker is corrective, not impulsive
The breaker + WCL overlap is a classic launch zone
The next logical magnet is a revisit of the previous C
If Gold reacts from this breaker, the structure supports a full bullish wave back toward that C — and if C breaks, the matryoshka continuation opens.
I’m watching this zone as the potential ignition point for the next leg up.
This is not financial advice.

Bitcoin - Is This Where The Pain Finally Ends?Bitcoin has been grinding lower for about a month after sweeping the previous all time high, which created the shift that kicked off this broader downtrend. Since that sweep, every push up has been met with selling, and the market has slowly bled its way back into a major support zone that has been significant in earlier cycles. This is the kind of level where the market usually makes a statement, either by holding and reversing or by breaking and opening the door to a deeper move.
Support Structure and Key Reaction Point
Price is sitting inside a wide support band that has given strong reactions in the past. It is a level traders know well and one that typically slows the market down. The difference this time is the structure leading into it. The downtrend has been consistent, with a string of lower highs showing that sellers remain in control for now. How the daily candle closes inside this zone will tell us a lot about whether buyers still have enough strength to defend it or if this level finally gives way.
Recent Liquidity Events and Daily Gap Behavior
Before dropping into this support, Bitcoin ran a recent daily high and instantly filled the gap above it, making it clear that the move was more about collecting liquidity than shifting the trend. After that, price slid lower again and retested the inside of the daily imbalance, but the retest failed to spark any meaningful demand. That kind of behavior often hints at a market that is still hunting lower levels rather than building upside structure.
Bullish Scenario
For sentiment to turn, Bitcoin needs to close back above the midline of this zone. That level is the one that would show buyers are actually stepping back in and absorbing the sell side. If the market can reclaim it, a short term reversal becomes possible, and the first targets would be the inefficiencies left behind during the recent selloff. From there, the market would still need to break a series of lower highs before a proper shift is confirmed on the daily timeframe.
Bearish Scenario
If the daily candle fails to close above that internal level highlighted on the chart, viewers should expect continuation lower to become the more probable scenario. A failed close there tells you buyers did not manage to hold the midpoint of the range, which usually means the market is preparing to reach for deeper liquidity. In that situation, the next major support zone below becomes the logical draw, and the path shown on the chart, a small bounce followed by another leg down, fits well with the current momentum.
Conclusion
Bitcoin is sitting at a decision point. Either this support zone does its job again and gives the market enough fuel for a recovery, or the daily close confirms that the level has weakened and the market is ready to reach for the next higher timeframe support. Until that close gives clarity, patience is key, since this is typically where traders get chopped if they try to force a direction too early.
___________________________________
Thanks for your support!
If you found this idea helpful or learned something new, drop a like 👍 and leave a comment, I’d love to hear your thoughts! 🚀

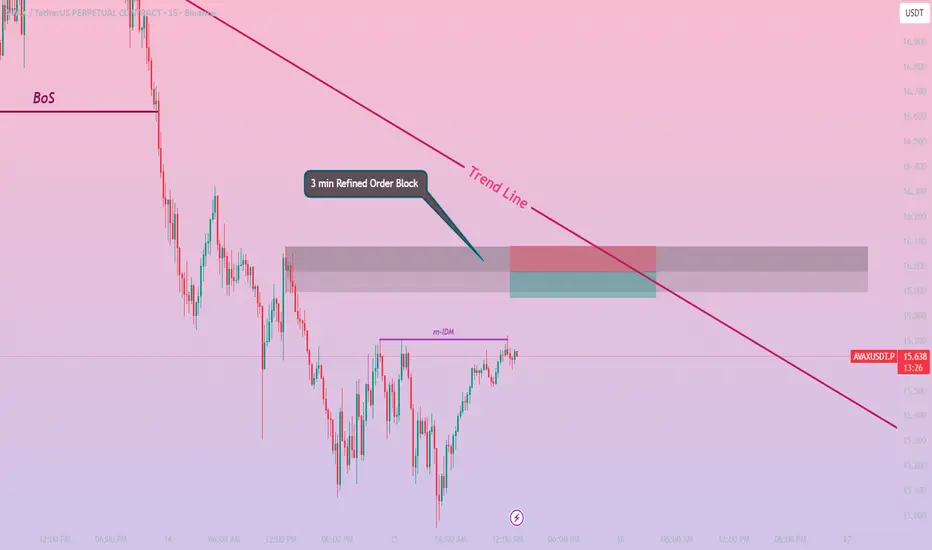
AVAXUSDT Analysis (SMC + Price Action)AVAX is clearly in a downtrend, creating clean impulsive and corrective legs. I marked the 15-minute OB along with a refined 3-minute OB.
The refined OB gives the highest probability setup, as it aligns perfectly with the overall bearish structure and the trendline.
Now we just wait to see how price reacts when it taps into that zone.
Trade setup
Entry: 15.977
Stop Loss: 16.080
Take Profit: 15.875
Risk–Reward: 1:1
I’ve used both SMC and price action to build this setup. Let’s see how it plays out.
XMRUSDT – Clean SMC + Price Action AnalysisXMRUSDT is clearly in an uptrend, and we already witnessed a strong Break of Structure (BOS). After the BOS, price pulled back into the imbalance (IDM) region, which gives us a high-probability setup in the direction of the trend.
The trendline support is holding well, and the market continues to respect higher highs and higher lows. As long as the IDM zone is protected, buyers remain in control.
Trade Setup
Entry: 391.17
Stop Loss: 483.60
Take Profit 1: 400.87 (1:1 RR)
Take Profit 2: 430.99 (4.5 RR)
I used Smart Money Concepts (SMC) combined with pure price action, and this setup has a higher probability of playing out in our direction if the entry gets triggered.
The overall structure, trendline support, and IDM sweep all align perfectly for a continuation move.

EURUSD BULLISH REBOUND|LONG|
✅EURUSD price is drawing back into the demand block, where internal liquidity sits below the short-term lows. A clean rebalance from this zone can fuel a continuation toward the next upside target. Time Frame 2H.
LONG🚀
✅Like and subscribe to never miss a new idea!✅

US100 Free Signal! Sell!
Hello,Traders!
US100 is reacting inside the horizontal supply, where bearish orderflow continues to cap every rally attempt. With liquidity sitting below the prior swing lows, price is positioned for a corrective push lower.
--------------------
Stop Loss: 25,210
Take Profit: 24,901
Entry Level: 25,048
Time Frame: 2H
--------------------
Sell!
Comment and subscribe to help us grow!
Check out other forecasts below too!
Disclosure: I am part of Trade Nation's Influencer program and receive a monthly fee for using their TradingView charts in my analysis.

Order Blocks Simplified — How Institutions Control Price🔥 Order Blocks Simplified — How Institutions Control Price
Order Blocks are one of the most important concepts in modern trading — because they show where institutions place REAL positions, not where retail traders guess. 🏦📊
When you understand Order Blocks, you stop chasing random candles and start reading the footprints of smart money. Let’s simplify it. 👇✨
📌 What Is an Order Block? 🧱💰
An Order Block (OB) is a price zone where big institutions (banks, hedge funds, market makers) place massive orders.
These zones often appear before strong market moves — because that’s where smart money builds positions.
Think of an Order Block as:
🔹 The origin of a powerful move
🔹 A zone where price reacts repeatedly
🔹 A region that creates imbalance and momentum
🔹 A point where institutional orders remain unfilled
Once price returns to that zone, institutions fill the rest of their orders, causing another strong reaction. ⚡📈📉
📌 Why Do Order Blocks Matter? 🧠🔥
Because institutions control 80%+ of market volume — not retail.
So when they accumulate or distribute positions:
📈 Trends are born
📉 Reversals appear
🌊 Momentum shifts
💥 Big candles print
Order Blocks give you insight into:
✔️ Where big players enter
✔️ Where real support/resistance exists
✔️ Why price reverses at specific zones
✔️ Where high-probability trades form
It’s the closest thing to tracking the “big money blueprint.”
📌 How Order Blocks Form 🛠️📊
Order Blocks are created during periods of:
🔸 Accumulation (smart money buys quietly)
🔸 Distribution (smart money sells quietly)
Then price explodes away from that zone, showing that a major order cluster was executed.
This explosive move creates:
🔥 Imbalance (FVG)
🔥 Break of structure (BOS)
🔥 A directional trend
These are all signs of institutional activity.
📌 Types of Order Blocks 🟥🟩
🟥 Bearish Order Block (B-OB)
The last bullish candle before a strong bearish move.
It marks institutional selling.
🟩 Bullish Order Block (B-OB)
The last bearish candle before a strong bullish move.
It marks institutional buying.
Both act as high-probability reaction zones.
📌 How Institutions Use Order Blocks 🎯🏦
Institutions don’t enter all at once — their orders are too large.
So they:
1️⃣ Place part of their order
2️⃣ Push price away
3️⃣ Wait for retracement
4️⃣ Fill the rest at the same zone
That zone = the Order Block.
Price returning to an OB is not random — it’s smart money completing their business. 💼✨
📌 How You Trade Order Blocks 🧘♂️📈
✔️ Identify the strong move
Big displacement = institutional interest. 🚀
✔️ Mark the Order Block candle
The last opposite candle before the move. 🔍
✔️ Wait for price to return
Smart money loves to rebalance orders. 🔁
✔️ Enter with confirmation
Candles + structure + reaction = high probability. 🎯
Order Blocks are not predictions — they are reaction zones with a smart-money edge.
📌 Why Order Blocks Work So Well 🌟
Because they are built on:
💧 Liquidity
🧠 Smart Money Behavior
📊 Market Structure
⚡ Supply & Demand
🔥 Institutional Order Flow
This is why OBs outperform classic support/resistance.
They show institutional reality, not retail imagination.
✨ Final Thoughts: The Power of Order Blocks 🚀
Once you learn Order Blocks, everything becomes clearer:
✔️ You know where big money enters
✔️ You know where to wait for price
✔️ You stop chasing bad trades
✔️ You trade WITH smart money
✔️ You catch cleaner, stronger moves
Order Blocks are the foundation of modern price action — simple, powerful, and deeply effective. 🔥📈
GOLD FREE SIGNAL|SHORT|
✅XAUUSD momentum shifted sharply after tapping the supply block, driving price into a clean displacement swing. With liquidity resting below, continuation toward the lower imbalance remains likely. Time Frame 1H.
—————————
Entry: 4084$
Stop Loss: 4110$
Take Profit: 4050$
Time Frame: 2H
—————————
SHORT🔥
✅Like and subscribe to never miss a new idea!✅

GOLD Local Short! Sell!
GOLD is sliding away from the horizontal supply zone, with bearish displacement hinting at continuation toward the next liquidity pocket below. Any minor pullback may simply serve as distribution before the markdown resumes. Time Frame 1H.
Sell!
Comment and subscribe to help us grow!
Check out other forecasts below too!
Disclosure: I am part of Trade Nation's Influencer program and receive a monthly fee for using their TradingView charts in my analysis.

NZDCAD WILL KEEP GROWIING|LONG|
✅NZDCAD rebounded from a strong demand level, signaling possible continuation toward the liquidity pocket above 0.7980. A retracement into fair value gap could offer optimal entry. Time Frame 3H.
LONG🚀
✅Like and subscribe to never miss a new idea!✅

EUR-GBP Will Keep Growing! Buy!
Hello,Traders!
EURGBP is retesting a horizontal demand area, aligning with premium–discount dynamics. If the level holds, bullish delivery could target liquidity resting above 0.8850. Time Frame 4H.
Buy!
Comment and subscribe to help us grow!
Check out other forecasts below too!
Disclosure: I am part of Trade Nation's Influencer program and receive a monthly fee for using their TradingView charts in my analysis.

XAU/USD 14 November 2025 Intraday AnalysisH4 Analysis:
-> Swing: Bullish.
-> Internal: Bullish.
Analysis and bias remains the same as analysis dated 20 October 2025.
Price has printed as per previous intraday expectation by printing a bearish CHoCH which indicates, but not confirms, bullish pullback phase initiation.
Price is currently trading within an established internal range, however, I will continue to monitor price with regards to depth of pullback.
Intraday expectation:
Price to continue bearish, react at either discount of 50% internal EQ, or H4 supply zone before targeting weak internal high priced at 4,380.990.
Note:
The Federal Reserve’s sustained dovish stance, coupled with ongoing geopolitical uncertainties, is likely to prolong heightened volatility in the gold market. Given this elevated risk environment, traders should exercise caution and recalibrate risk management strategies to navigate potential price fluctuations effectively.
Additionally, gold pricing remains sensitive to broader macroeconomic developments, including policy decisions under President Trump. Shifts in geopolitical strategy and economic directives could further amplify uncertainty, contributing to market repricing dynamics.
H4 Chart:
M15 Analysis:
-> Swing: Bullish.
-> Internal: Bullish.
As per yesterday's analysis, price has printed a bearish CHoCH to indicate, but not confirm bearish pullback phase initiation.
Price is currently trading within an established internal range.
Intraday expectation:
Price to trade down to either discount of 50% internal EQ, or M15 demand zone before targeting weak internal high, priced at 4,245.195
Note:
Gold remains highly volatile amid the Federal Reserve's continued dovish stance, persistent and escalating geopolitical uncertainties. Traders should implement robust risk management strategies and remain vigilant, as price swings may become more pronounced in this elevated volatility environment.
Additionally, President Trump’s tariff announcements, particularly against China, are expected to further amplify market turbulence, potentially triggering sharp price fluctuations and whipsaws.
M15 Chart:

XAUUSD 14 Nov – Bullish ContinuationGold is likely to move lower toward the 4139.97 level, where a potential rebound may occur. There is an inducement positioned just before this level, which increases the probability of a liquidity sweep before buyers step in.
Once this liquidity is taken, gold may resume its overall bullish trend and continue pushing higher.
