US100 Risky Short! Sell!
Hello,Traders!
US100 made a sharp
Move up and made a
Retest of the horizontal
Resistance of 23,375
From where we will be
Expecting a local bearish
Correction and a move down
Sell!
Comment and subscribe to help us grow!
Check out other forecasts below too!
Disclosure: I am part of Trade Nation's Influencer program and receive a monthly fee for using their TradingView charts in my analysis.
SMC

GBP_JPY BULLISH BIAS|LONG|
✅GBP_JPY is set to retest a
Strong support level below
At 197.900 after trading in a local
Downtrend for some time
Which makes a bullish rebound
A likely scenario with the target
Being a local resistance
Above at 199.100
LONG🚀
✅Like and subscribe to never miss a new idea!✅

EUR-JPY Local Long! Buy!
Hello,Traders!
EUR-JPY made a retest
Of the horizontal support
Of 172.700 and as we
Are locally bullish biased
We will be expecting a
Further bullish move up
Buy!
Comment and subscribe to help us grow!
Check out other forecasts below too!
Disclosure: I am part of Trade Nation's Influencer program and receive a monthly fee for using their TradingView charts in my analysis.

EURUSD | TRADING PLAN | DAY 28🔵 Demand Zone (Buyers’ Area):
1.1623 – 1.1580
Price has completed an ABC corrective structure and is now entering the demand zone.
Expectation: Buyers to step in and push the price higher.
🔴 Supply Zones (Targets):
1. 1.1658 – 1.1688 → First supply zone, ideal for partial profit-taking.
2. 1.1705 – 1.1720 → Major supply zone, where strong sellers may re-enter.
📌 Trade Idea:
Look for bullish confirmation (reversal candle / liquidity sweep) inside the demand zone.
Entry: 1.1625 – 1.1600 (within demand zone).
Stop Loss: Below 1.1573 (protected low).
Take Profit 1: 1.1658
Take Profit 2: 1.1688 – 1.1720
⚖️ Risk–Reward Ratio (RRR):
Approx. 1:3 to 1:4 depending on entry execution.
---
✅ This plan is valid as long as price holds above 1.1573.
📌 Discipline with SL & partial profits is key.

DXY - OTE + SD Long TradeThis was my trade in TVC:DXY
This is the example of an absolute perfect entry and exit.
Entry at Optimal Trade Entry (OTE) level 0.5 .
Stoploss below swing low.
Exit half lots at Standard Deviation TP 1 and rest of the lots at Standard Deviation TP 2.
They say the perfect trade doesn't exist. But here is something to change your mind :)
Share your thoughts and analysis in the comments! I'd love to learn more.

Good bullish signal in EURUSDIf the EURUSD breaks the 1.16558 level, there will be a strong buying opportunity because it bounced from a strong OB area that will push it to cover the liquidity void, This liquidity void consists of more than 80 Bearish pips.

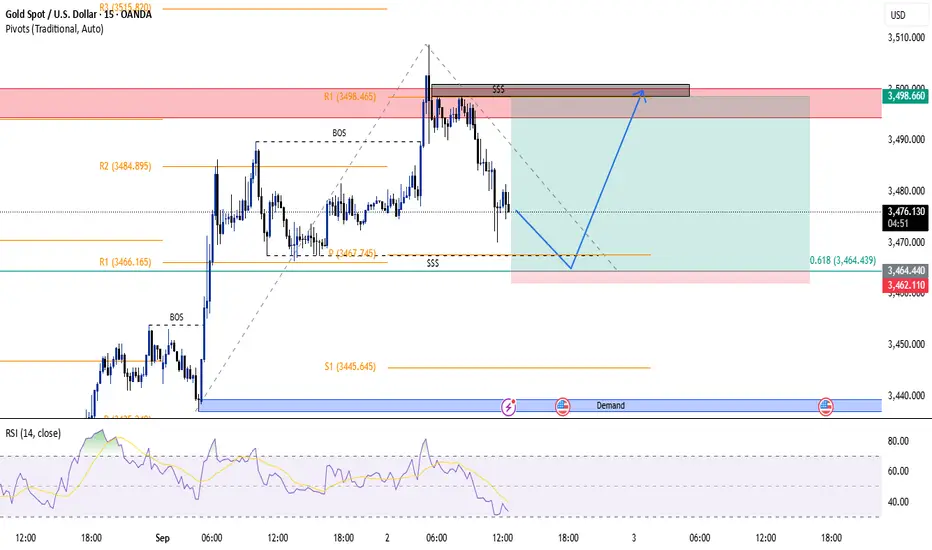
Gold Analysis – 15-Minute Timeframe (September 2, 2025)Based on a combination of my personal intuition and Smart Money Concepts (SMC), I expect the price to touch 3464 and then move upward.
✅ Reasons for this scenario:
Presence of a standard pivot around the 3464 level, which may act as a key support or resistance.
Liquidity buildup in that area, increasing the likelihood of inducement, which could fuel the upward move.
The magic Fibonacci ratio of 0.618 aligns perfectly with the last swing move, adding confluence to the setup.
📌 Entry Strategy: I plan to enter a long position upon spotting a rejection candle on the 1-minute timeframe.
Good luck and stay profitable
XAUUSD Monthly Technical OutlookMarket Structure Overview:
• The chart reveals consistent Breaks of Structure (BOS) to the upside, confirming a strong bullish market trend.
• Price has successfully reclaimed and retested the strong resistance zone (~3390–3400), which now acts as new support.
• A series of higher highs and higher lows show clear bullish intent, supported by sustained bullish momentum after each correction.
⸻
📈 Volume & Price Action:
• The Volume Profile (VRVP) on the left shows strong historical accumulation near the current breakout zone.
• After the breakout from resistance, the price retested this zone—validating it as support—and is expected to continue its bullish leg toward $3,500, the next psychological and technical target.
⸻
📍 Key Levels:
• Support Zone: $3,375 – $3,390 (previous resistance turned support)
• Immediate Resistance: $3,425
• Target Level: $3,500 (Monthly High Projection)
⸻
📘 Educational Note:
• This setup aligns with classic market structure theory: BOS + Retest + Continuation.
• The pullback into the breakout zone is a textbook bullish continuation signal often used in institutional trading strategies.
• Traders watching this pattern should combine it with confirmation entries such as bullish engulfing candles, FVGs, or order block rejections for safer entries.
⸻
🎯 Projection:
• As long as the price holds above $3,375, the bullish scenario toward $3,500 remains valid.
• Expect possible consolidation or minor pullbacks before continuation.
⸻
📌 Disclaimer:
This analysis is for educational purposes only and does not constitute financial advice. Always do your own research before entering the market.

"Gold’s Critical Bounce Zone – Is $3,400 the Next Magnet Level?""Gold’s Critical Bounce Zone – Is $3,400 the Next Magnet Level?"
📊 XAUUSD is showing a textbook bullish structure setup after forming a Higher Low right above strong support at $3,339. Price is now trading inside the Entry Zone ($3,348 – $3,339), an area that aligns with:
✅ Order Block Support
✅ Previous Break of Structure (BOS)
✅ Smart Money Fair Value Gap (FVG) retest
🧐 Market Structure Insight
Recent BOS flipped bias to bullish after buyers pushed through prior resistance.
A bullish FVG from earlier in the trend still holds influence, attracting price back for a healthy retest.
The current Higher Low shows buyers stepping in early, maintaining upward momentum.
Strong resistance is located at $3,400 – $3,440, which also acts as a psychological magnet for traders.
🎯 Trade Plan (Educational Example)
Entry Zone: 3,348 – 3,339 📍
Stop Loss: below 3,339 🛑
Target 1: 3,380 🎯 (partial profits)
Target 2: 3,400 ⭐ (main target)
Extended Target: 3,420 – 3,440 💎
📈 Reward to Risk: ~1.6R to the main target, with potential 2.9R to extended resistance if momentum accelerates.

SPY LONG FROM RISING SUPPORT|
✅SPY is trading in an uptrend
Along the rising support line
Which makes me bullish biased
And the index is about to retest the rising support
Thus, a rebound and a move up is expected
With the target of retesting the level above at 650$
LONG🚀
✅Like and subscribe to never miss a new idea!✅

GOLD Expecting Local Correction! Sell!
Hello,Traders!
GOLD has almost reached
A massive horizontal
Resistance of 3500$ which
Is also an ATH level and Gold
Is locally oversold so despite
Our long-term bullish bias
A correction from the
Resistance is likely
Sell!
Comment and subscribe to help us grow!
Check out other forecasts below too!
Disclosure: I am part of Trade Nation's Influencer program and receive a monthly fee for using their TradingView charts in my analysis.

AUD_CAD RESISTANCE AHEAD|SHORT|
✅AUD_CAD has been growing recently
And the pair seems locally overbought
So as the pair is approaching
A horizontal resistance of 0.9030
Price decline is to be expected
SHORT🔥
✅Like and subscribe to never miss a new idea!✅

GBP-CAD Resistance Ahead! Sell!
Hello,Traders!
GBP-CAD is growing nicely
But a strong horizontal
Resistance is ahead
At 1.8650 so after the
Retest we will be expecting
A local bearish correction
Sell!
Comment and subscribe to help us grow!
Check out other forecasts below too!
Disclosure: I am part of Trade Nation's Influencer program and receive a monthly fee for using their TradingView charts in my analysis.

GOLD ALL TIME HIGH|SHORT|
✅GOLD keeps growing in
An EPIC uptrend and the price
Nearly reached the ATH of 3500$
Which I am sure will be broken
Soon, however we can't be expecting
An immediate breakout so I think
We will see a local bearish
Correction from the ATH
SHORT🔥
✅Like and subscribe to never miss a new idea!✅

EUR-CAD Will Go UP! Buy!
Hello,Traders!
EUR-CAD is trading in a
Local uptrend and the pair
Made a local correction
But will soon retest a
Horizontal support of 1.608
From where we will be expecting
A further move up as we
Are locally bullish biased
Buy!
Comment and subscribe to help us grow!
Check out other forecasts below too!
Disclosure: I am part of Trade Nation's Influencer program and receive a monthly fee for using their TradingView charts in my analysis.

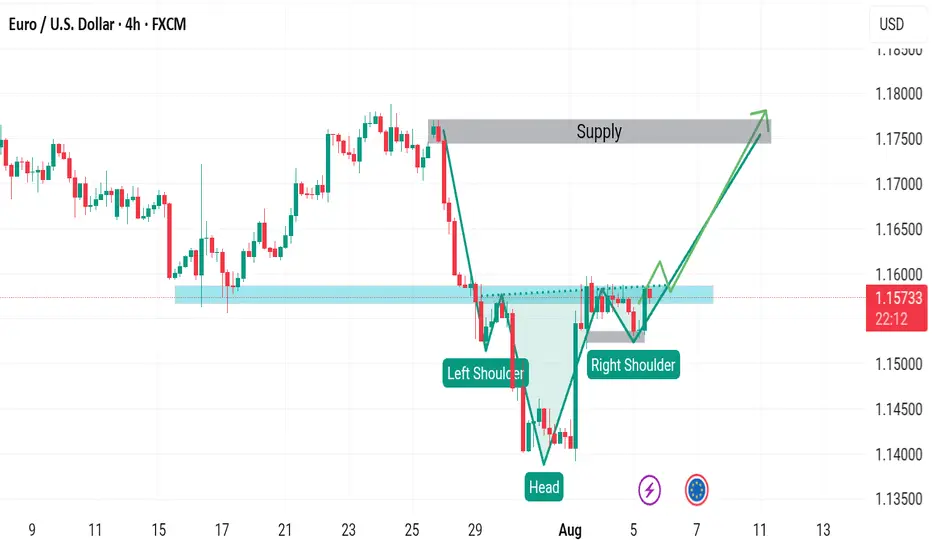
EURUSD BUY SETUPThe price will form a head and shoulders pattern because the candle in the second shoulder is very strong, which indicates that it will break the neck of the pattern. We also have a stronger bounce from below, so I expect an uptrend.
DXY | 1SPT directional sentiment (SMC)“DXY moving like it just clocked in for a Monday shift 🥱📉… got smacked with that Friday LQC and now stumbling down to 97.100 like it’s chasing a Black Friday discount 🛒. Daily bias still bearish, 4H looking weak, and on the 1H the bulls tryna flex but only after sweeping some liquidity 🐂➡️🚪.
If price taps back into that chef’s POI kitchen 🍳 and fails to hold, the bears finna drag this straight to the basement 📉🐻. Until then, we vibin’ in discount land waiting for confirmation signals. This POI remains the make-or-break zone 🧩 heading into the next sessions.”**

XAU 90% Chance of hitting ALL TIME HIGHS?!Please let me know what you think. If I missed any details that may be important please let me know.
This is my way of giving back while getting other's opinions.
Thanks 🙏🏾

Can ETH make it out of this clearly defined correction range?
Excuse my mic quality, my Airpods highjacked my audio 🥹
If you can still understand what I'm saying, please let me know if I missed anything and what you think about this range. Thanks 🫡

XAUUSD 30M – Intraday Plan Around the RangePrice is holding between $3,417.84 (resistance) and $3,403.41 (support). We’re trading around $3,410–$3,411 inside a tight box. Scalps can work, but reversals are quick.
🔼 Bullish Plan (needs confirmation)
Trigger: A clean 30min body close above $3,417.84 (not just a wick).
Targets: $3,419.55 → $3,420.54 → $3,422.10.
Management: Take partials at $3,419.55, move SL to breakeven once $3,418 holds on a retest.
🔽 Bearish Plan (cleaner below support)
Trigger: 30min body close below $3,403.41.
Targets: $3,401.29 → $3,398.36 (trail if sellers stay in control).
Management: Scale partials at $3,401.29, protect the rest at breakeven.
🔄 Range Scalp (higher risk, small size)
Shorts: $3,416–$3,417 on a clear rejection → aim $3,410–$3,412, SL above rejection high / $3,420.
Longs: $3,403–$3,404 on a strong rejection wick → aim mid-range, SL below $3,401.
✅ Break Confirmation
Strong 30min close through the level.
❌ Invalidation
Breakout closes back inside the box on the next candle (trap).
Multiple wick with no momentum.
📌 Bottom Line
Above $3,417.84 → bullish bias to $3,420.54 and $3,422.10.
Below $3,403.41 → bearish bias to $3,401.29 and $3,398.36.
Inside the box = scalp only, keep risk tight.

EUR_GBP RISKY LONG|
✅EUR_GBP is going down to retest
A horizontal support of 0.8647
Which makes me locally bullish biased
And I think that we will see a rebound
And a move up from the level
Towards the target above at 0.8658
LONG🚀
✅Like and subscribe to never miss a new idea!✅

BITCOIN Bearish Breakout! Sell!
Hello,Traders!
BITCOIN is going down
Now and the coin made
A bearish breakout of the
Key horizontal level
Of 110k$ so we are locally
Bearish biased and we
Will be expecting a
Further bearish move down
Sell!
Comment and subscribe to help us grow!
Check out other forecasts below too!
Disclosure: I am part of Trade Nation's Influencer program and receive a monthly fee for using their TradingView charts in my analysis.

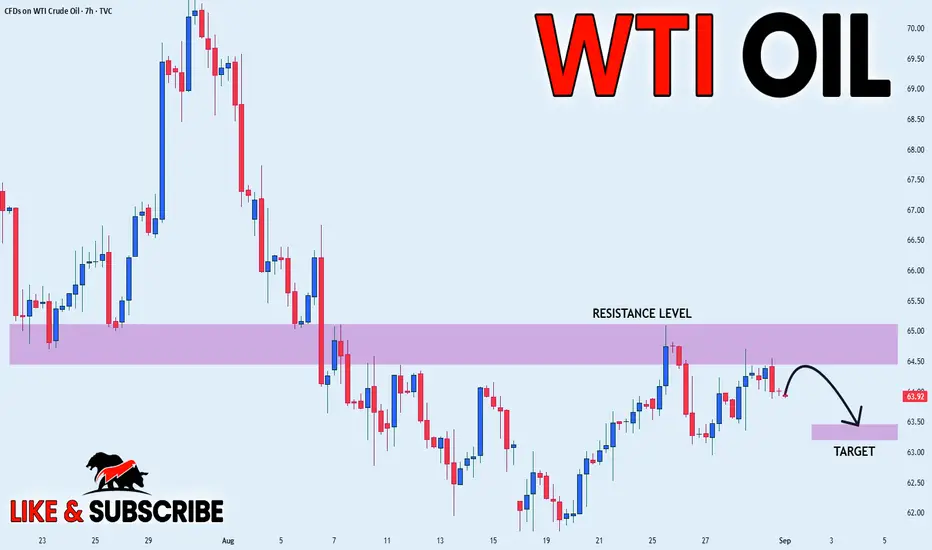
CRUDE OIL WILL FALL|SHORT|
✅CRUDE OIL price went up
Sharply but a strong resistance
Level was hit at 65.00$
Thus, as a pullback is
Already happening
And a move down towards
The target of 63.50$shall follow
SHORT🔥
✅Like and subscribe to never miss a new idea!✅