$EURUSD 15m Mark-UpOANDA:EURUSD
August 15
Analysis Notes:
After the nearly 100 Pip drop we captured on EURUSD, price has reacted to the 4H zone, bounced from the decision demand, and is now heading towards the 15-minute swing. It will likely move up to 50% of the 4H supply zone.
Follow us to never miss more analyses.
SMC

EURUSD - Moving towards the upper boundary in the rising channelSince reaching its recent low on August 1st, EUR/USD has been moving within a clear and consistent rising channel on the 4-hour chart. This upward structure has been well respected, with price action repeatedly reacting to both the upper resistance and lower support boundaries. The overall trajectory suggests that buyers have been steadily in control, but current market positioning shows the pair approaching a significant area that could determine the next directional move.
Rising channel
On the 4-hour timeframe, EUR/USD continues to trade inside this well-defined rising channel, with the slope indicating a healthy bullish trend. The price has been making higher highs and higher lows, consistently respecting the boundaries of the channel. At present, EUR/USD is hovering near the midline of this structure, which often acts as a pivot area where momentum can either accelerate toward the channel top or retrace toward its base.
4H FVG resistance
Currently, EUR/USD is facing a strong 4-hour Fair Value Gap (FVG) resistance zone, positioned around the 1.1720–1.1750 region. This supply area is from a sharp sell-off from late July and may act as a significant hurdle for buyers. If this resistance holds, price could be pushed back down toward the lower boundary of the rising channel, possibly testing the 1.1620–1.1650 area. However, if EUR/USD manages to decisively break above this 4H FVG, it would open the door for a continuation toward the upper channel trendline, which currently lies near the 1.1850 level.
Bullish support on the rising channel
Should the 4H bearish FVG remain unbroken, the lower boundary of the rising channel becomes an important support to watch. A pullback toward this zone could provide buyers with a favorable opportunity to re-enter the market. A strong bounce from this support would reinforce the bullish structure and potentially set the stage for another attempt to breach the resistance area, with the aim of resuming the climb toward the channel’s upper limits.
Final thoughts
EUR/USD is in a critical position within its well-structured rising channel. The outcome at the current 4H FVG resistance will likely dictate the next swing. A break above could fuel a run toward the upper channel boundary near 1.1850, while rejection here may see a retracement to the lower channel support before another push higher.
-------------------------
Disclosure: I am part of Trade Nation's Influencer program and receive a monthly fee for using their TradingView charts in my analysis.
Thanks for your support. If you enjoyed this analysis, make sure to follow me so you don't miss the next one. And if you found it helpful, feel free to drop a like 👍 and leave a comment 💬, I’d love to hear your thoughts!

CRUDE OIL Short From Resistance! Sell!
Hello,Traders!
CRUDE OIL is making a
Pullback and will soon hit
A horizontal resistance
Of 64.50$ and as we are
Bearish biased and we will
Be expecting a local
Bearish pullback
Sell!
Comment and subscribe to help us grow!
Check out other forecasts below too!
Disclosure: I am part of Trade Nation's Influencer program and receive a monthly fee for using their TradingView charts in my analysis.

GOLD WILL GO UP|LONG|
✅GOLD made a retest
Of the horizontal support
Of 3,330$ and we are already
Seeing a bullish rebound
So we will be expecting
A further bullish move up
LONG🚀
✅Like and subscribe to never miss a new idea!✅

AUD-CHF Bearish Breakout! Sell!
Hello,Traders!
AUD-CHF made a bearish
Breakout of the key horizontal
Level of 0.5257 which is now
A resistance and the breakout
Is confirmed so we are bearish
Biased and we will be expecting
A further bearish move down
Sell!
Comment and subscribe to help us grow!
Check out other forecasts below too!
Disclosure: I am part of Trade Nation's Influencer program and receive a monthly fee for using their TradingView charts in my analysis.

AUD_NZD POTENTIAL SHORT|
✅AUD_NZD is going up now
But a strong resistance level is ahead at 1.0990
Thus I am expecting a pullback
And a move down towards the target of 1.0966
SHORT🔥
✅Like and subscribe to never miss a new idea!✅

EUR-CAD Rising Support! Buy!
Hello,Traders!
EUR-CAD is trading along
The rising support line
And as the pair made a
Retest of the line and
We are already seeing a
Bullish rebound we will
Be expecting further growth
Buy!
Comment and subscribe to help us grow!
Check out other forecasts below too!
Disclosure: I am part of Trade Nation's Influencer program and receive a monthly fee for using their TradingView charts in my analysis.

AUD_USD LONG FROM SUPPORT|
✅AUD_USD has retested a key support level of 0.6485
And as the pair is already making a bullish rebound
A move up to retest the supply level above at 0.6506 is likely
LONG🚀
✅Like and subscribe to never miss a new idea!✅

EUR-USD Local Long! Buy!
Hello,Traders!
EUR-USD went down sharply
Just as I predicted in my
Previous analysis but the
Pair has now retested
A rising support from where
We are already seeing a
Bullish rebound and we will
Be expecting a further
Bullish move up
Buy!
Comment and subscribe to help us grow!
Check out other forecasts below too!
Disclosure: I am part of Trade Nation's Influencer program and receive a monthly fee for using their TradingView charts in my analysis.

NZDUSD BOY BUY SETUPWHEN PRICE break 0.5957 will be sronge signal for buying
but break 0.5954 you will should wait on price 0.5919

EURUSD – Climbing for Liquidity, Then What?EURUSD continues to move within a well-defined ascending channel, respecting both the upper and lower trendlines. After the recent rejection from the lower boundary, price found support inside a fair value gap, triggering a strong bullish reaction. This bounce has maintained the overall bullish structure, keeping the uptrend intact for now.
Fair Value Gap Retest
The fair value gap retest provided a clean entry for buyers, confirming demand at that level. This reaction reinforced the idea that liquidity was likely collected from the lows, giving the market fuel to push higher toward key resistance levels.
Short-Term Bullish Path
From here, price is approaching a major liquidity area above recent highs. This level may act as a magnet, drawing price upward for a sweep of buy-side liquidity. A continuation beyond that could result in a direct test of the upper trendline.
Potential Bearish Reversal Setup
If the upper boundary of the channel is reached, the reaction there will be critical. A sharp rejection from that area could trigger a deeper retracement, potentially driving price back toward the mid-range or even retesting the lower trendline. A liquidity sweep followed by bearish displacement would confirm this shift.
Key Scenarios Ahead
There are two primary outcomes to watch. First, price could sweep the current high and reverse lower, respecting the channel structure. Second, price could break through, reach the upper trendline, and then roll over for a larger corrective move. In both cases, the reaction after liquidity is taken will define the next directional leg.
Conclusion
At this stage, EURUSD is in a controlled uptrend, but the next high-probability move depends on how price behaves around the key liquidity level above. The plan is to monitor for either a sweep and rejection or a push to the upper trendline for a potential reversal.
Disclosure: I am part of Trade Nation's Influencer program and receive a monthly fee for using their TradingView charts in my analysis.
___________________________________
Thanks for your support!
If you found this idea helpful or learned something new, drop a like 👍 and leave a comment, I’d love to hear your thoughts! 🚀

AUD-USD Will Go UP! Buy!
Hello,Traders!
AUD-USD is making a retest
Of the horizontal support
Of 0.6540 and as we are
Bullish biased we will be
Expecting a local bullish
Move up
Buy!
Comment and subscribe to help us grow!
Check out other forecasts below too!
Disclosure: I am part of Trade Nation's Influencer program and receive a monthly fee for using their TradingView charts in my analysis.

NZD_USD RETSTING SUPPORT|LONG|
✅NZD_USD is trading in an
Uptrend and the pair is making
A retest of the horizontal
Support of 0.5970 from
Where we will be expecting
A further move up as we
Are bullish biased
LONG🚀
✅Like and subscribe to never miss a new idea!✅

EUR-USD Risky Short! Sell!
Hello,Traders!
EUR-USD went up sharply
But then hit a horizontal
Resistance of 1.1731
From where we are already
Seeing a local bearish reaction
And we will be expecting
A further bearish move down
Sell!
Comment and subscribe to help us grow!
Check out other forecasts below too!
Disclosure: I am part of Trade Nation's Influencer program and receive a monthly fee for using their TradingView charts in my analysis.

Gold Eyes Short-Term Pullback Before Key Support Test"Gold Eyes Short-Term Pullback Before Key Support Test 🏆📉"
Market Structure
The chart shows a clear range-bound price action between the strong support near 3,303 – 3,316 and the resistance zone around 3,420 – 3,440.
Multiple Higher Lows (HL) indicate that the market has been trying to build a bullish structure, but the recent level rejection from resistance suggests sellers are still defending that zone aggressively.
2. Key Zones
Resistance (3,420 – 3,440): Price tested this level and faced a sharp rejection, marking it as a strong supply zone.
Support (3,303 – 3,316): Historical buy reactions are seen here, making it a crucial demand zone.
Entry Zone: Around 3,351 – 3,360, which is being used for the current short setup.
3. Pattern & Price Action
BOS (Break of Structure) occurred earlier on the left side of the chart, breaking above previous highs and confirming bullish strength at that time.
BOL (Break of Low) later on indicates a shift in momentum, as price failed to maintain the bullish push and created a bearish swing.
The Bullish Fair Value Gap (FVG) earlier provided a springboard for upward movement, but recent momentum failed to sustain.
4. Current Trade Idea (Short Bias)
Entry: 3,351 – 3,360 (retracement to minor resistance after breakdown).
Stop Loss: Above 3,380, protecting against a false breakout.
Target: 3,316 (mid-term) with a possible extension to 3,303 if bearish pressure continues.
5. Sentiment & Risk Factors
Bears are currently favored due to the rejection from major resistance and the inability of bulls to reclaim 3,380+.
If the price reclaims and holds above 3,380, this short setup will be invalidated, and the market could retest 3,420 – 3,440.
📌 Summary:
XAUUSD is trading in a defined range, with the current structure leaning bearish after resistance rejection. A short position from the entry zone targets the strong support below, but traders should remain cautious as higher lows in the past indicate that bulls may still attempt to defend support aggressively.

AUD_CHF GROWTH AHEAD|LONG|
✅AUD_CHF is consolidating
Above the horizontal support
Level of 0.5255 and we are
Already seeing a bullish
Reaction so we will be expecting
A further bullish move up
LONG🚀
✅Like and subscribe to never miss a new idea!✅

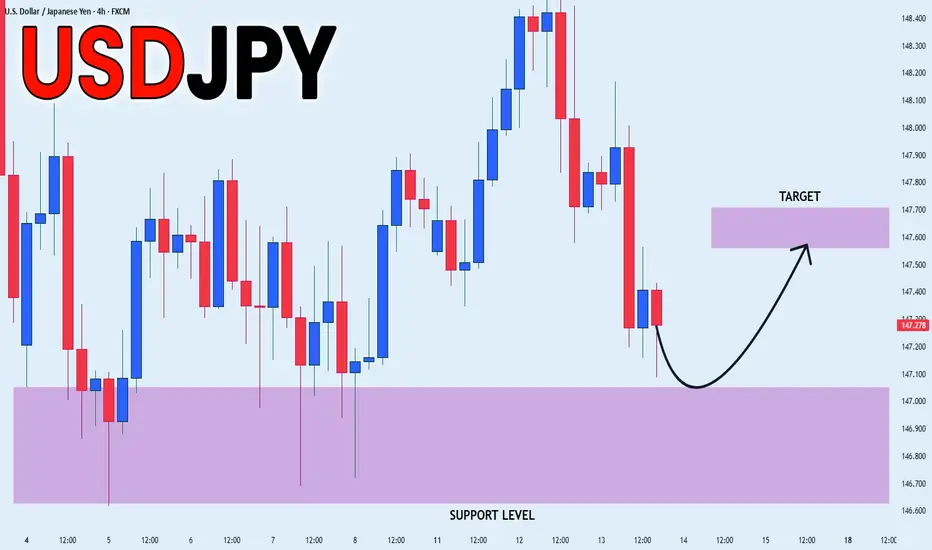
USD_JPY SUPPORT AHEAD|LONG|
✅USD_JPY is set to retest a
Strong support level below at 146.800
After trading in a local downtrend for some time
Which makes a bullish rebound a likely scenario
With the target being a local resistance above at 147.600
LONG🚀
✅Like and subscribe to never miss a new idea!✅
NATGAS Swing Short! Sell!
Hello,Traders!
NATGAS made a bearish
Breakout of the key horizontal
Level of 2.895$ while trading
In a downtrend so we are
Bearish biased and we will
Be expecting a further
Bearish continuation
Sell!
Comment and subscribe to help us grow!
Check out other forecasts below too!
Disclosure: I am part of Trade Nation's Influencer program and receive a monthly fee for using their TradingView charts in my analysis.

EUR-JPY Bullish Bias! Buy!
Hello,Traders!
EUR-JPY is trading in an
Uptrend and the pair is
Making a retest of the
Horizontal support level
Of 172.300 and we are
Bullish biased and we will
Be expecting a further
Bullish move up
Buy!
Comment and subscribe to help us grow!
Check out other forecasts below too!
Disclosure: I am part of Trade Nation's Influencer program and receive a monthly fee for using their TradingView charts in my analysis.

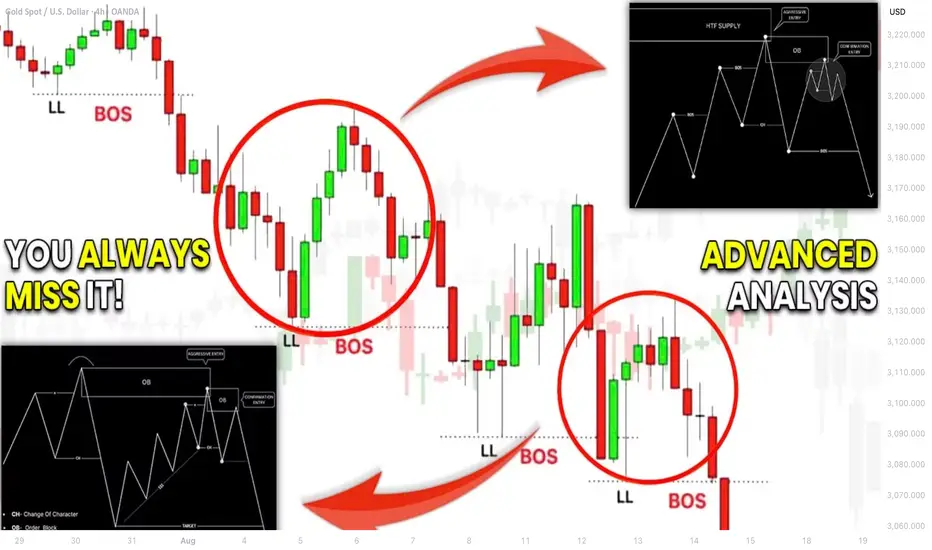
How to Do Structure Mapping with Multiple Time Frames Analysis
If you think that structure mapping is not efficient for profitable trading, you get it wrong .
What newbies traders always miss is that structure mapping works effectively only with multiple time frame analysis.
In this article, I will show you how you can build profitable trading plans and accurate predictions on forex market with structure mapping alone.
Learn top-down analysis secrets and how to map structure properly in Smart Money Concepts SMC ICT.
In order to effectively use structure mapping for scalping, day trading and swing trading , always start it from higher time frames.
Examine my complete structure mapping on USDJPY forex pair on a daily time frame.
You can see that first, the pair was trading in a strong bearish trend.
Then, we had a confirmed bullish reversal with Change of Character.
After that, the market started an extended consolidating movement, not being able to update the highs.
And finally, the last bullish wave managed to update a high , confirming a completion of a consolidation and a resumption of a bullish trend.
Structure mapping reveals that USDJPY is now bullish on a daily and the last bearish movement is a correction in uptrend.
We can expect a start of a new bullish wave soon.
To understand when exactly it is going to happen, you will need to dive your analysis deeper .
You should start structure mapping on lower time frames.
And you should execute a price action analysis there in relation to your structure mapping on a higher time frame.
4H time frame structure mapping will reveal a price action within the last bearish move that we spotted on a daily.
We see that the market is trading in a bearish trend and the price started a local correctional movement after a formation of the last low.
4h time frame structure mapping provided a detailed intra week perspective.
Hourly time frame analysis, we reveal hidden intraday trends that will unveil more insights.
And why are we doing all that?
Remember that big waves always start from minor reversals.
The earlier you are able to find strong confirmations, the earlier you will open a trading position and the more profits you will make.
On an hourly time frame, our structure mapping shows that the market is already bullish. A bearish trend that USDJPY followed is already violated, and the price is updating the highs.
Following our analysis, the only thing that we need to confirm a start of a bullish trend is a confirmed trend reversal and a change of character on a 4H time frame.
It will validate an intra week bullish trend.
We will need the price to break the underlined blue resistance based on the last lower high in a bearish trend.
That will provide an accurate signal for us to buy.
And we can anticipate a rise a least to a current daily higher high then.
When you do structure mapping on forex market, never forget to do that on multiple time frames. Multiple perspectives and short-term/mid-term/long-term projections will help you to build a more efficient trading plan.
Remember that you can expand your structure mapping even for minute time frames. It will provide a unique perspective for scalping forex.
❤️Please, support my work with like, thank you!❤️
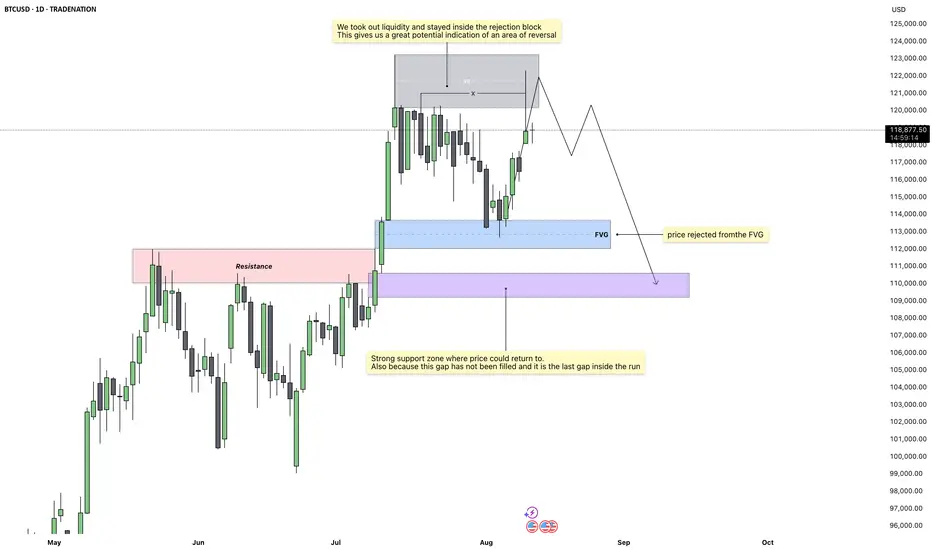
Bitcoin – The Last Stop Before the DropMarket Overview
Price action on the daily chart has shown a decisive move into a key rejection block after taking out recent liquidity. This is a classic sign of exhaustion in the current move, suggesting that momentum may now begin to shift in the opposite direction. The daily close reinforced this idea, showing a clear respect for higher-timeframe resistance levels.
Rejection Block Context
The 4H and daily rejection blocks have aligned, creating a strong confluence zone where sellers have stepped in before. Price did not just test this area, it closed within it, which often indicates a high probability of reversal. This setup builds confidence that the market could be preparing for a retracement.
Liquidity Sweep Confirmation
Before the rejection occurred, price ran through a cluster of resting liquidity above recent highs. This liquidity grab often acts as the fuel for a reversal, as it traps late buyers and allows larger players to shift price in the opposite direction.
Fair Value Gap Target
Below current price, there remains an unfilled gap which is the final gap inside the current run. Historical price behavior shows that such gaps tend to get filled before a fresh move can develop. This unfilled zone provides a clear downside target.
Bearish Scenario
If the rejection holds, I expect price to work its way lower toward the 110k range, filling that remaining gap before any sustained bullish move can resume.
Conclusion
With liquidity taken, a clean rejection from higher-timeframe resistance, and an untouched gap below, the chart is aligning for a potential retracement. I am watching for continued weakness to confirm the move toward the 110k region.
Disclosure: I am part of Trade Nation's Influencer program and receive a monthly fee for using their TradingView charts in my analysis.
___________________________________
Thanks for your support!
If you found this idea helpful or learned something new, drop a like 👍 and leave a comment, I’d love to hear your thoughts! 🚀
AUDUSD Breakout Setup: Ready for Lift-Off!Hey Guys,
I’ve analyzed the AUDUSD pair for you. If the 0.65245 level breaks to the upside, my target will be 0.65416.
If it doesn’t break, I’ll be looking to buy around 0.65047 or 0.64954.
Either way, my final target remains 0.65416.
In this analysis, I’ve highlighted two key levels and shared my target. I’m planning to buy from these zones.
Every single like from you is my biggest source of motivation to keep sharing these analyses. Huge thanks to everyone who supports by liking!

US100 Bullish Breakout! Buy!
Hello,Traders!
US100 is trading in a
Strong uptrend and the
Index made a strong bullish
Breakout of the key horizontal
Level of 23,720 which is now
A support and the breakout
Is confirmed so we are
Bullish biased and we will
Be expecting a further
Bullish continuation
Buy!
Comment and subscribe to help us grow!
Check out other forecasts below too!
Disclosure: I am part of Trade Nation's Influencer program and receive a monthly fee for using their TradingView charts in my analysis.
