SPX500 H4 | Bullish ContinuationMomentum: Bullish
Price is currently above the ichimoku cloud.
Buy entry: 6,976.08
- Pullback support
- 23.6% Fib retracement
Stop Loss: 2,946.65
- Swing low support
Take Profit: 7,017.09
- Swing high resistance
High Risk Investment Warning
Stratos Markets Limited (fxcm.com/uk), Stratos Europe Ltd (fxcm.com/eu):
CFDs are complex instruments and come with a high risk of losing money rapidly due to leverage. 69% of retail investor accounts lose money when trading CFDs with this provider. You should consider whether you understand how CFDs work and whether you can afford to take the high risk of losing your money.
Stratos Global LLC (fxcm.com/en): Losses can exceed deposits.
Please be advised that the information presented on TradingView is provided to FXCM (‘Company’, ‘we’) by a third-party provider (‘TFA Global Pte Ltd’). Please be reminded that you are solely responsible for the trading decisions on your account. Any information and/or content is intended entirely for research, educational and informational purposes only and does not constitute investment or consultation advice or investment strategy. The information is not tailored to the investment needs of any specific person and therefore does not involve a consideration of any of the investment objectives, financial situation or needs of any viewer that may receive it. Past performance is not a reliable indicator of future results. Actual results may differ materially from those anticipated in forward-looking or past performance statements. We assume no liability as to the accuracy or completeness of any of the information and/or content provided herein and the Company cannot be held responsible for any omission, mistake nor for any loss or damage including without limitation to any loss of profit which may arise from reliance on any information supplied by TFA Global Pte Ltd.
Stratos Trading Pty. Limited (fxcm.com/au):
Trading FX/CFDs carries significant risks. FXCM AU (AFSL 309763), please read the Financial Services Guide, Product Disclosure Statement, Target Market Determination and Terms of Business at fxcm.com/au
Snp500

SPX500 H4 | Bearish Reaction Off Pullback ResistanceMomentum: Bearish
Price is currently below the ichimoku cloud.
Sell entry: 6,938.59
- Pullback resistance
- 78.6% Fib resistance
Stop Loss: 6,980.53
- Swing high resistance
Take Profit: 6,883.83
- Pullback support
High Risk Investment Warning
Stratos Markets Limited (fxcm.com/uk), Stratos Europe Ltd (fxcm.com/eu):
CFDs are complex instruments and come with a high risk of losing money rapidly due to leverage. 69% of retail investor accounts lose money when trading CFDs with this provider. You should consider whether you understand how CFDs work and whether you can afford to take the high risk of losing your money.
Stratos Global LLC (fxcm.com/en): Losses can exceed deposits.
Please be advised that the information presented on TradingView is provided to FXCM (‘Company’, ‘we’) by a third-party provider (‘TFA Global Pte Ltd’). Please be reminded that you are solely responsible for the trading decisions on your account. Any information and/or content is intended entirely for research, educational and informational purposes only and does not constitute investment or consultation advice or investment strategy. The information is not tailored to the investment needs of any specific person and therefore does not involve a consideration of any of the investment objectives, financial situation or needs of any viewer that may receive it. Past performance is not a reliable indicator of future results. Actual results may differ materially from those anticipated in forward-looking or past performance statements. We assume no liability as to the accuracy or completeness of any of the information and/or content provided herein and the Company cannot be held responsible for any omission, mistake nor for any loss or damage including without limitation to any loss of profit which may arise from reliance on any information supplied by TFA Global Pte Ltd.
Stratos Trading Pty. Limited (fxcm.com/au):
Trading FX/CFDs carries significant risks. FXCM AU (AFSL 309763), please read the Financial Services Guide, Product Disclosure Statement, Target Market Determination and Terms of Business at fxcm.com/au

Long SHTrading Fam,
Gonna put my money where my mouth is here. Expecting an imminent pullback in the stock market. I'll use the ProShares Short ETF for this trade. We'll do a 1:2 rrr for this trade. Shooting for that orange 350-day SMA (currently at around $39) and I'll set my SL at $34.
✌️Stew

SPX Has Now Broken Down From Our Wedge As AnticipatedTrading Fam,
It's time. We've prepared. SPX has now broken our wedge to the downside. Another candle on the daily will confirm this bearish move. I expect the 50-day SMA to give us a bit of a bounce. We may retest the underside of the wedge before further moving down at the end of this week or the beginning of next.
Again, as stated in my previous video post, I would expect us to draw back to at least that 200-day SMA in red. More likely, we'll go to support, which intersects with that 350-day SMA (orange) at around 6100. If we go lower and break below that 350-day SMA, we're likely to test the bottom of our channel.
Trade accordingly once confirmation of this bearish move can be had.
✌️Stew

Is The Price Of Silver Telling Us What The Dollar Is Going To DoTrading Fam,
I am sensing some events on the horizon, and the charts seem to confirm what I am feeling. I want to let you know what I am seeing. We’ll talk Silver, the dollar, S&P500, Bitcoin, and Ethereum in this video. Don’t shoot the messenger.
✌️Stew

Hellena | SPX500 (4H): LONG to resistance area of 7050.Colleagues, the upward movement is not yet complete and remains a priority, but there is one caveat. The completion of the medium-term wave “1” (blue) is quite difficult to predict, as the junior wave ‘3’ may turn out to be wave “5”, since the structure resembles an initial diagonal. However, this does not negate the plan to continue the upward movement, even if there is a deep correction.
At the moment, I expect the resistance area of 7050 to be reached, as I would prefer to give a forecast for the nearest levels now.
Manage your capital correctly and competently! Only enter trades based on reliable patterns!

Hellena | SPX500 (4H): LONG to resistance area of 7010.Colleagues, I expect the upward movement in the medium-term wave “1” to continue.
The minor wave “3” should still be developing, and I expect a repeat update of the high of the higher-order wave “3” (6929.4).
I consider the 7010 area to be the nearest target. If we calculate using Fibonacci expansion, the target is higher, but I always play it safe and take the nearest targets.
Manage your capital correctly and competently! Only enter trades based on reliable patterns!

SPX - Next LevelsWe’re evaluating the move starting from April 2025.
It looks like we’re nearing the end of this move, currently plotting the fifth wave.
Corrections of waves 2 and 4 are roughly equal in size.
Fibonacci levels indicate the next target around 7,200 .
The 7,600 level (slightly below or above) roughly aligns with a larger Fibonacci extension, counting the first wave from October 2022 to July 2023.
Potential targets:
7,200
7,600
---
Please subscribe and leave a comment.
You’ll get new information faster than anyone else.
---

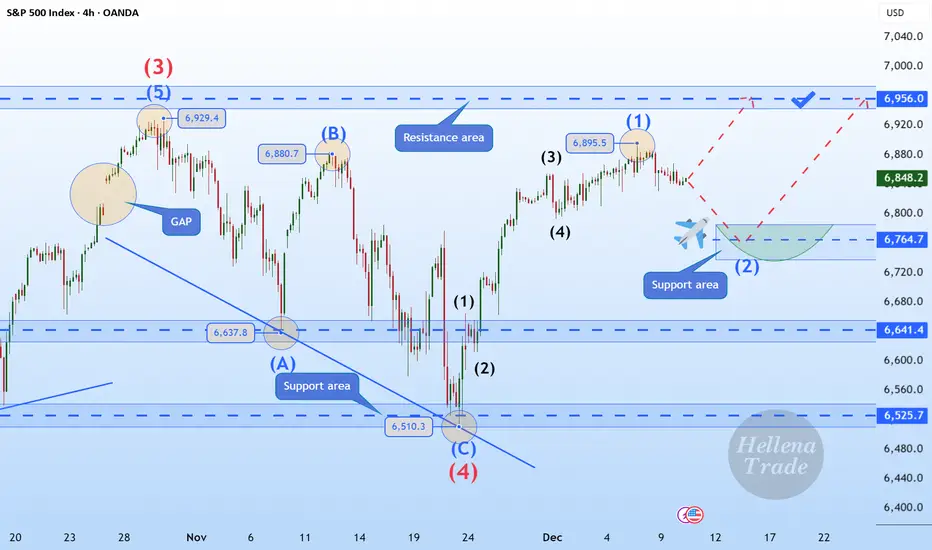
Hellena | SPX500 (4H): LONG to the area of 6956.Hello, colleagues!
I previously published a forecast for an upward movement, and I believe it is time to update the plan slightly. The direction of movement remains the same, but wave “1” has lengthened, which means that the correction in wave “2” may occur slightly higher than previously.
I expect a corrective movement to the support area of 6764, followed by a continuation of the upward movement and an update of the peak level of wave “3” of the higher order 6929 and reaching the area of 6956 at a minimum.
An extension of wave “1” is also possible, but then it will be necessary to slightly revise the wave markings again.
Manage your capital correctly and competently! Only enter trades based on reliable patterns!
SNP500 Review December 24 2025Short-term price movement ideas.
Price has filled the nearest weekly long FVG, which builds a context for a potential high break.
After the FVG fill, we received confirmations on the daily timeframe in the form of multiple FVGs, which currently act as the main areas of interest.If price revisits one of these daily POIs and provides confirmation on the 4H timeframe, further upside movement can be expected, targeting a new high.
After the weekly high sweep, price behavior should be monitored closely.
If there is no meaningful reaction to the sweep and price continues to push higher, the market may proceed toward all-time highs.
However, if we see an aggressive reaction and a pullback below 6800, followed by a clear acceptance below this level, a deeper correction may follow.
Be flexible, adapt to the market, and the results will come quickly. Good luck to everyone.

ES Weekly Outlook: Can the Santa Rally Carry ES Back to All TimeMacro Backdrop and Sentiment Over the Past Month
Over the past month, the macro narrative for ES has been defined by a gradual shift from momentum driven optimism to a more cautious and selective risk environment. Coming out of October, equities were supported by easing financial conditions, strong earnings from mega cap technology, and continued enthusiasm around productivity gains tied to AI investment. That optimism pushed ES to fresh all time highs by the end of October.
As November progressed, sentiment became more balanced. Market participants began to reassess forward growth expectations, the path of monetary policy, and the sustainability of stretched valuations. Rather than a sharp risk off move, the tape transitioned into a rotational regime where participants became increasingly responsive around well defined value areas.
This shift has resulted in slower tempo, overlapping value, and greater sensitivity to technical references rather than headline driven trend continuation. The market has increasingly rewarded patience, context, and execution around key levels as opposed to chasing momentum.
What the Market has done
• From the all time highs made at the end of October, the market rotated lower toward the 6605 area, which aligned with daily support. Responsive buyers entered aggressively at this level and successfully defended the level.
• Following the responsive buying, price auctioned higher toward the 6975 area, which aligned with daily resistance and the 5 November weekly value area high, where sellers responded and capped further upside.
• During the past week, the market broke below the first two weeks of December’s range and the composite value area, signaling a short term loss of acceptance at higher prices.
• Price then auctioned lower toward the 6780 area, which aligned with the 24 November weekly VPOC, where buyers once again responded and defended the level.
• Responsive buying from 6780 drove the price back higher toward the 6885 area, which sits near the 12 December weekly settlement and the two week composite value area low, reinforcing the broader balanced structure.
What to expect in the coming week
The key reference to frame the coming week is the previous week’s settlement at 6888.50.
Bullish scenario
• If the market can accept above 6888.50, expect an auction higher toward the 6970 area, which aligns with daily resistance, the 5 November weekly value area high, and the weekly 0.5 standard deviation high.
• Sellers are expected to respond in the 6970 area and attempt to rotate price back down
• If sellers fail to defend this area, continuation higher toward 7012 becomes likely, which aligns with all time highs and the weekly 1 standard deviation high.
Bearish scenario
• If the market is unable to accept above 6888.50, expect a move lower toward the 6827 area, which aligns with the previous week’s value area low and the weekly 0.5 standard deviation low.
• Buyers are expected to respond at 6827 to bid prices back up through value.
• If buyers fail to hold 6827, expect a continuation lower toward the 6780 area, which aligns with the previous week’s low, the 24 November weekly VPOC, and the weekly 1 standard deviation low.
Neutral scenario
• If the market is unable to extend meaningfully beyond 6970 on the upside or 6827 on the downside, expect the market to remain balanced and rotational.
• In this scenario, value is likely to continue shifting modestly higher as the market awaits the next catalyst.
Conclusion
ES remains in a broader balance regime where responsive trade dominates and initiative activity has struggled to sustain follow through. Until the market can show clear acceptance above resistance or below support, patience and level based execution remain critical. The previous week’s settlement at 6888.50 will act as the primary decision point this week that helps determine whether the market seeks higher prices, deeper balance, or continued two way trade. If seasonal Santa rally dynamics come into play, they may act as the catalyst that allows the market to regain initiative strength and auction back toward all time highs.
What is your take on ES? We would love to hear your view on it. Please give us your comments and give this a boost so that more traders in the community can participate. Thank you.
Disclaimer: This is not financial advice. Analysis is for educational purposes only; trade your own plan and manage risk.

SPX500 H4 | Bullish Bounce Off Pullback SupportMomentum: Bullish
Price is currently above the ichimoku cloud.
Buy entry: 6,773.15
- Pullback support
- 38.2% Fib retracement
- 127.2% Fib extension
Stop Loss: 6,714.17
- Pullback support
Take Profit: 6,832.14
- Pullback resistance
High Risk Investment Warning
Stratos Markets Limited (tradu.com/uk ), Stratos Europe Ltd (tradu.com/eu ):
CFDs are complex instruments and come with a high risk of losing money rapidly due to leverage. 70% of retail investor accounts lose money when trading CFDs with this provider. You should consider whether you understand how CFDs work and whether you can afford to take the high risk of losing your money.
Stratos Global LLC (tradu.com/en ): Losses can exceed deposits.
Please be advised that the information presented on TradingView is provided to Tradu (‘Company’, ‘we’) by a third-party provider (‘TFA Global Pte Ltd’). Please be reminded that you are solely responsible for the trading decisions on your account. Any information and/or content is intended entirely for research, educational and informational purposes only and does not constitute investment or consultation advice or investment strategy. The information is not tailored to the investment needs of any specific person and therefore does not involve a consideration of any of the investment objectives, financial situation or needs of any viewer that may receive it. Past performance is not a reliable indicator of future results. Actual results may differ materially from those anticipated in forward-looking or past performance statements. We assume no liability as to the accuracy or completeness of any of the information and/or content provided herein and the Company cannot be held responsible for any omission, mistake nor for any loss or damage including without limitation to any loss of profit which may arise from reliance on any information supplied by TFA Global Pte Ltd.

From Shutdown Relief to AI Anxiety — Two Narratives Driving ESMarket Theme
The week began on a strong footing, driven by a bullish Sunday reopen in ES after news broke that the 43-day government shutdown was set to end, following the Senate’s late-night support for a potential agreement on November 9th. This relief catalyst created early upside momentum, pushing the index toward all-time highs (ATHs).
However, the tone shifted mid-week. The rally lost steam as markets refocused on a growing concern: the sustainability of current Tech and AI valuations. Investors are becoming more sensitive to the possibility of overstretched AI-related capital expenditure and an emerging bubble narrative, especially with heavyweight earnings and forward-guidance looming. This led to a rotation out of high-beta tech and into safer or less-extended sectors.
On the macro front, Fed speakers adopted a more cautious—if not outright hawkish—tone, emphasizing that a December rate cut is far from assured. The recent government shutdown created a backlog in key economic data releases, leaving policymakers and traders alike without clear visibility into the true state of the economy. The lack of data has amplified uncertainty and reduced the market’s conviction around the timing of any potential policy easing.
In short:
The market is caught between two opposing forces:
The optimistic narrative (shutdown resolved, path to ATHs, resilience in U.S. growth), and
The risk narrative (valuation excess, policy uncertainty, narrowing breadth).
This push-pull dynamic has resulted in compression rather than continuation, with a heavy focus on clarity from upcoming data and major earnings.
What is the Market Doing?
Last week formed an inside week, with the entire range trading within the prior week’s range and settling close to the previous week’s close. This signals indecision and balance, as neither buyers nor sellers had the conviction to push the market into expansion.
Current price action shows the market compressing between:
6875 — previous week’s VPOC / 27 Oct weekly VAL
6740— 13 Oct weekly VAH / 10 Nov weekly volume ledge
These levels are well-defined and respected. The upward trendline continues to hold, with multiple strong rejections signaling responsive buyers stepping in to bid prices back up.
The battle is now between buyers attempting to defend 6740 area which is also confluent with the daily trendline support, and sellers leaning on the overhead resistance close to 6875.
What to Expect in the Coming Week
The key line in the sand (LIS) this week:
→ 6755.25 — Previous week's settlement
Bullish Scenario
If 6755 holds as support, expect buyers to attempt a push toward:
6874.50 — previous week's VPOC
6905.5— weekly 1-SD volatility high
Anticipate responsive sellers in this area.
However, if price breaks above 6874.50 with pace and volume and accepts above it, the path opens for a retest of the ATHs as momentum players and trapped shorts fuel continuation.
Bearish Scenario
If the market accepts below 6755 and fails to reclaim it on any pullback:
First downside target: 6660 — 13 Oct weekly VAL
If buyers fail to respond there, expect an acceleration lower from long liquidation toward:
6605— weekly 1-SD volatility low
6504 — previous month's low (deeper target)
This scenario strengthens if the trendline breaks and sellers begin stepping down aggressively.
Neutral / Compression Scenario
If the market remains trapped between 6875 and 6740 with no breakout supported by pace and volume:
Expect two-way rotational trade
Continued compression and balance within the well-defined range
A buildup of energy that may resolve later in the week with data, earnings or fundamental catalysts
Conclusion
As we start the new week, ES remains tightly coiled between well-defined levels, with the market waiting for clarity from data, earnings, and policy signals. Whether we break from compression or continue to balance, the key will be how buyers and sellers respond around 6755 and whether there are new fundamental catalysts.
As always, I’d love to hear your view on the markets and ES this week? — Drop it below — and give it a boost so more of the community can join the conversation.
Glossary Index for all technical terms used:
VAH (Value Area High)
VAL (Value Area Low)
VPOC (Volume Point of Control)
SD (Standard Deviation)

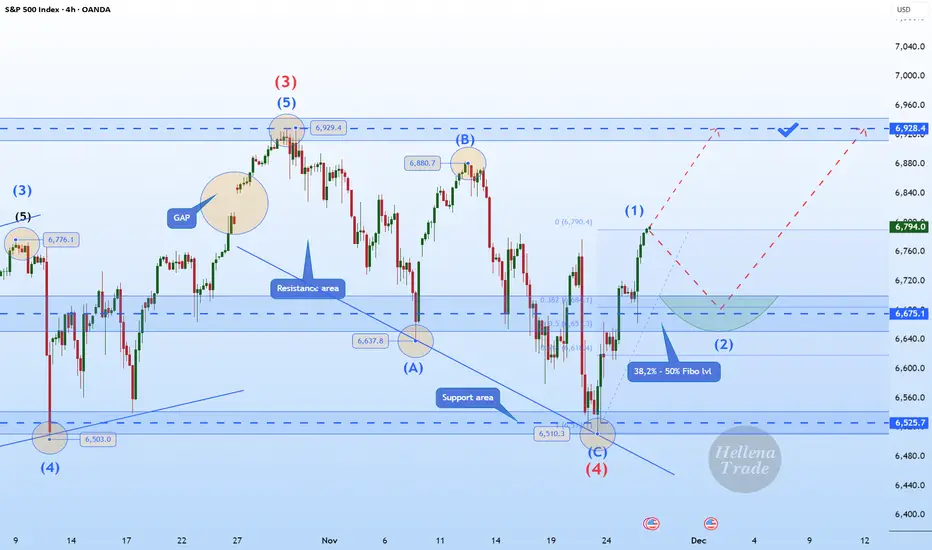
Hellena | SPX500 (4H): LONG to MAX of wave "3" of 6928.Colleagues, we continue the previous scenario of upward movement in the impulse “12345”.
I expect a small correction in the middle order wave “2” approximately to the area of 38.2%-50% Fibonacci levels (6675).
Then I expect a continuation of the upward movement to the maximum of the wave "3" of the higher order 6928.4.
It is possible that the first wave may be stretched, which may mean a correction-free movement to the target.
Fundamental Context.
Market sentiment remains cautiously bullish ahead of this week’s US data releases. Investors continue to price in a softer Fed policy path for 2026, which supports the equity market after the recent correction.
US Treasury yields remain under pressure, and the latest macro indicators — especially labor market cooling and weaker business activity components — reinforce expectations of an economic slowdown. This backdrop typically favors equity upside as markets look ahead to potential policy easing.
Manage your capital correctly and competently! Only enter trades based on reliable patterns!
#ES_F Daily TF Longer Outlook UpdateBack in October we broke down Daily Outlook after we had topping signals and strong trend break. When that was posted we were looking to two possibilities after the trend was broken, we either needed to get back under Smaller MA without reaching the top to show no acceptance in New Range to then proceed with trend change and a slower correction or stay above Smaller MA to push for higher VAH/Edge areas to make this our range for some time and possibly balance between VAH/VAL with pushes out of them finding their way back in.
What ended up happening is we got a push back into MA but closed over it and more buying came in to push and gap us over VAH into Range Top, of course we had no way of knowing that Range Edge would be the top but we pushed into it and showed clear topping/rejection from it.
This time Edge Top rejection was much stronger and got us back under VAH/Smaller MA, flushed VAL with Medium MA which again provided Temp Support and as mentioned we got that balancing action between VAL / VAH with pushes out rotating back in until we broke/closed under Medium MA and got more selling which took us under Range Edge Low, flushed Previous Range VAH and Large MA but as that was first tag of big MA after spending quite some time away it naturally provided buying to get us back in New Range which we showed acceptance in by Previously Tagging the Top which meant once price is back in, it doesn't need much big buying as it just wants to rotate back towards Supply which so happens to be at/over VAH.
Where can we go from here ?
The flush under Edge Low temporarily changed Medium Trend into correction but the bounce didn't let us stay in correction and instead we go that rotation into Supply and are now technically again in Up Trend over MAs.
Yes we can stay in up trend and continue with sideways/strength/inside days that will keep us up Over/Around VAH while we let Smaller/Medium MAs catch up and continue pushing us towards Edge Top and maybe even push us into New Range Above.
But few things we have to consider... We are at the top of Big Big area (under new price level of 7000), We had a huge run this year, We have showed multiple Topping Patterns here around 6800 - 6900 +/- Areas, We have showed good trend breaks and attempts at trend change, We are back in area of Supply where bigger failures/sellers have came in, We are extended from Medium and Small MAs which provide support in New/Untested areas and this time we are extended away into Supply Area not New area.
With all that in mind will we have strong buyers who will come in here and start buying the extension inside Supply ? Or was this extension all momentum buyers who aren't planning to hold us up.
My current bias is if we look at Cost Basis break out area up to our Top, then the Flush to Large MA and back up, to me it looks like one side of a bigger M topping pattern which happens at bigger tops. If that is the case then either Friday or somewhere close we should be marking our Lower High and if buyers from Last Week will not hold this then price will want to head back towards some sort of Support which would be Smaller MA as the first spot which means back under VAH. Something to be careful of is that since now VIX is down, Volume will be down as well with holidays coming which means even if we start moving down it might be more of the same way we got up here last week which was more of Slower Balance(Back and Forth) Up days. Way down could be similar with slower balance down days.
From there Smaller MA and areas under it can Provide Support and keep us in some sort of sideways action around it BUT as long as we keep holding under VAH 860s - and under Edge Top 920s then that will mean Weakness, we would look for a move under VAH that can stay under it even if it consolidates around, then into Mean where Medium MA should be by the time we get there, of course it could happen fast as well but have this feeling that it might be a drag this time around IF it happens.
We already have a week of fresh Supply up here from Last Week and if we again get under Smaller MA and can again change trend under Medium MA then that will bring in more weakness to continue for lower targets back towards VAL which could also provide holds BUT if trend stays in correction and we are to follow through with the M pattern then we will eventually see a move back under Range Edge Low and aim to take out the low we made on the last Flush Nov 21st which would be the M middle which could give us more weakness to take us towards our Correction Areas lower into the Cost Basis. Again if market has topped out and all the large selling for now is done, if this is to happen then careful of forcing for it to happen quick as this can play out over a longer period of time as market may need a longer breather/correction/consolidation before it can start a new stronger trend again.
If we don't end up getting a correction under Medium MAs under VAL/Edge then staying over VAL can keep price in balance with us going back and forth in 6700 - 6900s areas for some time, to not have a correction or prevent price balance and see more strength price would need to let some MAs catch up and push us over Previous High AND be able to stay above it, until then we will be looking at either more Balance or Balance with Weakness which can give us a correction.

SPY FREE SIGNAL|SHORT|
✅SPY price is reacting inside a major supply zone after a displacement shift, signaling downside intent as liquidity above has been swept. Favoring continuation lower as price seeks inefficiency fill.
—————————
Entry: 686.84$
Stop Loss: 690.00$
Take Profit: 682.00$
Time Frame: 4H
—————————
SHORT🔥
✅Like and subscribe to never miss a new idea!✅

SPY Free Signal! Sell!
Hello, Traders!
SPY is tapping into a premium supply zone after a sharp displacement, with liquidity resting below the recent swing structure. Price is expected to retest the rejection block before delivering a move into downside objectives. Time Frame 6H.
Sell!
Comment and subscribe to help us grow!
Check out other forecasts below too!
Disclosure: I am part of Trade Nation's Influencer program and receive a monthly fee for using their TradingView charts in my analysis.

SPX500 Short
Deep crab pattern completes on M15, mapping a potential reversal zone.
Multiple tops formed on M15 and M30 at the same area, reinforcing overhead supply from the prior day’s high that price could not break.
RSI reached overbought on M15 and M30, indicating crowded long positioning.
Approximately 20 points of RSI bearish divergence across M15 and M30, consistent with a weakening advance.
H4 has turned down after last week’s rebound and now aligns with a downside continuation view.
Daily slope is flattening and price is trading beneath it, suggesting the early stages of a broader reversal can develop if sellers follow through.
Bias is short of the reversal zone identified by the deep crab and repeated tops.
Stop loss set at 50 pips to cap risk if resistance fails.
First target at 6,600, which is 100 pips from entry, with room to manage partials at nearby structure if momentum confirms.
Several US indices and other global indices are printing similar topping behavior and momentum fades, adding intermarket confluence to the short idea.

S&P500 H1 | Bearish Reaction Off Key ResistanceMomentum: Bearish
Price is currently below the ichimoku cloud.
Sell entry: 6,711.35
- Strong pullback resistance
- 78.6% Fib retracement
- 100% Fib projection
Stop Loss: 6,785.20
- Overlap resistance
Take Profit: 6,641.93
- Overlap support
High Risk Investment Warning
Stratos Markets Limited (tradu.com/uk ), Stratos Europe Ltd (tradu.com/eu ):
CFDs are complex instruments and come with a high risk of losing money rapidly due to leverage. 70% of retail investor accounts lose money when trading CFDs with this provider. You should consider whether you understand how CFDs work and whether you can afford to take the high risk of losing your money.
Stratos Global LLC (tradu.com/en ): Losses can exceed deposits.
Please be advised that the information presented on TradingView is provided to Tradu (‘Company’, ‘we’) by a third-party provider (‘TFA Global Pte Ltd’). Please be reminded that you are solely responsible for the trading decisions on your account. Any information and/or content is intended entirely for research, educational and informational purposes only and does not constitute investment or consultation advice or investment strategy. The information is not tailored to the investment needs of any specific person and therefore does not involve a consideration of any of the investment objectives, financial situation or needs of any viewer that may receive it. Past performance is not a reliable indicator of future results. Actual results may differ materially from those anticipated in forward-looking or past performance statements. We assume no liability as to the accuracy or completeness of any of the information and/or content provided herein and the Company cannot be held responsible for any omission, mistake nor for any loss or damage including without limitation to any loss of profit which may arise from reliance on any information supplied by TFA Global Pte Ltd.

S&P500 H4 | Bearish Reaction off Key ResistanceMomentum: Bearish
Price is currently below the ichimoku cloud.
Sell entry: 6,706.19
- Strong pullback resistance
- 61.8% Fib retracement
- 100% Fib projection
Stop Loss: 6,790.06
- Swing high resistance
Take Profit: 6,602.91
- Swing low support
High Risk Investment Warning
Stratos Markets Limited (tradu.com/uk ), Stratos Europe Ltd (tradu.com/eu ):
CFDs are complex instruments and come with a high risk of losing money rapidly due to leverage. 70% of retail investor accounts lose money when trading CFDs with this provider. You should consider whether you understand how CFDs work and whether you can afford to take the high risk of losing your money.
Stratos Global LLC (tradu.com/en ): Losses can exceed deposits.
Please be advised that the information presented on TradingView is provided to Tradu (‘Company’, ‘we’) by a third-party provider (‘TFA Global Pte Ltd’). Please be reminded that you are solely responsible for the trading decisions on your account. Any information and/or content is intended entirely for research, educational and informational purposes only and does not constitute investment or consultation advice or investment strategy. The information is not tailored to the investment needs of any specific person and therefore does not involve a consideration of any of the investment objectives, financial situation or needs of any viewer that may receive it. Past performance is not a reliable indicator of future results. Actual results may differ materially from those anticipated in forward-looking or past performance statements. We assume no liability as to the accuracy or completeness of any of the information and/or content provided herein and the Company cannot be held responsible for any omission, mistake nor for any loss or damage including without limitation to any loss of profit which may arise from reliance on any information supplied by TFA Global Pte Ltd.

Hellena | SPX500 (4H): LONG to resistance area of 6775.Dear colleagues, according to the last forecast the price is at the support level, but as it turned out, the correction in wave “4” is a bit more complicated than I thought.
Wave “4” consists of three waves “ABC” and should be over soon. The upward movement is still in priority, but I will target the not so distant resistance area of 6775.
Once it is reached, we will think about how to reach higher levels.
Manage your capital correctly and competently! Only enter trades based on reliable patterns!

SPY Long From Demand Area! Buy!
Hello,Traders!
SPY tapped the higher-timeframe mitigation block after clearing sell-side liquidity, showing a strong bullish response. If displacement continues, price may rally toward the premium target. Time Frame 5H.
Buy!
Comment and subscribe to help us grow!
Check out other forecasts below too!
Disclosure: I am part of Trade Nation's Influencer program and receive a monthly fee for using their TradingView charts in my analysis.

S&P500 H1 | Bearish Reaction off Key ResistanceMomentum: Bearish
Price is currently below the ichimoku cloud.
Sell entry: 6,839.11
- Strong pullback resistance
- 78.6% Fib retracement
- 161.8% Fib extension
Stop Loss: 6,881.31
- Swing high resistance
Take Profit: 6,770.32
- Pullback support
High Risk Investment Warning
Stratos Markets Limited (tradu.com/uk ), Stratos Europe Ltd (tradu.com/eu ):
CFDs are complex instruments and come with a high risk of losing money rapidly due to leverage. 70% of retail investor accounts lose money when trading CFDs with this provider. You should consider whether you understand how CFDs work and whether you can afford to take the high risk of losing your money.
Stratos Global LLC (tradu.com/en ): Losses can exceed deposits.
Please be advised that the information presented on TradingView is provided to Tradu (‘Company’, ‘we’) by a third-party provider (‘TFA Global Pte Ltd’). Please be reminded that you are solely responsible for the trading decisions on your account. Any information and/or content is intended entirely for research, educational and informational purposes only and does not constitute investment or consultation advice or investment strategy. The information is not tailored to the investment needs of any specific person and therefore does not involve a consideration of any of the investment objectives, financial situation or needs of any viewer that may receive it. Past performance is not a reliable indicator of future results. Actual results may differ materially from those anticipated in forward-looking or past performance statements. We assume no liability as to the accuracy or completeness of any of the information and/or content provided herein and the Company cannot be held responsible for any omission, mistake nor for any loss or damage including without limitation to any loss of profit which may arise from reliance on any information supplied by TFA Global Pte Ltd.
