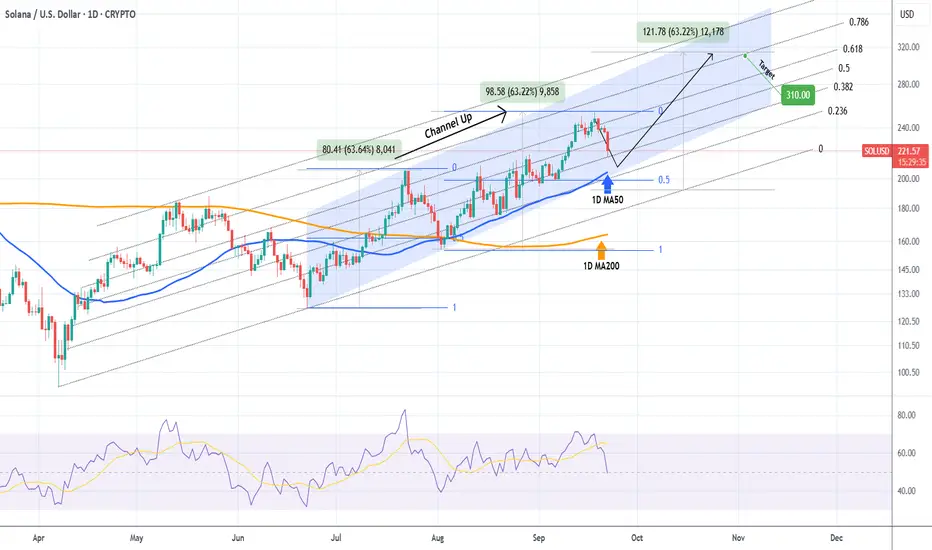
SOLANA Is a 1D MA50 pull-back needed for a $310 rally?Solana (SOLUSD) has been trading within a Channel Up since the June 22 Low, which goes even further back on a Fibonacci Channel Up started on the April 07 market bottom.
The price is pulling back at the moment, having completed a +63.22% Bullish Leg, same as the previous one that then pulled back to its 1D MA50 (blue trend-line) and 0.5 Fibonacci retracement level before starting the next Bullish Leg.
As a result, we expect the current correction so seek validation on the 1D MA50 at least and then rebound for a medium-term +63.22% rally, targeting $310 at least.
-------------------------------------------------------------------------------
** Please LIKE 👍, FOLLOW ✅, SHARE 🙌 and COMMENT ✍ if you enjoy this idea! Also share your ideas and charts in the comments section below! This is best way to keep it relevant, support us, keep the content here free and allow the idea to reach as many people as possible. **
-------------------------------------------------------------------------------
💸💸💸💸💸💸
👇 👇 👇 👇 👇 👇
SOL
$SOL Maintains Uptrend With Daily CloseIgnore the noise.
CRYPTOCAP:SOL is still very much in an uptrend and has closed the day above the 9EMA.
Bulls need to maintain this, otherwise a retest of the 20MA ~$224 will be retested.
SOL big picture: All Time High again in this cycle?
Solana has being showing strength in its price action recently compared to top 10 altcoins (in MarketCap) within the past few days, yet failing to break the strong resistance within 200 and 220. Bears have consistently defended this region while maintaining the price below the 0.618 Fibonacci level of the mid January - April price drawback.
Since then, the price has maintained an uptrend where the cup-and-handle pattern strongly playing out. But the the uptrend was restricted within a parallel channel (blue) and yet to be broken, which is a breakout to be played for SOL to break the 210 barrier. Price has been moving within a bearish wedge (white) during the months July and August, and still failed to confirm a positive breakout even after the price surge due to Jerome Powell's hint on rate cuts at annual economic policy symposium in Jackson Hole, Wyoming.
The current Bull Cycle is shortly coming to an end. Based on historical behavior, BTC reaches its ATH within 510 to 550 days from its recent halving which falls between mid-September to October end. BTC is supposed to go for an ATH within this region and September rate cuts can be a good fuel to reach this target. Mostly we will be having a short altcoin season for this cycle with a probability of an extension until year end (November or early December).
Statutory 240-day deadline for VanEck and Franklin SOL ETF applications will conclude by October 2025. As reported by Coinpaper, the final deadline has been set to October 16, 2025 for five Solana ETF applications. (source: coinpaper). These positive news can align with the last phase of the Crypto Cycleand trigger new ATH for SOL. Price will take a downturn if Bulls progressively struggle to break the parallel channel resistance by this time, marking the end of the current cycle.
So, a high probability exist for SOL to reach new ATHs with caution on the overall market sentiment within the coming 2 to 4 months. As the time of writing, SOL is at 198.14 , plunged from a local high of 213.6.
$SOLANA 250+ or bearish trend to 225/200With the recent solana pump, major profits have been taking place.
However, SOL stopped out at 249. Just under the Psychological level of 250.
On this chart we can see the following:
- Supply & Demand
- Anchored Volume
- Pattern: BF / BC /SR
- Two 4 hour FVG's below price, with HTF GP on the second FVG.
- One swing high & swing low
- OBV tool in place forming a bearish channel
- Psychological levels of 250, 225, 200
With these in place, we can see solana is looking pretty bearish now.
What comes up, must come down.
Solana is making a retest on the demand zone, which is also the resistance and golden pocket.
If price wicks and successfully rejects. We will definitely see 225.
A long with the Volume Anchor acting as a magnet for price to come back down as there has not yet been a retest.
But if it closes above the resistance, there is a greater chance of it breaking above the demand zone.
We will begin looking for shorting opportunities once solana fails to break above.
We will begin looking for long opportunities if solana succeeds in it's break above.
Right now, keep your eyes peeled.
We have movement incoming.

SOLUSDT → Correction amid a strong bullish trend BINANCE:SOLUSDT , after updating its next high, formed a false breakout of local resistance and returned to the trading range as part of a correction. What to expect from altcoin?
The main driver of the crypto market, Bitcoin, is consolidating above 115K and facing fairly strong resistance at 117400. Earlier, the price completed a downward correction. The market is dominated by a positive technical and fundamental background.
SOL looks stronger than Bitcoin and is testing new highs...
The price of SOLANA is forming a false breakout of resistance and is entering a correction phase amid a bullish trend. As part of the correction, the price may test the local imbalance zone and the key liquidity level of 242.5.
Resistance levels: 244, 249.2, 253.5
Support levels: 242.5, 239, 231.5
Technically, the price may form a false breakdown of the nearest zone of interest at 242.5, and if the bulls manage to keep the price above the resistance zone of 242.5-244.0 after this maneuver, the coin may return to an upward movement. However, if this does not happen, I would wait for a retest of the 239.0 zone, where the trend support line is located. The medium- and long-term outlook for SOL is positive, and the price is highly likely to test the ATH 295.0.
Best regards, R. Linda!

SOL – Bulls Holding the Channel!SOL has been overall bullish, trading inside a clean ascending channel. Price broke above the $215 – $220 structure zone and pushed higher, but is now pulling back for a retest.
This zone is key 🔑 . It aligns with channel support, making it a strong confluence for buyers to step in. If bulls defend it, momentum could continue, and SOL may push toward higher levels inside the channel 🚀.
If the zone fails, a deeper correction could follow before another attempt from the bulls. Until then, the bias remains bullish as long as structure holds.
What do you think — will the bulls 🐂 step in and send SOL flying again, or will bears take over for a deeper pullback? 🤔
⚠️ Disclaimer: This is not financial advice. Always do your own research and manage risk properly.
📚 Stick to your trading plan regarding entries, risk, and management.
Good luck! 🍀
All Strategies Are Good; If Managed Properly!
~Richard Nasr

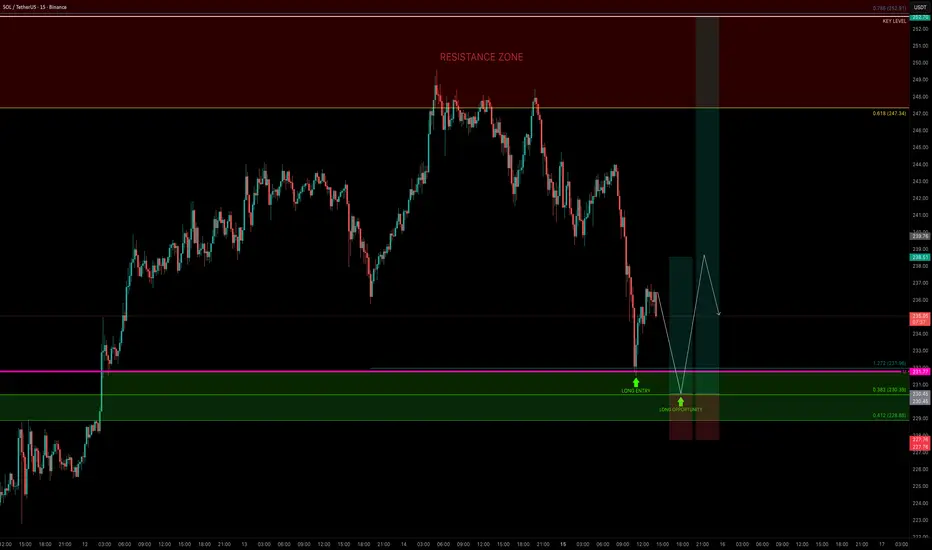
SOL — Bulls Need to Defend $230 for ContinuationSOL had a strong bullish week, almost tapping the $250 psychological level before rejecting down into the monthly level at $231.77, where price found support and bounced. This level also aligned with the 1.272 Fib extension ($231.96), making it a valid long opportunity.
🟢 Next Long Opportunity
The 0.382 Fib retracement ($230.39) of the move from the $199.32 low is the next key level to watch.
A retest here would:
Sweep liquidity from the current low
Offer a low-risk entry
Help fill some imbalances
📌 Overall, $230 is the level that must hold for bullish continuation.
Targets
TP1: $238 → R:R ~1:3
TP2: $252.91 (0.786 Fib retracement) → R:R ~1:8+ if momentum continues
Risk Management
Stop-Loss: Below $229 (clear invalidation)
Risk: Only 1% on this trade setup
Quick Take
If $230 holds, SOL could set up for another leg higher. This zone offers a clean, low-risk, high-reward long setup with clearly defined invalidation and attractive targets.
SOLUSD H4 | Bullish bounce offBased on the H4 chart analysis, we could see the price fall to the buy entry, which is a pullback support that aligns with the 50% Fibonacci retracement and could bounce from this level to the take profit.
Buy entry is at 217.27, which is a pullback support that lines up with the 50% Fibonacci retracement.
Stop loss is at 200.35, which is a pullback support.
Take profit is at 244.30, which is a swing high resistance.
High Risk Investment Warning
Trading Forex/CFDs on margin carries a high level of risk and may not be suitable for all investors. Leverage can work against you.
Stratos Markets Limited (tradu.com ):
CFDs are complex instruments and come with a high risk of losing money rapidly due to leverage. 65% of retail investor accounts lose money when trading CFDs with this provider. You should consider whether you understand how CFDs work and whether you can afford to take the high risk of losing your money.
Stratos Europe Ltd (tradu.com ):
CFDs are complex instruments and come with a high risk of losing money rapidly due to leverage. 66% of retail investor accounts lose money when trading CFDs with this provider. You should consider whether you understand how CFDs work and whether you can afford to take the high risk of losing your money.
Stratos Global LLC (tradu.com ):
Losses can exceed deposits.
Please be advised that the information presented on TradingView is provided to Tradu (‘Company’, ‘we’) by a third-party provider (‘TFA Global Pte Ltd’). Please be reminded that you are solely responsible for the trading decisions on your account. There is a very high degree of risk involved in trading. Any information and/or content is intended entirely for research, educational and informational purposes only and does not constitute investment or consultation advice or investment strategy. The information is not tailored to the investment needs of any specific person and therefore does not involve a consideration of any of the investment objectives, financial situation or needs of any viewer that may receive it. Kindly also note that past performance is not a reliable indicator of future results. Actual results may differ materially from those anticipated in forward-looking or past performance statements. We assume no liability as to the accuracy or completeness of any of the information and/or content provided herein and the Company cannot be held responsible for any omission, mistake nor for any loss or damage including without limitation to any loss of profit which may arise from reliance on any information supplied by TFA Global Pte Ltd.
The speaker(s) is neither an employee, agent nor representative of Tradu and is therefore acting independently. The opinions given are their own, constitute general market commentary, and do not constitute the opinion or advice of Tradu or any form of personal or investment advice. Tradu neither endorses nor guarantees offerings of third-party speakers, nor is Tradu responsible for the content, veracity or opinions of third-party speakers, presenters or participants.

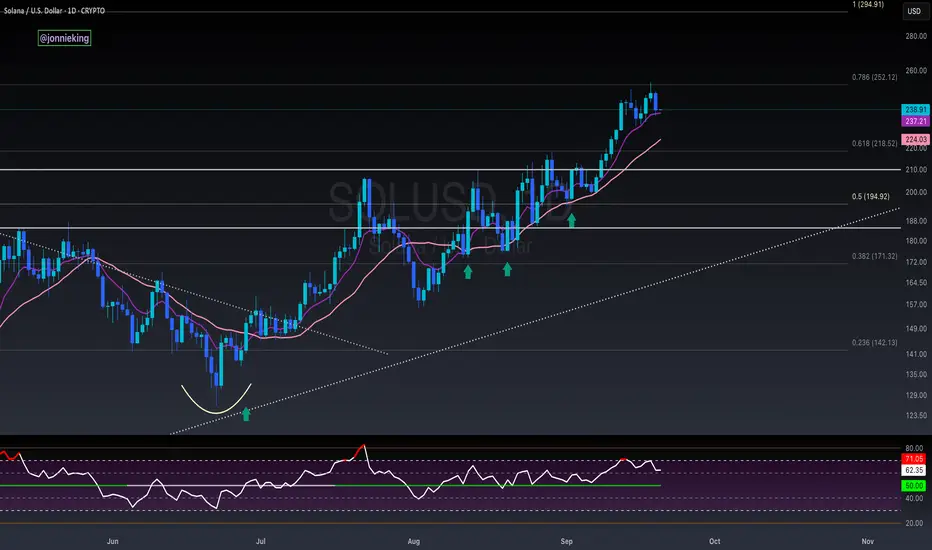
SOL Parabolic Run Despite the recent chop, when you zoom out to the 1D timeframe there is a clear pattern being followed since the April crash.
From the sub $100 low Solana has posted progressively higher lows in a parabolic fashion. The highs on the other hand are in more of a linear fashion as shown by the diagonal S/R level, at first it provided support and now since March it has been resistance.
So for me there are two possible actionable trades:
- Continuation of the parabolic move, this would include flipping the Diagonal S/R level, currently at time of writing this resistance level is being tested, a close above gives a better possibility of the rally continuing.
- The rally becomes exhausted and fails to flip the Diagonal S/R and loses the parabolic support level. Should this support break $185 is the first target (light green zone), $160 as the second target (dark green zone).
Important to remember we have CPI & FOMC rapidly approaching that could provide the volatility to trigger either of these moves, lets see what happens next.

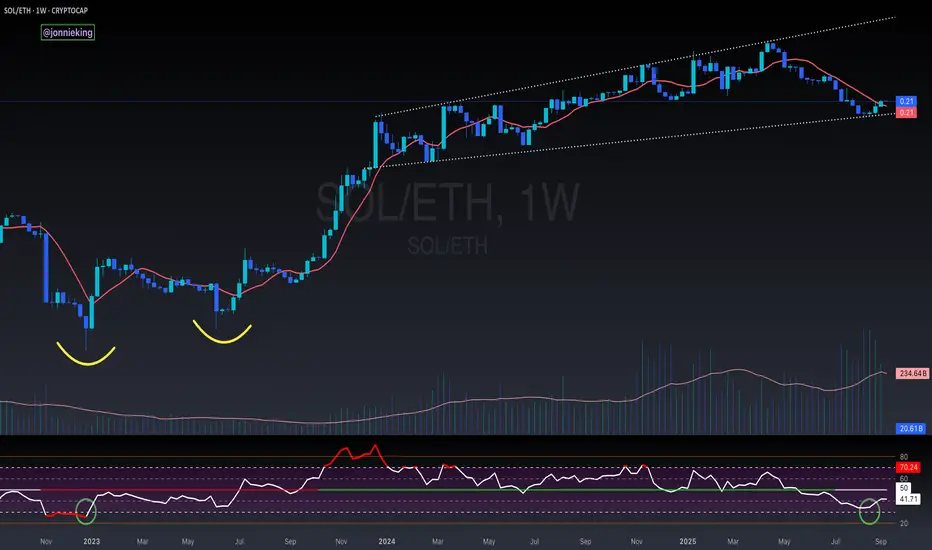
$SOL / $BTC 50WMA Reclaimed - Alt Season Confirmed!Ladies and Gentlemen,
CRYPTOCAP:SOL / CRYPTOCAP:BTC has officially closed the Week above the 50WMA and is back within the POI.
Double bottom confirmed this setup.
Along with the longest cup and handle I’ve ever seen lol.
Let the rotation for Alt Season begin!

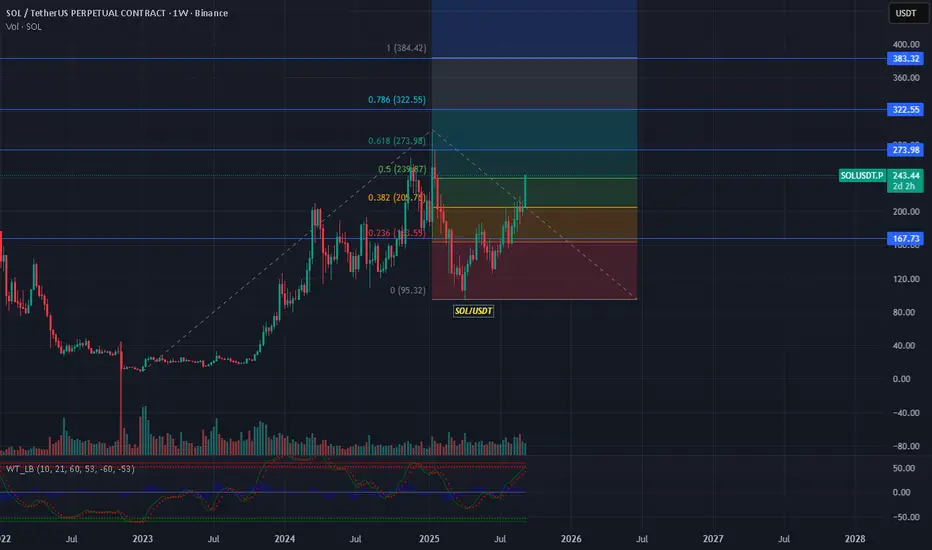
SOL/USDT Weekly Chart Analysis## 📊 Chart Overview
* **Pair:** SOL/USDT (Perpetual Futures, Binance)
* **Current Price:** \$243.44 (+18.01%)
* **Timeframe:** 1W (long-term trend)
* **Volume:** 147.8M (rising, signaling strong participation)
* **Indicators:** Fibonacci retracement, WaveTrend oscillator
---
## 🔑 Fibonacci Levels (swing low \$95.32 → swing high \$384.42)
* **0.236 Fib:** \$163.55 → strong support, successfully defended.
* **0.382 Fib:** \$205.87 → breakout level, now acting as support.
* **0.5 Fib:** \$239.87 → current zone, SOL is testing this level.
* **0.618 Fib:** \$273.98 → next resistance if \$240 holds.
* **0.786 Fib:** \$322.55 → heavy resistance zone.
* **1.0 Fib:** \$384.42 → previous high, potential long-term target.
---
## 📈 Price Action
* SOL has **broken above the \$205 level** and is now consolidating near **\$240**.
* The weekly breakout candle suggests **renewed bullish momentum**.
* Higher lows since the \$95 bottom show a **reversal structure** forming.
---
## 📉 Indicators
* **WaveTrend Oscillator (WT):**
* Currently moving upward, showing **bullish momentum**.
* Entering overbought territory, so short-term corrections are possible.
* **Volume:**
* A surge in weekly volume confirms **strong buying interest**.
---
## 🧭 Outlook
* **Bullish Case:**
* Sustained move above **\$240** opens targets at **\$274 → \$322 → \$384**.
* If momentum extends in a bull cycle, the Fibonacci extension could take SOL toward **\$500–\$560**.
* **Bearish Case:**
* If rejected at \$240–\$245 zone, price may retest **\$205**.
* Failure to hold \$205 could drag it back to **\$167** support.
---
## ⚠️ Risk Note
* SOL is at a **critical mid-Fib level (0.5 zone)**, which often acts as a **decision point**.
* Weekly close above \$240 will confirm strength, but if it fails, downside correction risk rises.
* Always track Bitcoin’s movement since SOL is highly correlated.
---
✅ **Summary:**
SOL is in a **bullish breakout phase**, reclaiming the \$240 zone. Holding above this level can accelerate a rally toward **\$274–\$322**, while failure may bring a pullback to **\$205–\$167**.
SOLANA (SOL/USDT) – TP: 170 - 252 & 295SOLANA (SOL/USDT) is currently trading at $130.17 after rebounding from a well-defined sell-side liquidity zone between $98 and $131. The recent weekly candle shows a strong bullish recovery (+22.93%), suggesting that liquidity has been swept and buyers are stepping in. This level has historically served as a key accumulation zone, and the bounce aligns with oversold conditions on the StochRSI, which is now curling upward — indicating growing bullish momentum. If price sustains above the $125–131 level, the next immediate upside target lies between $170 and $188, where prior supply and consolidation occurred. A confirmed breakout above this range opens the path toward a higher resistance zone between $254 and $295 — a region that aligns with unfilled inefficiencies and previous price distribution.
The ideal swing trade approach would be to enter on a pullback within the $110–125 range, set a stop loss below $98, and scale out at the $170 and $254 levels. This setup offers a favorable risk-to-reward ratio of approximately 1:3.5.
Trade Strategy Suggestion (Swing or Positional):
Entry: Ladder between $115–$125 on retrace
SL: $105–110 (below wick low)
TP1: $170–188
TP2: $254–295
Scaling Out: 50% at TG1, rest at TG2 or trail stops above $200
With macro tailwinds like renewed interest in Solana’s DeFi and meme coin ecosystems, institutional flow returning, and technical confirmation across multiple timeframes, this could be a high-conviction mid-term play for swing traders and positional investors alike.
🔮 Narrative & Fundamentals:
ETH L2 congestion → SOL gets transactional inflows
SOL’s DeFi, NFT, and memecoin activity resurging (e.g., SEED_WANDERIN_JIMZIP900:WIF , SEED_DONKEYDAN_MARKET_CAP:BONK ecosystem)
Institutional flow picking up (Grayscale SOL trust rallying)
SOL remains one of the fastest L1s with growing developer traction

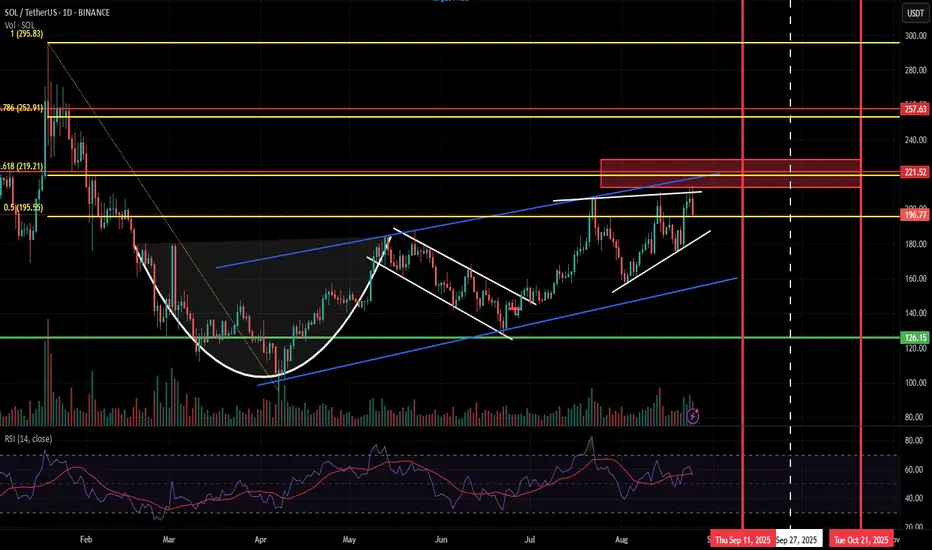
SOLANA (SOL/USD) C&H TG: 295 → 341→ 370 → 450 → 475 → 523SOL/USD is building a multi-year Cup & Handle on the weekly chart, signaling the potential start of a major long-term bull cycle. Price has reclaimed the breakout trigger at 218.50 and is heading towards the key breakout zone at 260–295. A clean weekly close above this zone can confirm a structural breakout and shift the market structure bullish on the higher timeframe.
Once confirmed, the long-term measured move points to 341–370 initially, followed by extended targets at 450 → 475 → 523. Any sustained hold above 260–295 will likely flip this zone into a strong demand base, supporting a multi-month uptrend.
Ideal strategy for investors: Accumulate gradually on dips near 218.50–230, add on confirmed weekly close above 260, and hold for long-term trend targets with a protective stop below 206 to manage downside risk.

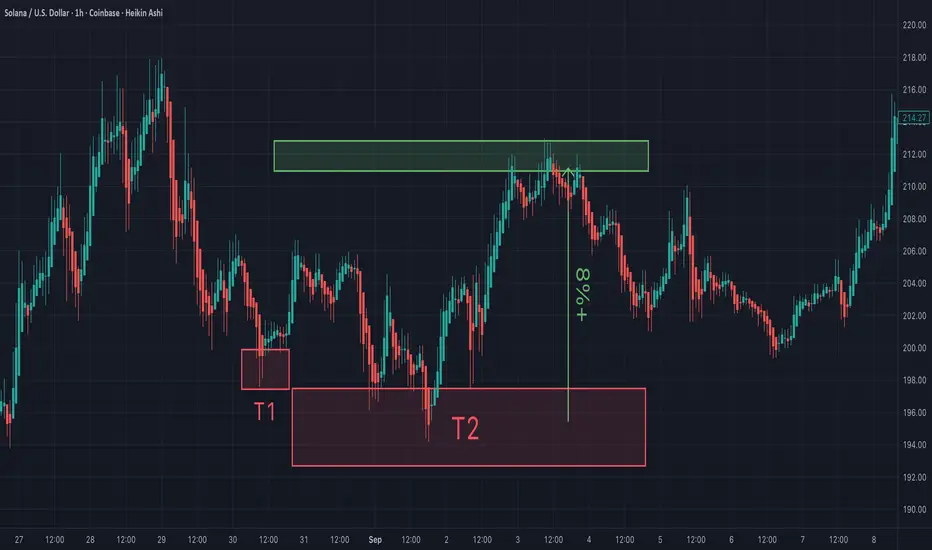
You will ask yourself, "how did he know Sol would do that"?On Aug 30th I posted Sol's support and resistance for my trades. I am grateful it played out perfectly.
One question remains...is Sol getting overheated, or going to continue to rip to the upside? I'd like to hear your thoughts?
May the trends be with you.
SOLUSDT Rallies: Heading Towards New HighsSOL is in a strong uptrend, with the support level at 225.00 USD having been tested and held. The price is currently aiming for 250.00 USD, with technical indicators signaling the continuation of this trend. The clear upward trendline and institutional inflows are strengthening SOL's bullish momentum.
Forecast:
If SOL maintains above the 225.00 USD support, there is a high probability it will continue to rise towards 250.00 USD.
Buy SOL when the price retraces to the 225.00 USD support zone.
Set a stop loss below 220.00 USD to protect your capital.
US Unemployment Claims data came in higher than expected, weakening the USD, which provides favorable conditions for SOL to increase in value. Additionally, Forward Industries completed a 1.65 billion USD fundraising deal to build the Solana Treasury, with participation from Galaxy Digital, Jump Crypto, and Multicoin Capital, providing a strong boost for the Solana ecosystem.

SOLUSDTThis is a bullish setup for BINANCE:SOLUSDT , but the $230 level is crucial for potential reactions. My strategy is to stay bullish and wait for the upcoming US CPI news, then decide whether to buy or sell CRYPTOCAP:SOL based on the news.
⚠️Ensuring your position size aligns with your risk tolerance.

SOLUSDT NEW TIMES COMING? Thank you for reading this update.
Solona looks to have a new incoming volume
Will this bring this volume Solana to $100 with time?
This volume depends on day trade and has no guarantees for the long term.

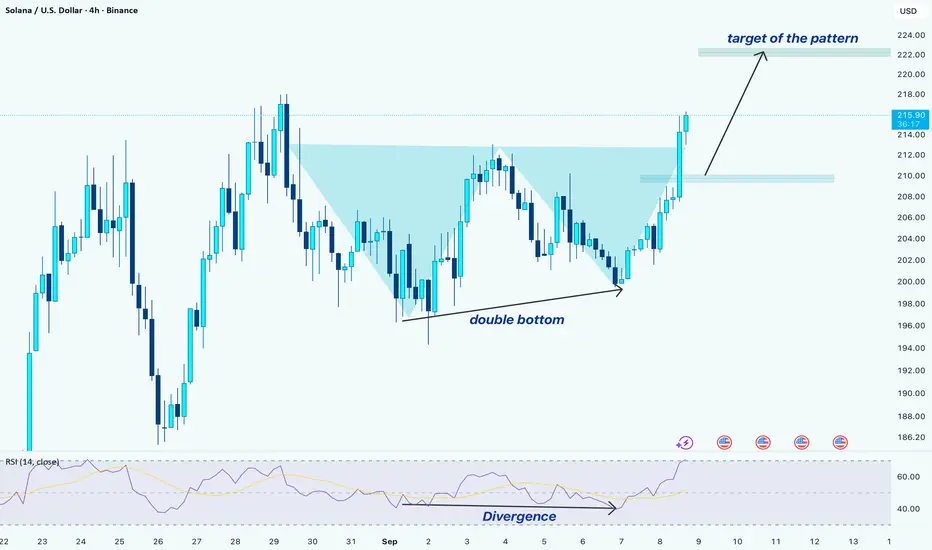
SOL/USDT –> Double Bottom Breakout with Bullish DivergenceHello guys!
Solana has completed a double bottom pattern and broken above the neckline, signaling bullish momentum. Here’s the breakdown:
1-Pattern Formation
A clear double bottom has formed around the $200 zone.
The neckline breakout happened at ~$213–214, confirming the reversal.
2- Momentum Confirmation
Bullish divergence on RSI supported the double bottom.
While price made equal lows, RSI showed higher lows → early sign of trend reversal.
3-Entry Options
Market entry
Pullback entry: Around the $210 area, in case of a retest of the neckline zone.
5- Target
The projected move from the pattern points to $222.
This also aligns with the next resistance area.
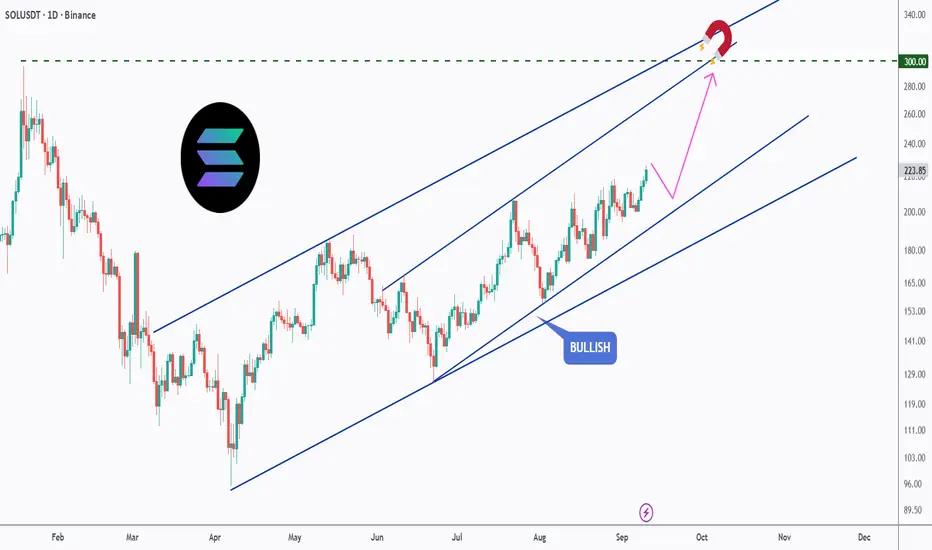
SOL’s Magnetic Path to $300!Solana has been steadily climbing inside a clean bullish channel, and the momentum is showing no signs of slowing down. The price action continues to respect higher highs and higher lows, keeping the bullish structure intact.
🟢 Bullish Channel: SOL is trading neatly within an ascending channel, confirming the trend’s strength.
🎯 Key Target: The $300 level acts as a magnet — a psychological resistance aligning with the channel’s upper boundary.
🔄 Healthy Pullbacks: Any short-term dips within the channel are being absorbed quickly, signaling strong buyer interest.
🚀 Upside Outlook: As long as SOL holds within the channel, the path of least resistance remains to the upside, with $300 as the next major milestone.
📌 Eyes remain on whether Solana can reach the $300 mark before the year’s end.
This is for educational purposes only, not financial advice. Always manage risk properly before trading.
📚 Stick to your trading plan regarding entries, risk management, and trade execution.
Good luck!
All Strategies Are Good; If Managed Properly!
~Richard Nasr
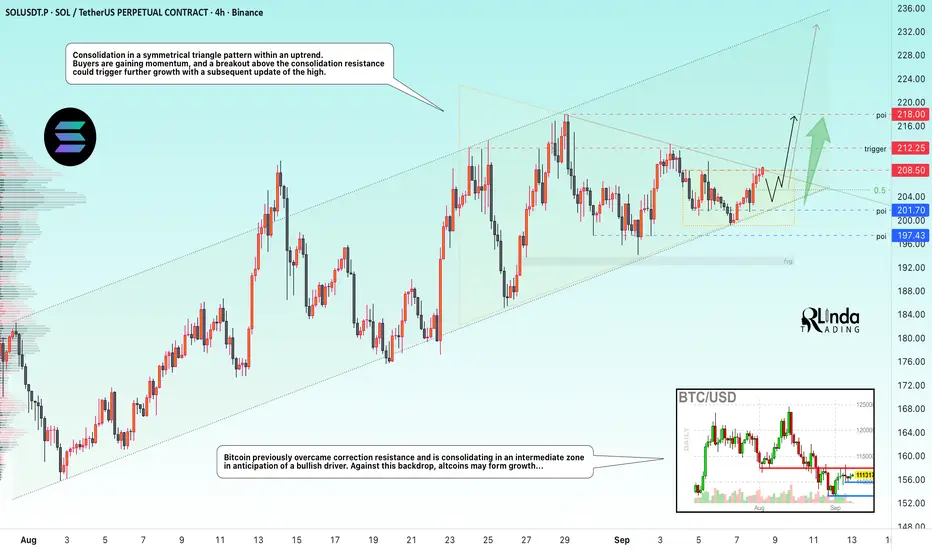
SOLUSDT → Consolidation before the rally. New high?BINANCE:SOLUSDT continues to form a bullish trend without reacting to market noise. The price is consolidating before a possible rise. Focus on the trigger...
Bitcoin previously overcame correction resistance and is consolidating in an intermediate zone in anticipation of a bullish driver, which could generally strengthen positive sentiment in strong altcoins. Against this backdrop, the market may form growth...
SOL is consolidating in a symmetrical triangle pattern within an uptrend. Buyers are gaining momentum, and a breakout of the consolidation resistance could trigger continued growth with a subsequent update of the maximum.
Resistance levels: 208.5, 212.25, 218.0
Support levels: 201.7, 197.4
Before the breakout and growth, a retest of the 205.0 - 201.7 zone may form, however, a breakout beyond the symmetrical triangle may trigger a spread. Growth targets may be 220, 245.
Best regards, R. Linda!
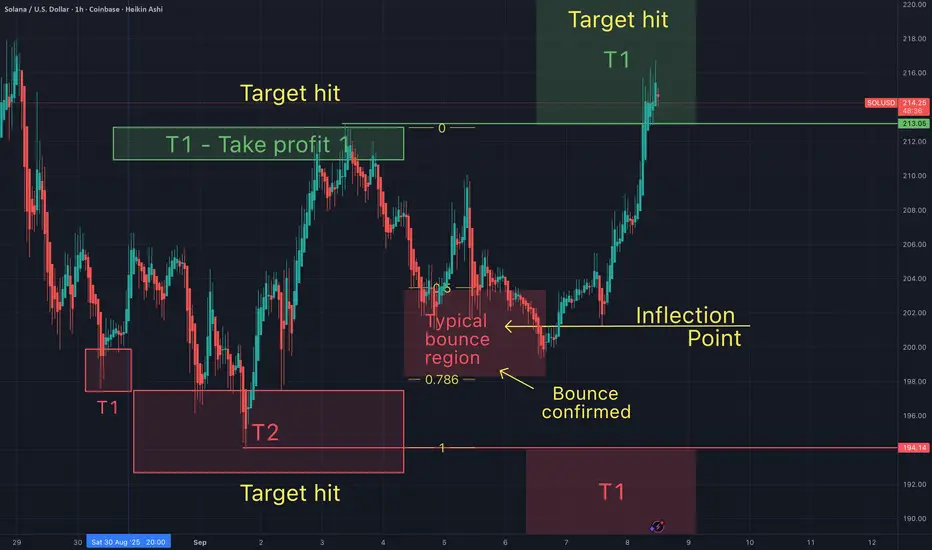
You will ask yourself how did he know Sol would bounce & hit T1?In my previous chart I suggested that Sol was approaching an inflection point, in a typical bounce region. That anticipated bounce would lead Sol to climb up to T1 above the preivous local high. That has now been confirmed.
What do you think Sol will do from here? I 'd ike to here your thoughts?
SOL - Solana +50% INCREASE Possible??SOL could be setting up for a big increase.
It's interesting to see how the price previously reacted around this resistance zone.
1️⃣ After a 100% increase, the price traded just around this zone for about 4 weeks when it dropped under, only to take another go at the zone 3 months later and get rejected again
2️⃣ second time increases by 63% in 3 weeks and the price shoots right through, after making a new high the chart went into a mini bearish cycle for a few weeks up until where we are now.
3️⃣ Price closes ABOVE key resistance zone, another high on the way in the next few weeks?
Capturing this zone is definitely bullish for Solana - now to see how far we can go but judging by previous increases, we could easily see a +50 if ETH increases as well.

$SOL / $ETH REVERSAL * ALT SEASON *🚨 The CRYPTOCAP:SOL / CRYPTOCAP:ETH REVERSAL has officially been confirmed.
✅ 3 White Solders
✅ Weekly close above 9WMA
✅ Broadening Wedge
Money is moving down risk, which brings outsized returns.