SOLUSDT → Stronger than the market. Correction before growthBINANCE:SOLUSDT updated its maximum to 218 and entered another phase of correction for consolidation. The altcoin looks quite strong against the backdrop of the rest of the cryptocurrency market...
Bitcoin continues its aggressive decline after yesterday's trap (false breakout of the trend line). Despite relatively positive fundamental and technical developments, the cryptocurrency market is in the red. Against this backdrop, SOL stands out as a strong altcoin compared to Bitcoin, which has been falling for two weeks. SOL updated its maximum and entered a correction phase. Within the current structure, the price may test the liquidity zone of 202.5 - 195.3 before continuing to grow to 220 - 240.
The reaction to false breakouts of local highs is weak, there is no reversal, and the nature of the current structure is “consolidation.” If the bulls keep the price above 200 during the correction, the further outlook will be positive.
Resistance levels: 216.5, 220, 244
Support levels: 202.5, 198.0, 195.3
Focus on the current correction. We need to wait for a slowdown and the end of the structure. Focus on the specified support zones, from which the market may resume bullish trading, which in turn may lead to a breakout of intermediate resistance and growth to the specified targets.
Best regards, R. Linda!
SOL

SOL Reclaims $207 – Can Bulls Push Through $212 Toward $224?Solana (SOL) is trading around $207 on the 4-hour chart, just under the key $212 pivot zone. In this video, we focus on today’s Solana/USDT analysis and walk through the levels that matter most: $207 and $212 as the pivots, $222–$224 as the next resistance, and $234 as the higher target if bulls stay in control. On the downside, support sits at $205, $201, $195, and the deeper defense at $178.
With Bitcoin showing bullishness and the U.S. Non-Farm Payrolls report released today, volatility is high across markets. In this Solana update, I explain how NFP, Bitcoin’s strength, and these intraday levels fit together to shape the next moves.

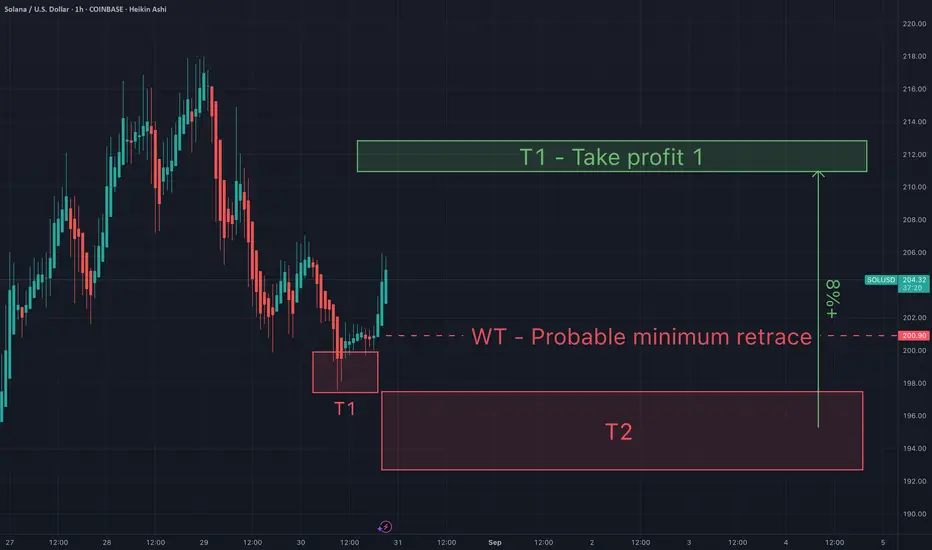
You will ask yourself "how did he know Sol would do that"?On Aug 30th I suggested that Sol was approaching my ideal buy zone at T2. I anticipated a bounce to my take profit target soon after. That played out perfectly.
Question remains...will T2 remain support? What do you think? I'd love to hear your thoughts.
May the trends be with you.

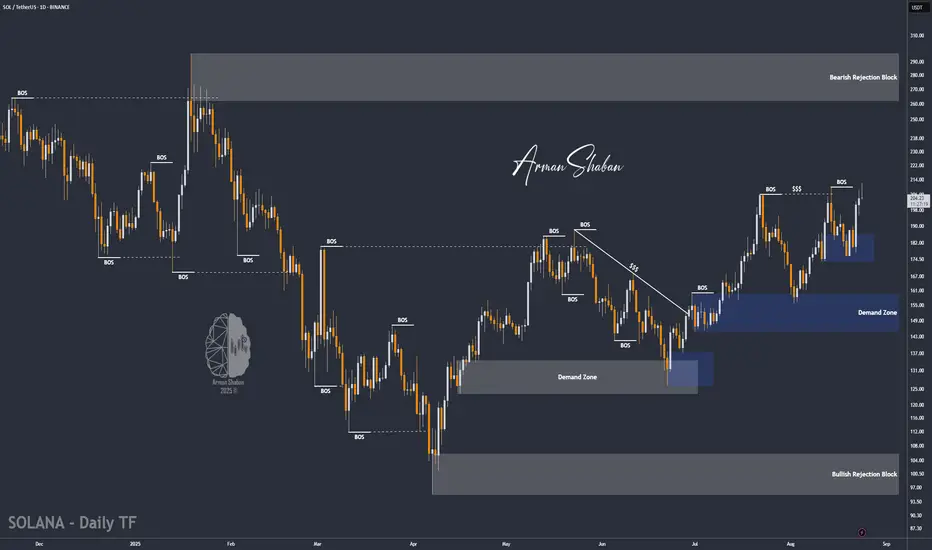
SOL/USDT | Is the Next Bullish Wave Coming? (READ THE CAPTION)By analyzing the Solana (SOL) chart on the daily timeframe, we can see that the bullish momentum is still intact, with the price currently trading around $207. I expect that after a short-term correction, we’ll likely see another bullish wave from Solana.
If the price resumes its upward move, the next potential targets are $218, $245, and $260.
Key demand zones to watch are $197–$204 and $173–$187.
Stay alert for reactions around these levels!
Please support me with your likes and comments to motivate me to share more analysis with you and share your opinion about the possible trend of this chart with me !
Best Regards , Arman Shaban

$SOL Rotation IncomingNow that the CRYPTOCAP:ETH hype has calmed,
it’s almost time for CRYPTOCAP:SOL
to rip the haters face off...
once again🎃

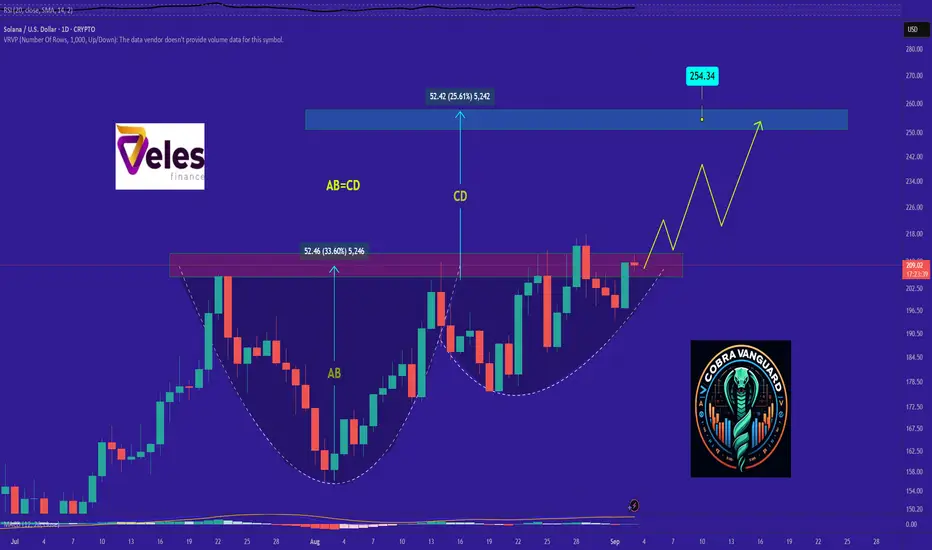
SOL's Situation, A Comprehensive Analysis !!!It appears that the price is forming a cup and handle pattern, and if this occurs, it could push the price above $215.
Best regards CobraVanguard.💚
Perfect Solana · Keep Holding · Too Early To Give UpSolana is in a perfect position. Notice the last four days that closed red. 29-Aug through 1-Sept. All these days of bearish action but no major drop. This is a marketwide bullish signal.
Marketwide because Solana is one of the big projects.
Solana is Crypto: What one does, the rest follows.
If Solana is set to continue growing, as it is shown by its massive strength, then we know the other projects that move together will do the same thing.
Some pairs can look weak and we don't know if they will continue to drop or instead reverse to start (resume) moving higher.
Seeing SOLUSDT and the perfect rising triangle; how easy Solana continues to move higher even while Bitcoin was experiencing strong bearish action, reveals what is happening behind the scenes.
Money is being shuffled around. Whales are loading up. The plan is being implemented and the resutls will be awesome.
Do you see a bullish chart here?
Does the drawings on the chart reveal the tendency and bias for this pair?
Look, the market can move lower of course, but we have a rising channel. Any drop will be bought.
Solana has much more to give. Too early to give up.
Thank you for reading.
Namaste.

SOL Swing Long IdeaSOL Swing Long Idea
📊 Market Sentiment
Overall sentiment remains bullish, supported by expectations of a 0.25% rate cut in the upcoming FOMC meeting. A weakening USD and increasing global risk appetite continue to create favorable conditions for further upside in crypto assets.
📈 Technical Analysis
The market aggressively broke the HTF bearish downtrend and closed above it on the daily timeframe. This indicates that price wants to move higher. Moreover, price also broke the HTF resistance level, which is now acting as HTF support.
📌 Game Plan
I already opened a long position since the setup is currently valid.
A possible retest around $196.5 could offer the best entry in my opinion.
📋 Trade Management
Stoploss: Daily close below HTF support at the $171 level
Target: $296 (All-Time High)
💬 Like, follow, and comment if you find this setup valuable!
⚠️ Disclaimer: This content is for informational and educational purposes only and does not constitute financial, investment, or trading advice. Always do your own research before making any financial decisions.

Solana -> a descending broadening wedgeHello guys!
A descending broadening wedge is forming, indicating a potential bullish reversal if price follows the typical pattern.
Pattern Analysis: Descending Broadening Wedge
The wedge is marked with two diverging trendlines, where the upper line is descending and the lower line slopes down but at a slower rate.
This pattern generally signals a reversal scenario, especially after a downtrend.
Price typically oscillates between the upper and lower trendlines before a breakout occurs.
Support and Resistance Levels
Immediate resistance: Near $205–207 (upper trendline of the wedge).
Support zone: Around $192–193, marked by the lower wedge line and a grey horizontal area, which historically acted as strong demand.
Price objective: Upon breakout, the target is around $212+, as indicated by the schematic at the top-left corner of the chart.

WLFI Launch At Ridiculous Valuation | Stablecoin ComparisonBINANCE:WLFIUSDT.P is a protocol affiliated with the Trump family and managed by Chase Herro and Zak Folkman - both with a notorious past with Herro reffering to himself as the 'scumbag of the internet'.
World Liberty Financial has a major product in USD1. As of today its the sixth larget stablecoin by supply. $2.4b circulating with increasing adoption. USD1 is the main product of WLFI.
In the video I compare WLFI and USD1 to its competitors in BINANCE:ENAUSDT and USDe, NYSE:CRCL and USDC.
With this comparison you see a massive overvaluation of WLFI at ~$23b compared to $2.4b supply of USD1. Relative to ENA at $9b with $12b USDe supply. Circle is $30b with $70b USDC.
This shows an extreme extra cost added to WLFI with no real current product to rationalise it. Not to say that there wont be new products or a major expansion of USD1.. only that its priced as if theyve already achieved it.

SOL - Retest the Zone, Reload the Longs!Solana continues to trade within a well-defined ascending channel on the daily timeframe. After a strong bullish leg, price is now pulling back toward the highlighted support zone, which also aligns with the lower bound of the short-term channel.
As long as this area holds, it offers an attractive spot to look for fresh long opportunities. A confirmed bounce here could set the stage for continuation higher toward the channel’s upper boundary.
The structure remains bullish, and dips into demand are where the best risk-to-reward setups lie. Keep an eye on this zone for the next move.
⚠️ Disclaimer: This is not financial advice. Always do your own research and manage risk properly.
📚 Stick to your trading plan regarding entries, risk management, and trade execution.
Good luck!
All Strategies Are Good; If Managed Properly!
~Richard Nasr

Sol - Support and resistance & take profit targetsSol - Support and resistance & take profit targets. Ideally Sol gets a retrace this weekend to my T2 so I can load up even more. Either way I'm taking profits at my green T1.
May the trends be with you.
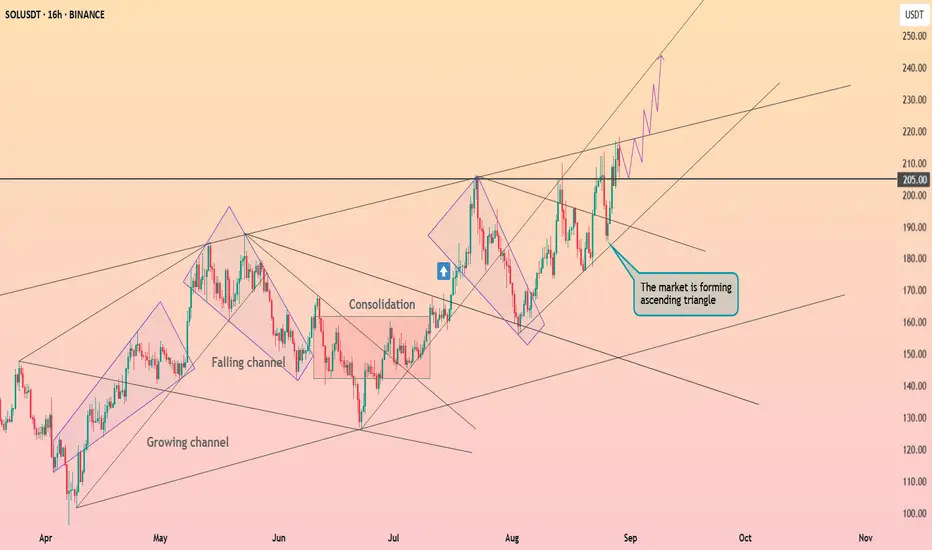
Solana is preparing to break through the resistance ┆ HolderStatBINANCE:SOLUSDT on the 16h chart is coiling inside an ascending triangle, with resistance aligned at 205. The structure suggests bullish continuation, as long as support at 185–190 holds. A breakout above 205 can target 230–240 next.
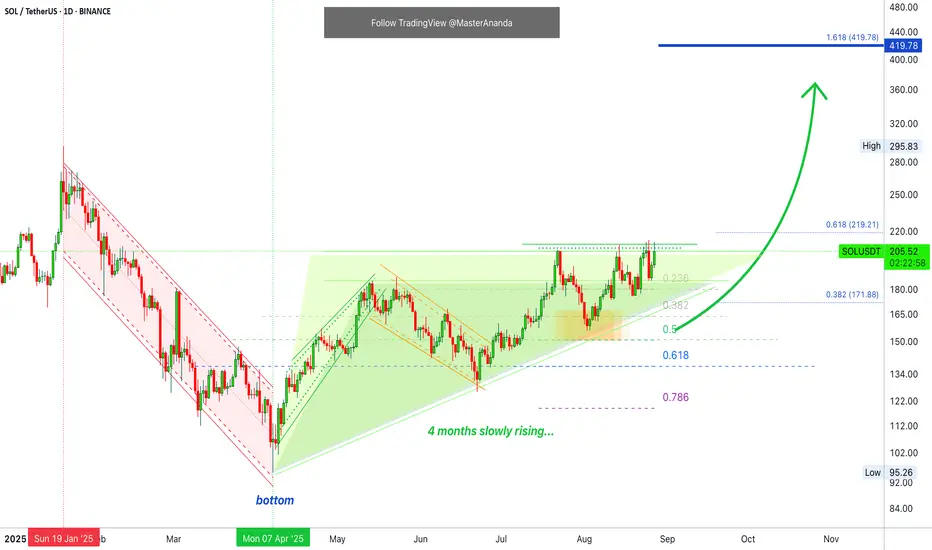
SOL — High Confluence Buy ZoneFrom 12th–14th August, SOL spiked into the 0.618/0.786 pitchfork resistance zone, where the best short entry presented itself. This rejection also marked the completion of wave 5 of the 5th Elliott Wave, confirming exhaustion in the $205–$210 zone.
After this sharp move, an imbalance has formed that typically gets retraced. When price spikes that quickly into resistance, it often gives the entire move back → meaning a return to the origin of the move. As price approaches this region, it becomes the prime zone for long re-entries.
🧩 Confluence Factors: 9
0.618 Retracement of the 5-wave impulse: $176.47
Daily level: $174.84
nPOC: $175.00
0.786 Trend-Based Fib Extension: $175.00
Anchored VWAP: ~$173.30
Sell-Side Liquidity (SSL): ~$173.50
Pitchfork 0.618 support: Aligning with this zone
Monthly Open (mOpen): $172.22 (major support)
0.786 Fib Speed Fan: Adding further structural support
🟢 Long Trade Setup
Entry Zone: $176.5 – $172
Best Entry: Around $175 (ideal ~ $173, confluence with liquidity + mOpen)
Stop-Loss: Below $167
Target: $219.21 (0.618 retracement of full move)
Potential Gain: +25%
R:R: 1:5+
Technical Insight
The 0.786 pitchfork rejection into wave 5 completion marked exhaustion at $205–$210.
Fast moves into resistance often retrace back to origin, opening the door for imbalances to be filled.
The $176.5–$172 zone clusters multiple technical supports, making it a high-probability long entry.
The mOpen at $172.22 and surrounding liquidity pocket stand out as the most ideal entry point.
With targets up to $219, the setup offers a strong +25% potential move with excellent risk-to-reward.
Key Levels to Watch
Support Zone: $176.5 – $172 (ideal entry ~$173)
Final Target: $219.21
🔍 Indicators used
DriftLine — Pivot Open Zones → For identifying key yearly/monthly/weekly/daily opens that act as major S/R reference points
➡️ Available for free. You can find it on my profile under “Scripts” and apply it directly to your charts for extra confluence when planning your trades.
_________________________________
💬 If you found this helpful, drop a like and comment!

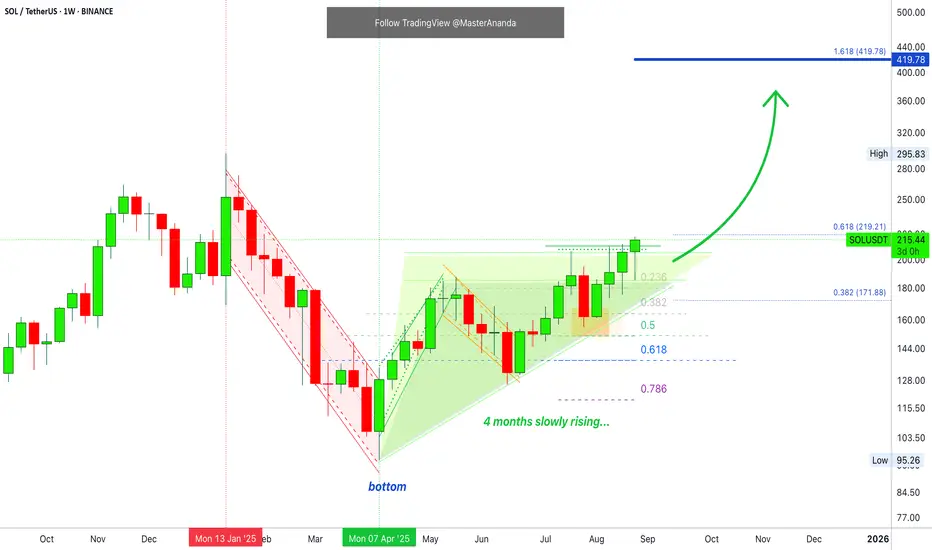
Alert! Bullish Explosion About To Unfold —You've Been Warned!Hey, remember that chart I've been showing you about Solana on the daily timeframe, the luxurious rising channel?
Well, this same drawing looks many times better on the weekly; I won't even have to convince you anymore. After seeing this chart, you will be sold. Solana is going up.
Technical analysis
Consider this chart, SOLUSDT weekly. Solana has been closing three consecutive weeks green. This is the fourth green week and here comes the best part; this week is reaching its end and Solana already went down (lower wick on the candle). Once the downside is taken care of, the bulls can resume with their growth.
Four consecutive weeks closing green as bullish consolidation can only mean that a bullish explosion is about to unfold. I can give you countless of signals, but follow and trust my words; the Cryptocurrency market is rising and what you are witnessing now is only the start.
You've been warned!
Namaste.
The key is whether it can rise above 237.60
Hello, fellow traders!
Follow us to get the latest information quickly.
Have a great day.
-------------------------------------
(SOLUSDT 1M Chart)
To understand the strangely drawn trendline, you need to refer to the StochRSI indicator.
This is because the StochRSI indicator was used to draw the trendline.
When the K indicator of the StochRSI forms a peak in the overbought zone, a trend line is drawn by connecting those peaks. When the K indicator forms a peak in the oversold zone, a trend line is drawn by connecting those peaks.
When drawn this way, the trend line drawn in the overbought zone becomes the high trend line, and the trend line drawn in the oversold zone becomes the low trend line.
However, due to the long timeframe of the 1M chart, the high and low trend lines are not separated and are instead displayed as a single line.
Of the three trend lines, we need to determine whether the upward trend can continue along trend line (1).
The DOM (60) indicator is forming at 237.60, so the key question is whether it can break above this level.
Illegible areas are marked with circles.
-
(1W Chart)
Looking at the explanation of the big picture below, a major bear market is expected to begin in 2026.
However, the trend lines drawn on the chart suggest that the upward trend could continue until the first quarter of 2026.
With time remaining until the end of 2025, we need to closely monitor BTC's movements.
The DOM (60) indicator on the 1M chart is at 237.60, so the key question is whether it can break above 237.60 and maintain its price.
However, the DOM (60) ~ HA-High range formed in the 202.45-222.61 range on the 1W chart, so whether it can find support within this range is crucial.
Accordingly, the volatility period on the 1W chart is the period around the week of September 29th, i.e., September 22nd to October 5th.
Please refer to the circled area on the 1M chart for the important period.
-
(1D chart)
This volatility period ends on August 29th.
The next volatility period will be around September 7th.
After the volatility period around September 7th, we need to see if the price remains above 195.92.
If the price remains above trendline (1), it is highly likely that an attempt to rise above 222.61 will occur.
---------------------------------
As mentioned earlier on the 1W chart, the key question is whether the price can rise above 237.60.
To draw a line, we need to examine whether the 202.45-222.61 range provides support and can move upward.
From this perspective, if the 202.45-222.61 range provides support, it's considered a buying opportunity.
However, considering the basic trading strategy, buying in the DOM(-60) ~ HA-Low range and selling in the HA-High ~ DOM(60) range is necessary, so we can see that this is actually a selling opportunity.
Therefore, executing a new purchase in the 202.45-222.61 range requires a short and quick response.
If you maintain a basic trading strategy, you can either sell in installments to gain psychological stability or choose to purchase additional shares when the 202.45-222.61 range provides support.
-
Some people argue that support and resistance aren't important, but rather whether the price will rise or fall.
Yes, I agree with this.
However, to move up or down, you need to understand the support and resistance points or ranges that serve as reference points.
If you can't distinguish between these, you won't be able to trade, regardless of whether the price is rising or falling.
Therefore, you need to evaluate how important the support and resistance points or ranges formed at the current price are.
If you don't understand this, you'll end up trading by buying late after the price has risen or selling late after the price has fallen.
-
Thank you for reading to the end.
I wish you successful trading.
--------------------------------------------------
- This is an explanation of the big picture.
(3-year bull market, 1-year bear market pattern)
I will explain in more detail when the bear market begins.
------------------------------------------------------

SOL/USDT | Solana Surges 43% – Is a 25% Bullish MoveStill Ahead?By analyzing the Solana (SOL) chart on the daily timeframe, we can see that the price held strongly above $171 as expected in our previous analysis and has already hit two major targets at $195 and $206, even spiking up to $212 — securing an impressive 43% rally so far! 🚀
After reaching this critical resistance zone, we’ve seen a wave of selling pressure, and SOL is currently consolidating around $204. As long as the price remains above $193 and doesn’t break below it, the bullish momentum is likely to continue, with renewed demand driving the next leg up.
The upcoming bullish targets are positioned at $220, $245, and $260, offering a potential short-term upside of over 25%.
Please support me with your likes and comments to motivate me to share more analysis with you and share your opinion about the possible trend of this chart with me !
Best Regards , Arman Shaban
Solana seeks to the $220 ┆ HolderStatBINANCE:SOLUSDT on the 6h chart shows a rebound after a -23% correction, confirming higher support around 170. The price structure remains bullish inside the ascending channel, and the focus is on resistance near 213–215. Buyers continue to step in on dips, maintaining the larger uptrend.

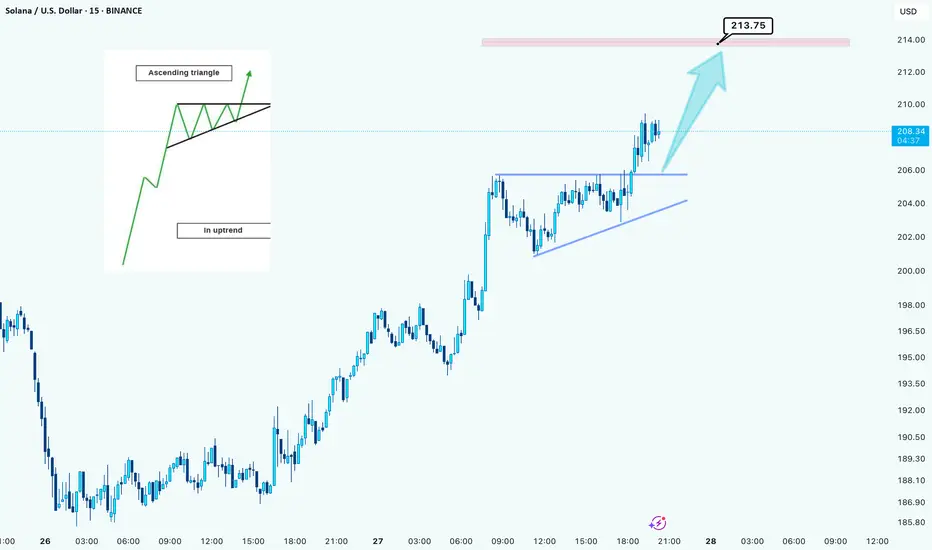
Solana Breaks into an Ascending Triangle – Bullish Continuation Hello guys!
The chart shows Solana (SOL/USDT, 15m timeframe) forming a classic ascending triangle pattern during an ongoing uptrend. The upper resistance level around $206 has been tested multiple times, while the rising trendline from the bottom confirms consistent buying pressure and higher lows.
This setup is a textbook bullish continuation signal, where buyers gradually squeeze sellers against a flat resistance until a breakout occurs. The breakout has already taken place, with SOL pushing above the resistance zone and heading toward the next key target around $213.75, which aligns with the projected move from the triangle’s height.
As long as price holds above the broken resistance (now support), momentum favors further upside. If bulls maintain control, we could see a continuation toward higher resistance zones. However, a drop back below the rising trendline would weaken the setup and signal caution.
most important levels:
Support (retest zone): $206
Immediate target: $213.75
Next potential resistance: above $214
Overall, the breakout from this ascending triangle suggests bullish momentum remains strong for Solana in the short term.
SOL - Time to buy again!The price has finally broken this bullish pattern and now is the time for the price to rise to $250.
PREVIOUS ANALYSIS

SOLANA to $600Solana held $123 as support on the monthly timeframe, with the next resistance at approximately $640 in November.

TOTAL - total cap crypto "this looks bad," Not saying I've done trivial work in effort to determine the end of an Elliott wave phase peak; so, the chart looks like an Elliott wave does it not? The previously major halving did not have a similar chart where an Elliott wave 1,2,3,4,5 happened. This time it does look like that. Is it possible to have 6,7 phase inclusive to the chart albeit from the idea that Elliott wave means nothing to the new community of virtual currency digital money defi tropes meme derivative foreplay variable online meta landscape of the future? If I was betting on history repeating itself and the looks of the chart here for all cryptocurrency I would say this is not good looking for me, a guy who has made literally no money on cryptocurrency since the last halving despite trying so many times. The world is against me, the trends are fake, the people in society are all brainwashed by propaganda war machine rhetoric political asylums and the minority reports of mainstream majority peoples. Why now? Why not? I'm not looking forward to losing more money then I already have. I haven't made money. Online news doesn't help. Content creators don't help. My family does not help. These indicators which I feel I have a strong understanding of, do not help. Cryptocurrency is too volatile and unpredictable in ways that prevents mathematical decision making becoming profitable. The major players that control the phases of time are established based on the backs of working class people, and savings. We created a monster(s). Now those monsters are eating cryptocurrency for lunch. Cryptocurrency ≠ main course.

Solana · At The Top of The RangeI've been looking at many charts and seeing a repeating pattern; many pairs are trading right at resistance, at the top of the range.
This same rising triangle we see on SOLUSDT was present in another pair, and many other charts look similar.
The altcoins market is pushing higher, trying to break a local resistance zone. You know what happens when this level breaks don't you? Wave 3 of the bullish cycle, normally the strongest wave, starts.
Wave 5 is still missing of course but it normally tends to be an extension of the third. Sometimes wave 5 can become much bigger than wave 3 but right now we still don't know how things will develop in this current bullish cycle. In general, wave 3 is always the strongest one.
So there is the possibility that we are right in front of the strongest period of bullish action in the entire 2025-2026 Cryptocurrency bull market.
Summary
Solana is going up. Even if prices drop, the end result of the drop would be a higher low, which implies higher prices next.
Regardless of the short-term, SOLUSDT is set to move higher. This statement is supported by market data.
Thank you for reading.
Namaste.