$SOL 1D update: Things are looking up SOL is still in the process of breaking out of the broader downtrend, even though the move hasn’t been clean or impulsive yet.
After spending months respecting the descending channel, price has now pushed out of the lower boundary and is holding above the $125 area, which was previously acting as key support inside the downtrend. That’s an important structural shift. Instead of making fresh lower lows, SOL is now forming higher lows and building above former demand.
The recent push toward the $135–140 area shows buyers are willing to step in earlier, rather than waiting for a full return to the lower channel. While price is still below major resistance near $160–180, the character has changed from trend continuation to basing and early breakout behavior.
This doesn’t mean SOL is in a confirmed uptrend yet. Breakouts from long downtrends are often messy, with overlap, pullbacks, and false starts. What matters is that downside follow-through has stalled and price is no longer accelerating lower.
As long as SOL continues to hold above the $125 level and avoids slipping back into the channel, the bias remains that this is an early trend transition rather than just another dead cat bounce. The next key test will be whether this breakout can hold on retests and eventually reclaim higher resistance, but structurally, SOL is still breaking out of the downtrend.
SOL

SOLANA - retest resistance of the trading range BINANCE:SOLUSDT has been rising since the session opened amid a weak market. The altcoin is showing bullish momentum in a predominantly bearish market, with a focus on the 145.0 zone.
Bitcoin is rebounding from resistance amid a global downtrend. There is currently no bullish potential (across the entire market), which is putting pressure on altcoins overall.
SOL, against the backdrop of a neutral market, is seeking to test the resistance zone of 144.7 - 146.0 - a key liquidity zone that plays an important role for MM in the current circumstances.
A short squeeze and the formation of a reversal pattern could shift the imbalance towards sellers, which in turn could lead to a decline.
Resistance levels: 143.4, 144.7, 146.0
Support levels: 134.3, 127.55
Solana is trading in a neutral trading range of 145.0 - 123.0. The main trend is bearish. The bullish run and retest of resistance can be perceived as a hunt for liquidity. We are interested in the above-mentioned resistance zone and confirmation in the form of a false breakout to enter the market.
Best regards, R. Linda!

SOL - tiny upward wiggle detected Alright folks, here’s the tea: BTC is still dreaming of that sweet 100K, and I’m not planning any panic moves downward… but hey, the market can be spicy, so don’t quote me.
SOL, on the other hand, looks like that snack you didn’t know was in the fridge—juicy and ready to be devoured. 🥤
• Support is chilling right beneath us like a comfy couch.
• Quick bounce off the 50 EMA, because SOL apparently likes to stretch in the morning.
Could this work? Maybe. Could it go sideways like my motivation on Monday? Also maybe.
TL;DR: SOL doing a mini dance, BTC still dreaming big, and we all hold onto hope (and stop-losses). 💃📈

TOP Altcoins for 2026 ~ ALTSHappy New Year 🥂
Here's a quick glance at my TOP 5 alts of choice for 2026, and why.
💭Injective (INJ)
Fast, interoperable DeFi infrastructure. Active development and a clear use-case in scaling decentralized trading.
💭Illuvium (ILV)
Prioritizes high-quality gameplay and steady development, backed by a solid revenue model.
💭Solana
ETH competitor, SOL is approaching some great buy zones that can have big bounces:
💭Origin Protocol (OGN)
Focuses on tokenized commerce and NFT marketplaces, making it easy for creators and brands to build decentralized storefronts.
💭Audius (AUDIO)
Decentralized music-streaming platform giving artists more control and growing consistently in real-world adoption.
Which alts are you watching for this year?

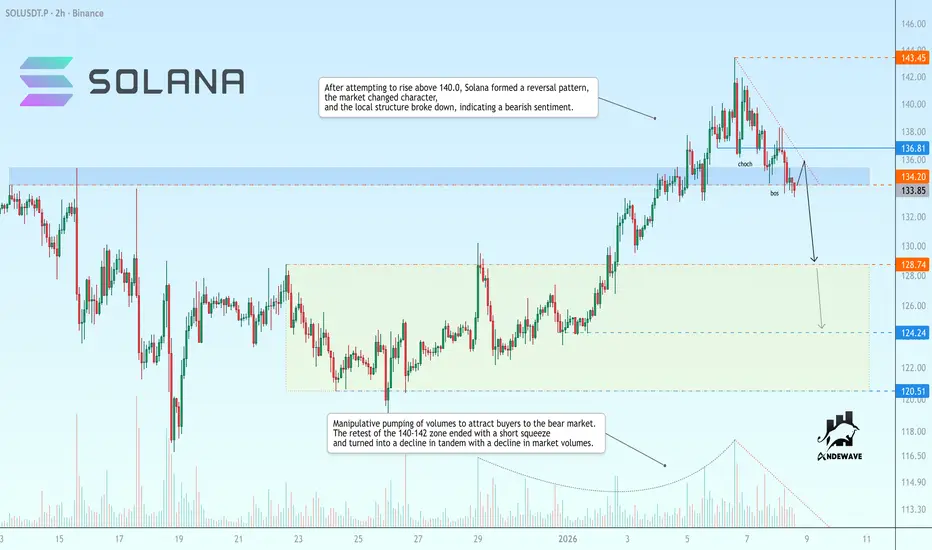
SOLUSDT is poised to break support before falling Manipulative pumping of volumes to attract buyers to the bear market. The retest of the 140-142 zone ended with a short squeeze and turned into a decline in tandem with a decline in market volumes
After attempting to rise above 140.0, Solana formed a reversal pattern, the market changed character, and the local structure broke down, indicating a bearish sentiment.
If the coin closes below 134, the market may intensify the sell-off and decline to 128.75 - 124.25
Scenario: A retest of 134.2 - 136.8 may confirm market weakness. If the price consolidates below this area, it may cause further price decline
SOL / USDT – Weekly OutlookPrice is currently reacting around a key horizontal level (~135–140) that previously acted as both support and resistance.
On the weekly timeframe, this level is critical:
A weekly close above this zone → confirms a R/S flip, opening room toward 160 – 180.
Failure to hold → increases chances of a pullback toward 120 – 110 support.
Market structure is still range-bound, so patience is key.
Let the level confirm before committing — weekly closes matter here.
Bias: Neutral → Bullish only after confirmation.
What do you think — will SOL flip this level or reject again?
👍 Like & 💬 comment if this helps — follow @mrctradinglab for more clean level-based setups.
MrC

Coinranger|SOLUSDT. Big potential reversal from 141News at 16:15 PM and 18:00 UTC+3 could add volatility.
🔹Solana has reached exactly the first extension at 141 on h4. And this is a serious point for a potential reversal.
1️⃣I'll leave 141 above as a reminder of micro rally.
2️⃣ A set of downward waves with potential extensions: 131, 130, 125, 120.
We'll likely move to 130 today or tomorrow.

SOL (Y26.Video#1).2 scenariosHi Traders,
My thoughts on Solana with 2 possible Elliott wave counts on the macro.
Is this a releaf rally or bottom is in.?
This question applies to BTC as well.
I'm leaning towards wave 4 as this bounce.
Please give me a like and share.
Regards,
S.Sari

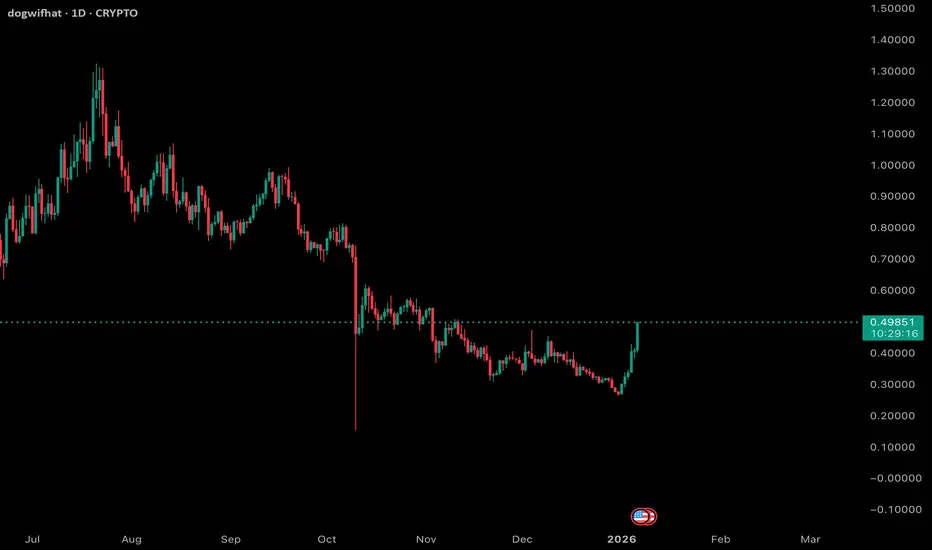
$WIF 1D Update: The pump is starting... SOL memes coming back? WIF is finally starting to show some strength on the daily. After a long period of basing and grinding near the lows, price is now pushing higher with an impulsive move rather than another weak bounce. That’s a meaningful change in character compared to what we’ve seen over the past few months.
This pump is coming after extended compression and seller exhaustion, which is typically where sharper relief moves can originate. The reclaim of the recent range highs suggests buyers are stepping in with more conviction, not just short covering.
That said, this is still early. One green candle doesn’t flip the higher timeframe trend by itself, but it does shift the short-term bias from purely defensive to cautiously constructive. If price can hold above this breakout area and avoid immediately retracing the move, it increases the odds that this is more than just a dead cat bounce.
Overall, WIF is looking better than it has in a while. I’m watching closely to see if this strength can build into follow-through and higher lows rather than fading back into the prior range.
SOL Short-term analysis | Trading and expectationsCRYPTOCAP:SOL
🎯Price caught a strong bid moving bullishly above the daily pivot but struggling at the High Volume Node resistance. Wave 1 of a new motif wave appears to be underway with an inital target of the daily 200EMA.
📈 Daily RSI has bearish divergence, price must get above $145 to negate this or face further downside.
👉 Analysis is invalidated below wave C, $110
Safe trading

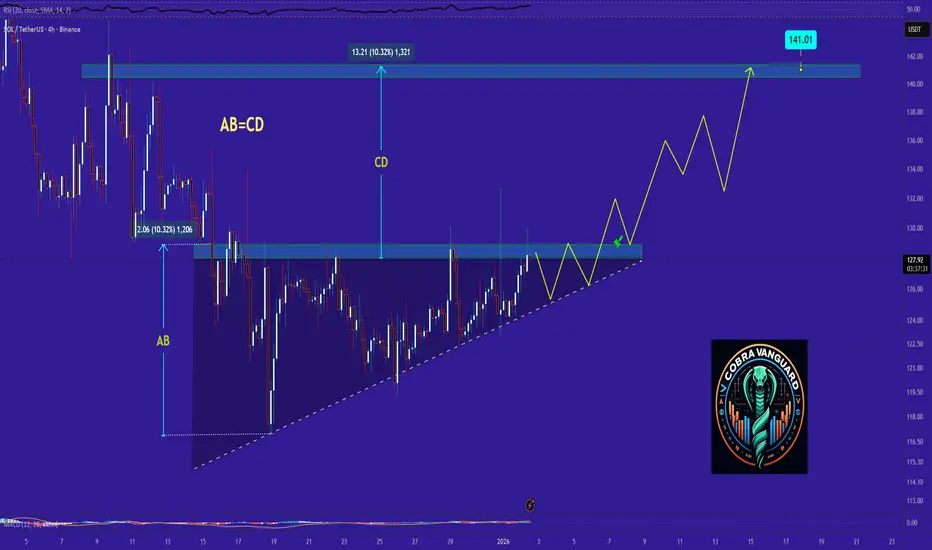
SOL road map (4h) !The price on the 4h timeframe is within an ascending triangle, which can be promising. If the price breaks this pattern with bullish candles, it could easily rise by the distance of AB=CD.
Best regards CobraVanguard.💚
Give me some energy !!
✨We spend hours finding potential opportunities and writing useful ideas, we would be happy if you support us.
Best regards CobraVanguard.💚
1W WIF Chart: Potential bottom on WIF? I’m watching WIF cautiously on the weekly, but it’s now firmly on my radar for a potential bottoming process, along with other SOL ecosystem meme coins.
After a prolonged and aggressive downtrend from the highs, downside momentum has slowed materially. Price is no longer cascading lower and is instead compressing near the lows, which is often how these assets begin transitioning from distribution into early accumulation. This isn’t a reversal yet, but it is a change in behavior.
Structurally, WIF is spending time building value near the bottom of its range rather than bouncing and failing immediately. Volatility has contracted significantly compared to prior selloffs, and each push lower is attracting quicker responses from buyers, even if they’re still cautious.
I’m not assuming this is a bottom, but this is the zone where bottoms typically form if they’re going to form at all. The key for me will be time and confirmation: higher lows, reduced sell pressure, and eventually a reclaim of prior weekly resistance. Until then, patience is critical.
This same dynamic is starting to show up across several SOL meme names, which makes it worth monitoring as a group rather than in isolation. For now, this remains a watch-and-wait situation, with risk management front and center and no need to force exposure before the structure proves itself.

SOL Macro analysis | The bigger picture | Long-term holdersCRYPTOCAP:SOL
🎯 Sol has been holding up significantly well with only a shallow retracement to the 0.382 for wave A of 4. A running flat correction appears complete at the Fibbonaci 0.236, weekly 200EMA and High Volume Node. Wave 5 has a target of the R3 weekly pivot at $462, but I expect this to overextend due to the shallow pullback to the R% pivot at $660.
📈 Price is above the weekly 200EMA, which is bullish, but below the pivot, which is bearish, giving the overall pattern ambiguity. Weekly RSI is bearish with room to fall, but doesn’t often reach oversold.
👉 Analysis is invalidated if price falls below wave A, $90
Safe trading

We LOVE this indicator!Our Power Band Oscillator Pro has been a real game changer for picking tops and bottoms and determining exhaustion levels, whether you’re already in a trade or looking to enter one. This is a great example of a recent short position we took on Bitcoin. Hopefully, this explanation shows why we see so much value in the Power Band Oscillator, which has taken us over six months to build and perfect.
Happy Trading!

Solana’s Not Done Yet — Hitting 136 Soon?🚀 Solana Update | TF 15M
Hey everyone! 👋
In my previous post, my targets were:
🎯 127.50 & 130
Before SOL reached the first target, it dipped slightly below my old cancellation zone. But that didn’t break the long picture it actually strengthened it 💪.
🔥🎯New targets:
➡️ 132
➡️ 135
➡️ 136 😎
❌New cancellation zone: 126.85
Two possible scenarios for this move:
🟢 Green arrow path
🟣 Purple arrow path
⚠️ Disclaimer: Not financial advice — just my personal view. Trade responsibly!
💖 If you like this, hit follow & react to support! Every ❤️ helps!

SOLANA: This Gigantic Formation is Going to Blast Through Roof.Hello There,
welcome to my new analysis about SOLANA on the weekly timeframe perspective. As a believer in the cryptocurrency revolution, I am sure the adoption of large-scale crypto networks is going to spread continuously throughout this year. We can already see more and more financial intermediaries adopting cryptocurrencies like SOLANA. This is also reflected by the SOLUSD price and crucial adoption factors such as Western Union also adopting this network. In my analysis I focus on the underlying factors that drive these changes in the financial ecosystem.
Especially at the beginning of 2026, there was a record high of whales accumulating more and more SOLANA to prepare for the major market disruptions that are likely to happen. Such actions are always made before the big public gets aware of it. Therefore, it is highly important, as a trader in the market, to appropriately prepare for any such significant and influential developments. Currently, SOLANA is already within the top 10 of cryptocurrency market cap coins. This can quickly change when more and more whales move into this market to push the bullish buttons before the large public gets aware of it.
The whitepaper already states that SOLANA is a high-performance blockchain that was designed to process up to 710,000 transactions per second, though real-world throughput typically ranges from 2,000 to 3,000 TPS. It is not unlikely that under such conditions more and more adoptions from smart money will happen in the next times. These factors are crucial for examining the actual real price action outcomes setting up for SOLANA at this moment. If this adoption goes forward in the upcoming times, we will see other whales also moving into the coin.
From a technical perspective, SOLANA is trading within this gigantic uptrend situation in which it is forming several crucial technical formations. The most important one currently is this massive bull flag formation. This formation is already in the middle to later stages of completion. The wave count within the formation is already forming the final wave C. This completion of the wave count will reach strong supports within the bullish confluence zone marked in my chart, supported by the lower boundary supports as well as the 200-MA.
Once SOLANA bounces in this area, it will be a highly determining move and crucial for the whole upcoming prospect, which should be expected. Especially when there are a lot of bullish acquisitions and the large wallets moving into the market, we can be sure that a bounce from this zone will likely confirm the whole bull flag formation. Such a confirmation will drive the price action into spheres never seen before. When considering an altcoin-focused approach in the market, this will definitely be an important underlying setup to consider.
With this being said, it is great to consider the important trades upcoming.
We will watch out for the main market evolutions.
Thank you very much for watching!

SOL 1D Update: Looking good here I was initially leaning toward SOL pushing lower within the broader descending channel, especially with price continuing to respect the downtrend structure and failing to reclaim prior resistance. The expectation was for another sweep toward lower channel support before any meaningful bounce.
However, price action is starting to shift. Instead of continuation lower, SOL is showing responsive buying around the $125 area and is now pushing higher, breaking the short-term pattern of lower highs. This move looks more impulsive than the prior bounces, which suggests demand is stepping in earlier than expected.
The $125–130 zone is acting as an important pivot. Holding above this area keeps the door open for a larger relief move. If this push sustains, the next area to watch is the mid-channel and then the $160–180 region, which lines up with prior consolidation and resistance.
While the higher timeframe downtrend has not been fully invalidated yet, this pump shifts the short-term bias from expecting downside continuation to respecting the possibility of a deeper corrective rally. I’m adjusting with price and watching to see if this move can build acceptance above support rather than fade immediately.
This is a good reminder that strong trends can end with a whimper, not a final flush, and price strength should be respected when it shows up.

Solana (SOL) — 15m Local Bullish StructureHello, friends!
How did you celebrate the New Year? 🎉
I wish everyone a productive and profitable 2026!
I haven’t posted ideas on TradingView for a few weeks, but I’ve decided that starting from the very first day of 2026, I’ll be sharing ideas daily.
So here is my first one:
Despite my previous bearish outlook, Solana looks quite positive on the local timeframe right now 🐂
After a small pullback to the 124.76 area, I’m considering long positions.
🎯 Targets:
• 127.5
• 130
❌ Invalidation:
Any touch of 124.69 fully invalidates this setup.
As always, manage your risk and stay tuned for updates. 🚀

The process itself remains the most valuable guideOne of the aspects of this form of analysis that I genuinely enjoy, but which I know can be frustrating for others, is that there are moments when the pattern appears to be communicating something very clearly…yet price refuses to cooperate with that viewpoint. When that happens, my focus immediately shifts to why. What am I missing? That process doesn’t disillusion me, it fascinates me. Because sooner rather than later, the market provides the answer, and every time it does, there is something to be learned.
In the case of Solana, the pattern appears to be saying exactly what the arrows on the chart are suggesting. And yet, I currently have no price-based evidence to support that interpretation. Price has not advanced in any meaningful way, has not challenged important resistance areas, and has not begun to break apart the broader downside structure. There’s a disconnect that cannot be ignored.
A misinterpretation of the pattern in my analysis?
A lack of patience on my part? My process is to become self-inquisitive.
Structurally, I can identify all the constituent waves necessary to consider the decline complete, and price has reached the Fibonacci extensions that would typically signal the end of such a pattern. Under normal circumstances, that would already have produced a response to the upside.
So, for now, patience is required. In the days ahead, the market will either reveal why this pattern is not cooperating with my current perspective, or it will begin to deliver the subdivisions that should accompany a completed decline. Either outcome provides clarity. Until then, the process itself remains the most valuable guide.

SOL/USDT | What is Solana doing? (READ THE CAPTION)By analysing the daily chart of SOL CRYPTOCAP:SOL , we can see that it is still struggling to make a move back up, currently being traded at 123.50. If this continues, a drop to 105 doesn't seem that far off.

SOLUSDT – Double Top Rejection Signals Short-Term WeaknessHi!
SOLUSDT is showing clear signs of short-term exhaustion on the chart. Price was rejected twice from the same resistance zone around 125, forming a classic double top structure. After the second rejection, the ascending trendline that supported the recent move was broken, confirming a loss of bullish momentum. This breakdown increases the probability of a corrective move toward the horizontal support near 122.3–122.0, which aligns with prior structure. As long as the price remains below the broken trendline and resistance zone, downside pressure is favored. A reclaim of the trendline would invalidate this bearish scenario.

SOL: The Equilibrium StandoffSOL sits at $124.66 in pure equilibrium, not discount, not premium, just stuck. The market structure isn't signaling a breakout; it's signaling a standoff. With volume 41% below average and momentum indicators in conflict, this is a wait-for-resolution setup, not a chase-the-move trade.
1. THE TECHNICAL REALITY 📉
• Price trapped between discount zone ($124.25) and premium ($139.33)
• Bearish swing trend with weak conviction (ADX only 18.1)
• Wick analysis shows war zone: 46.7% lower wick (support) vs 42.7% upper wick (rejection)
• Volume at $1.47M vs $2.51M average, smart money isn't showing up
2. THE INDICATORS ⚖️
Bearish Signals:
• Stochastic screaming overbought at 90.3
• Bearish order block overhead at $128.74 (key supply zone)
• Volume 41% below normal, no institutional confirmation
Bullish Signals:
• MACD just flipped bullish (0.2262 vs -0.0791)
• RSI neutral at 60.8
• MFI neutral at 48.8
The Conflict:
Stochastic overbought while MFI stays neutral, that's momentum divergence. When indicators can't agree, the current move is running on fumes, not fuel.
3. THE TRADE SETUP 🎯
🔴 Scenario A: Rejection & Retest (Higher Probability)
• Trigger: Rejection at $128.74 bearish OB
• Entry: Breakdown below $123.42 (FVG fill)
• Target: $119.15 swing low support
• Stop: 4H close above $128.74
🟢 Scenario B: Structure Flip (Lower Probability)
• Trigger: Reclaim of $139.33 premium zone
• Entry: 4H close above $128.74
• Target: Change of Character (CHoCH) bullish
• Invalidation: Rejection back below $128.74
MY VERDICT
62% confidence bearish lean. Setup favors rejection at resistance into support retest, but weak trend strength (ADX 18.1) means this could chop sideways before resolving. I'm not forcing trades in low-conviction environments, risk management is the difference between chess and checkers.

Is Friday May 1st 2026 is the Bottom of the Alt Market?Is History repeating itself?
Is 8 Month on Friday May 1. 2026 the next low in Alts?
Are we following the same setup as 2021?
