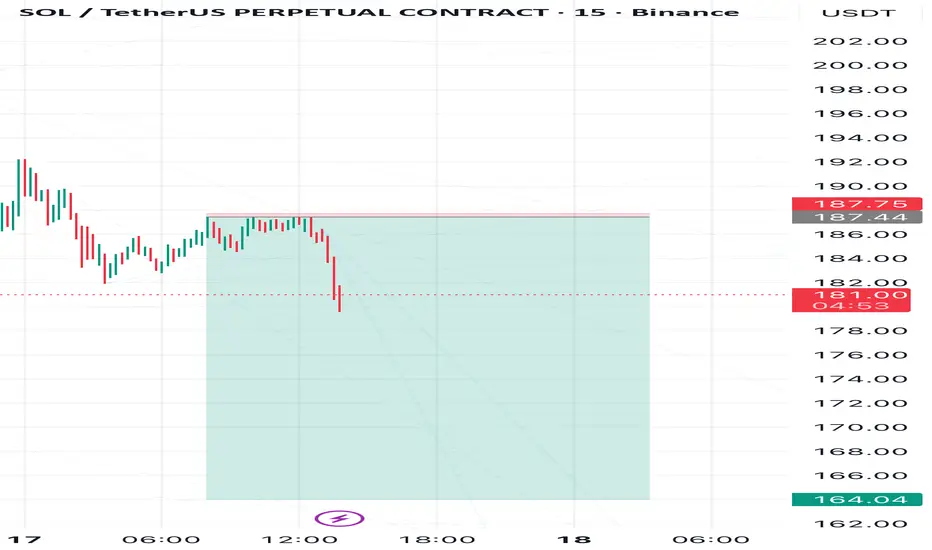
SOL Bears Still in Control — Eyes on 164Solana has repeatedly confirmed its plans to move lower toward the 164 level.
The 187.4 level is a particularly strong support, so a breakout above it would mean the plan is invalidated.
Follow me for consistent technical analysis on Solana
SOL
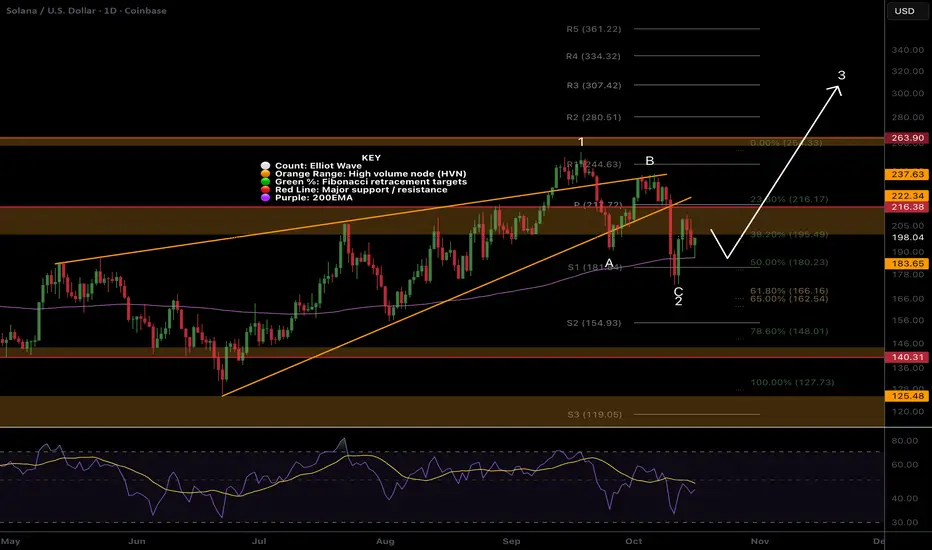
$SOL at major resistance, bottom is in?CRYPTOCAP:SOL bottom appears to have printed a text book ABC correction for wave 2 ending with a swing below the daily 200EMA and S1 pivot, front running the Fibonacci golden pocket.
However, Solana is at major resistance now and being rejected. RSI did not have bullish divergence or reach oversold so traders should be cautious.
Its holding up much better than most alt coins after Friday...
A bottom may be found at daily 200EMA and wave 3 may begin...
Safe trading
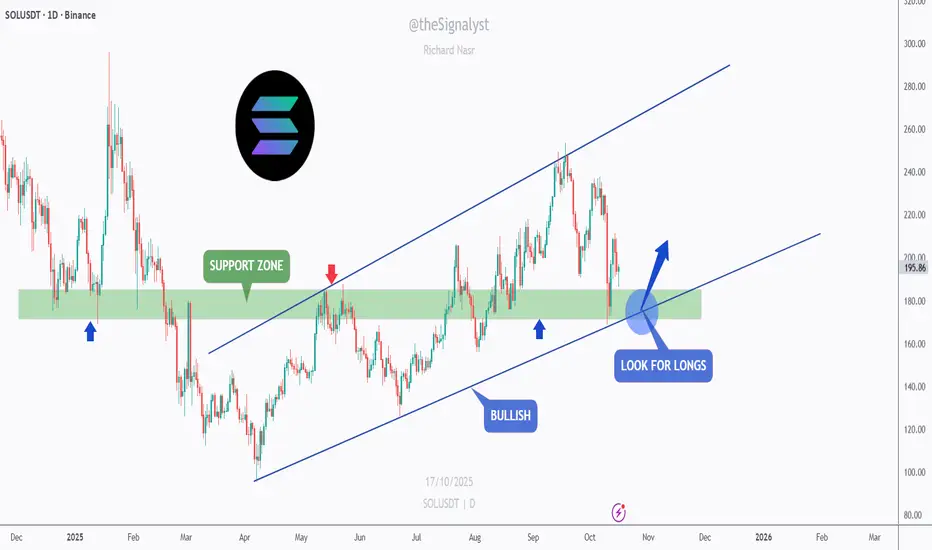
SOL - Buying the Retest Like a Sniper!SOL remains overall bullish , trading within a clean ascending channel and currently retesting the support zone that has acted as both resistance and support in the past.
This zone also aligns perfectly with the lower blue trendline, creating a strong area of confluence.
As long as this intersection holds, SOL is likely to rebound from here. I’ll be looking for bullish rejections or reversal patterns around the current zone to enter long positions, aiming for the next resistance levels near $230 and $260.
However, if the price breaks below the support zone, we could see a deeper correction before buyers regain control.
⚠️ Disclaimer: This is not financial advice. Always do your own research and manage risk properly.
📚 Stick to your trading plan regarding entries, risk, and management.
Good luck! 🍀
All Strategies Are Good; If Managed Properly!
~Richard Nasr
SOL — From Panic to PrecisionLast week, we witnessed a sharp, market-wide crash, a chain reaction of liquidations that flushed out overleveraged long positions. While many altcoins saw 60–90% drawdowns, the majors held relatively firm.
Among them, SOL stood out as one of the most technically precise. Price perfectly tapped the 1.1 trend-based Fib extension, in confluence with the yearly level, the 21 monthly SMA and the 0.666 retracement, providing a high probability long setup.
After that bounce, SOL revisited the lows, approaching the yearly level near $170, which remains the key structural support for maintaining bullish momentum. The support zone between $175–$170 aligns with the 21 EMA/SMA on the monthly timeframe, which currently spans $158–$170 → forming a strong macro confluence cluster that’s critical to hold.
From there, price unfolded into a clean 5-wave impulsive structure, topping within a dense resistance zone between $208–$212, reinforced by:
mOpen at $208.68
21 EMA/SMA (Daily TF) between $211–$212
0.618 Fibonacci retracement at $211.43
This area offered the perfect low-risk short entry.
Currently, SOL appears to be forming an ABC corrective pattern, likely targeting a move back into the $190–$185 range to fill imbalances and complete wave C. As another key element, the yearly open at $189.31 sits mid-range between resistance and support → a critical pivot level. That’s the region I’ll be monitoring for long setups.
🔍 Indicators used
DriftLine — Pivot Open Zones → For identifying key yearly/monthly/weekly/daily opens that act as major S/R reference points
Multi Timeframe 8x MA Support Resistance Zones → to identify support and resistance zones such as the monthly 21 EMA/SMA.
➡️ Available for free. You can find it on my profile under “Scripts” and apply it directly to your charts for extra confluence when planning your trades.
_________________________________
💬 If you found this helpful, drop a like and comment!

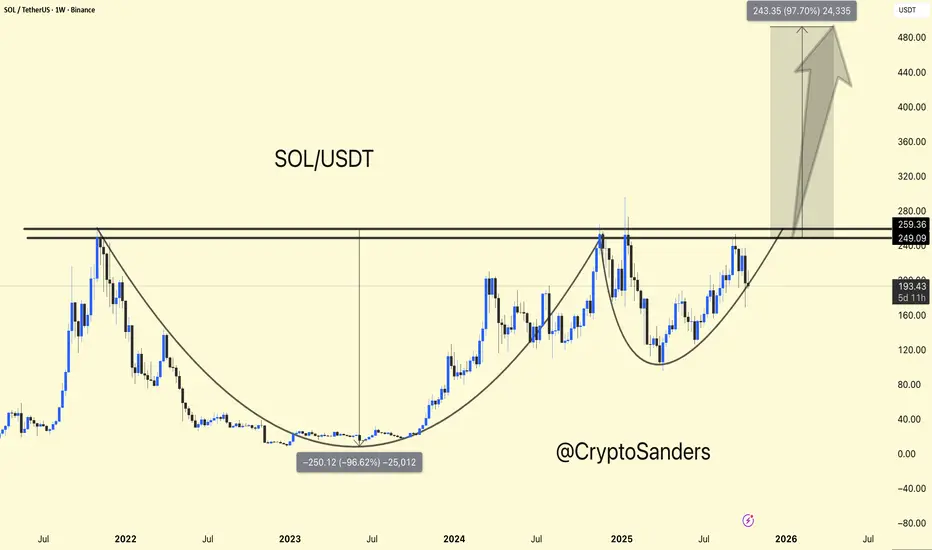
SOL/USDT Weekly Chart Update !! SOL/USDT Weekly Chart Update
SOL is forming a massive cup and handle pattern on the weekly timeframe – a strong bullish continuation setup leading to a major breakout.
Currently trading around $199, SOL is consolidating below the key resistance level of $250-$260. Once we achieve a weekly close above $260, it could confirm a breakout move towards $450-$480 (approximately +90-100% upside).
Support: $170-$180 (handle base/accumulation zone)
Resistance: $250-$260 (breakout zone)
Target: $450-$480
Overall sentiment remains bullish – the structure is clear, and momentum is building. A confirmed breakout above the resistance level could mark the start of SOL's next major surge.
DYOR | NFA
SOLUSD H4 | Bullish ReversalSOL/USD is reacting off the buy entry which is a pullback support and oculd rise from this level to the upside.
Buy entry is at 204.32, which is a pullback support.
Stop loss is at 187.97, which is an overlap support.
Take profit is at 228.36, which is an overlap resistance that aligns with the 78.6% Fibonacci retracement.
High Risk Investment Warning
Trading Forex/CFDs on margin carries a high level of risk and may not be suitable for all investors. Leverage can work against you.
Stratos Markets Limited (tradu.com ):
CFDs are complex instruments and come with a high risk of losing money rapidly due to leverage. 65% of retail investor accounts lose money when trading CFDs with this provider. You should consider whether you understand how CFDs work and whether you can afford to take the high risk of losing your money.
Stratos Europe Ltd (tradu.com ):
CFDs are complex instruments and come with a high risk of losing money rapidly due to leverage. 66% of retail investor accounts lose money when trading CFDs with this provider. You should consider whether you understand how CFDs work and whether you can afford to take the high risk of losing your money.
Stratos Global LLC (tradu.com ):
Losses can exceed deposits.
Please be advised that the information presented on TradingView is provided to Tradu (‘Company’, ‘we’) by a third-party provider (‘TFA Global Pte Ltd’). Please be reminded that you are solely responsible for the trading decisions on your account. There is a very high degree of risk involved in trading. Any information and/or content is intended entirely for research, educational and informational purposes only and does not constitute investment or consultation advice or investment strategy. The information is not tailored to the investment needs of any specific person and therefore does not involve a consideration of any of the investment objectives, financial situation or needs of any viewer that may receive it. Kindly also note that past performance is not a reliable indicator of future results. Actual results may differ materially from those anticipated in forward-looking or past performance statements. We assume no liability as to the accuracy or completeness of any of the information and/or content provided herein and the Company cannot be held responsible for any omission, mistake nor for any loss or damage including without limitation to any loss of profit which may arise from reliance on any information supplied by TFA Global Pte Ltd.
The speaker(s) is neither an employee, agent nor representative of Tradu and is therefore acting independently. The opinions given are their own, constitute general market commentary, and do not constitute the opinion or advice of Tradu or any form of personal or investment advice. Tradu neither endorses nor guarantees offerings of third-party speakers, nor is Tradu responsible for the content, veracity or opinions of third-party speakers, presenters or participants.

Support around 212.91 is crucial
Hello, fellow traders.
By "Following," you'll always get the latest information quickly. Have a great day today.
-------------------------------------
(SOLUSDT 1W Chart)
The chart may look complicated due to the drawn lines, but the key is whether the price can rise above the boxed area.
In other words, whether the price can rise above the 179.53-237.60 range and maintain its upward momentum is crucial.
-
(1D Chart)
The HA-Low indicator on the 1D chart is showing signs of forming at the 212.91 level.
Therefore, if support is confirmed around 212.91, it would be a good time to buy.
However, the HA-High ~ DOM (60) range has formed in the 236.88-237.60 range, so we need to see if it can break above this range.
If the upward breakout fails, it's time for a partial sell-off.
-
To continue the uptrend by breaking above a key zone or point,
1. The StochRSI indicator must be trending upward. If possible, it should be below the overbought level.
2. The On-By-Value (OBV) indicator must be trending upward. If possible, it should remain above the High Line.
3. The TC (Trend Check) indicator must be trending upward. If possible, it should remain above the 0 level.
If the above conditions are met, the uptrend is likely to continue.
-
Thank you for reading to the end.
I wish you successful trading.
--------------------------------------------------

SOL: intraday transactionsAfter a strong decline, intraday trades can be traded. While the long position is open, the part has already been fixed

BNB ANALYSThe analysis is on daily time frame and will give you a long term view
If these analyses help you to make better profits then share this analysis with your friends
And post your questions below this analysis

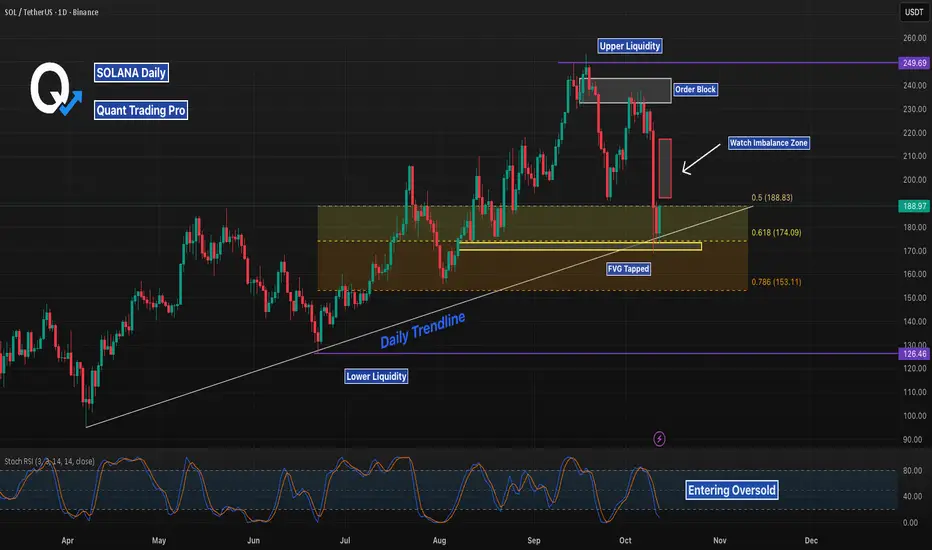
SOL Daily Recap: Breakout or Reversal Ahead?Solana (SOL/USD) recently tested the daily trendline support around $174.09 and bounced, with price action now approaching the FVG target zone near $189.55. The bullish move pushed toward the watch imbalance zone at $200, hinting at a potential breakout toward upper liquidity at $240 if momentum holds. However, the order block rejection near $210 suggests caution—watch for a bearish reversal if it fails to break, targeting lower liquidity at $153.11. With Stoch RSI entering oversold, a bounce or further dip could be next—keep an eye on $200 as the key pivot!
What's up with Solana?As we can see, Solana is currently sitting at a resistance level and has managed to hold up well there. In addition, the uptrend has not been broken, since the candle closed back above the potential trend break.
The long wicks we’ve seen across several cryptocurrencies occurred because many trading algorithms on crypto exchanges were not designed to handle such situations properly. These algorithms often compare prices, demand, and supply across different exchanges to determine fair pricing.
For example, if $1 billion were to flow into Solana in a single day, it would have a much larger price impact than $100 million per day over ten days. That’s why traders should always wait for candle closures before making decisions.
The recent crash was triggered by an announcement from Donald Trump, which wasn’t directly related to cryptocurrencies themselves. The broader uptrend remains intact and continues.
Given the current uncertainty, prices are moving sideways. I would consider buying Solana around the $180 level or below, as that still represents a good entry price for this asset. If we soon see rate cuts and the U.S. dollar weakens further under Trump, more investors are likely to move into alternative assets such as cryptocurrencies and Solana remains one of the leading projects in that space.

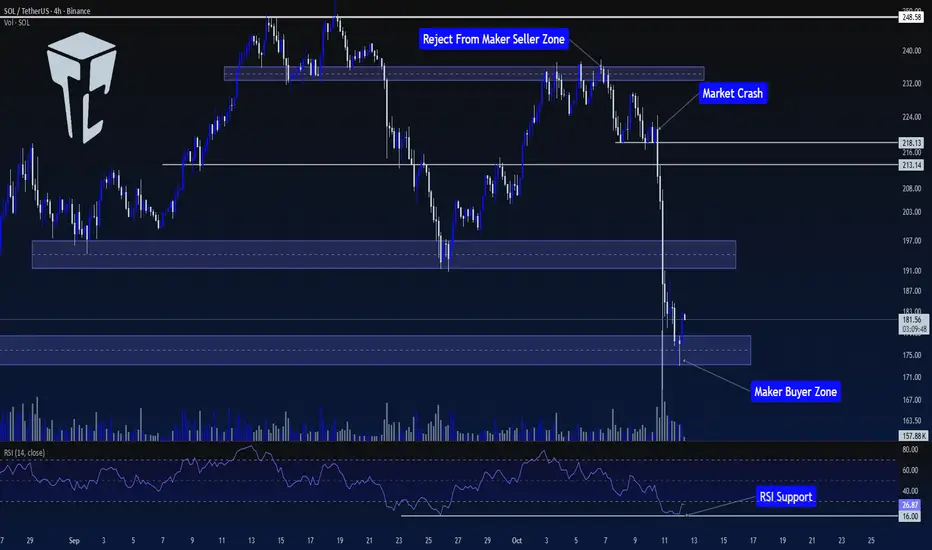
TradeCityPro | SOL: Market Calms After Sharp Move & RSI Support👋 Welcome to TradeCityPro!
Let’s analyze SOL, one of the most popular Ethereum killers with a market cap of $99.9 billion, currently ranking 6th on CoinMarketCap.
⏳ 4-Hour Timeframe
In the previous analysis, we had a Maker Buyer zone around $235. In that analysis, I mentioned that breaking this zone would be an early trigger for breaking $248.58.
🔍 However, the price never managed to sustain above this level, and after getting rejected from this zone, the price entered a corrective phase, forming a support at $218.13.
📊 After the price bounced from $218.13 for the first time, it failed to set a new high in line with previous highs and instead formed a lower high. The price returned to $218.13 again.
✔️ With the breakout of this level, coinciding with news between China and the U.S., the price started a sharp downward move, breaking through the $213.14 support.
✨ Over the course of 2-3 candles, SOL made a sharp move towards the first Maker Buyer zone, breaking it and reaching the second Maker Buyer zone.
💫 Naturally, there was a significant increase in selling volume during this move, and RSI dropped to 16, where it found support.
🧩 Currently, the market seems to have calmed down, with RSI still in the Oversell zone, but volatility has significantly decreased.
💡 Although the market has calmed, I believe the price needs to build a more structured setup before finding valid triggers, and the market conditions are not ideal for opening positions right now.
💥 So, for now, I won’t provide any triggers on this coin and will wait for more structure to form before making a better decision to open a position.
📝 Final Thoughts
Stay calm, trade wisely, and let's capture the market's best opportunities!
This analysis reflects our opinions and is not financial advice.
Share your thoughts in the comments, and don’t forget to share this analysis with your friends! ❤️
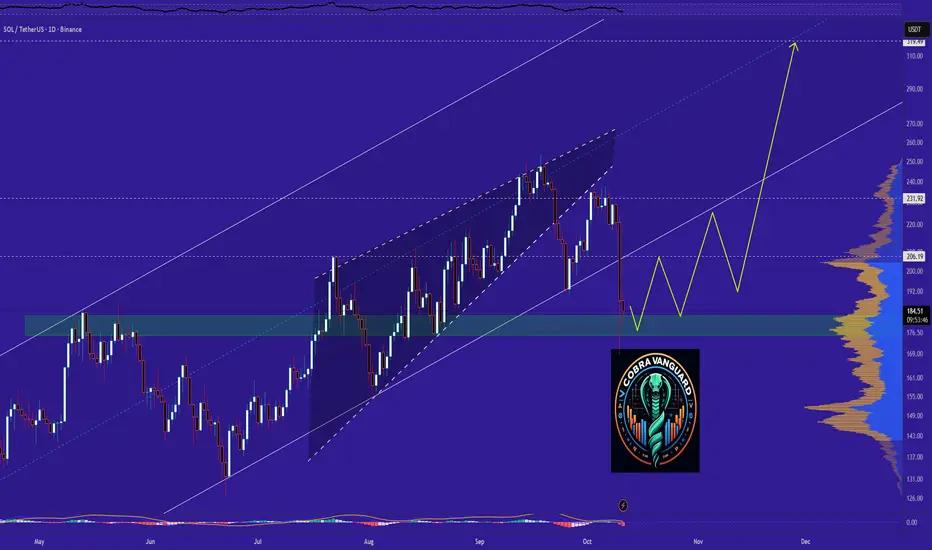
SOLANA Outlook after the Dip. What to expect NOW? has broken below its ascending channel support near $190, signaling short-term weakness. If buyers fail to reclaim this level, price could test the $150–$160 demand zone. A strong rebound from that area might restart the uptrend toward $220–$240.
The price can easily reach the shown targets from here.
Best regards CobraVanguard.💚
Solana Faces Bearish Pressure Below $190 SupportHi everyone!
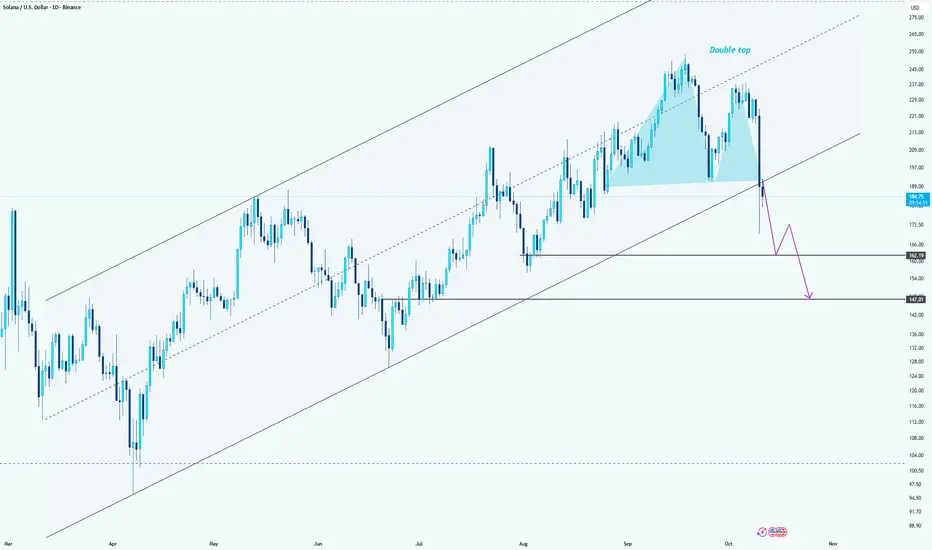
Solana appears to be forming a double top pattern near the $250 zone, signaling potential bearish momentum. After failing to sustain above the upper channel resistance, the price broke below the midline support, confirming short-term weakness.
Currently, SOL is retesting the neckline area around $190. If it fails to reclaim this level, further downside is likely. The next key support zones lie around $165 and $147, aligning with the previous structure and the lower channel boundary.
A clean break below $165 would likely accelerate the move toward $147, confirming a deeper correction within the broader ascending channel.
Bias: Bearish below $190
potential targets at $165 → $147.
SOL - PERFECT PLAY.#SOL - MEDIUM TERM OUTLOOK - ON POINT 🔥📉
7.5% dump since this update.
Zooming on my macro time frame view, this could be the final dump before to see a huge move upward! 📈
(valid if 196 - 198$) act as key support.
Level by level.
Local support: 205 - 206$. (expecting some bull reaction soon, likely before the next dump?).
Also Keep an eye on the daily uptrend. 👀

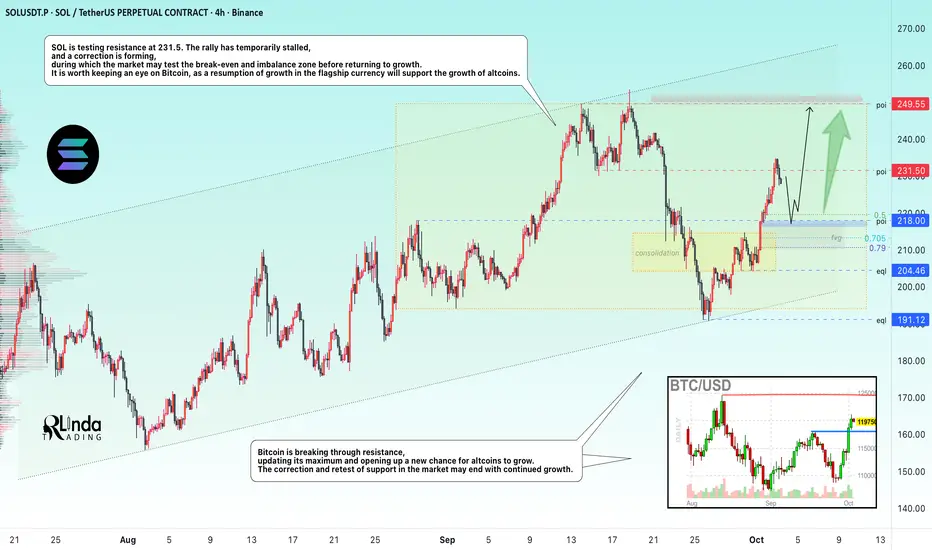
SOLANA → Retracement for consolidation before growth to 250.0BINANCE:SOLUSDT bounces off trend support, forms a reversal pattern, and enters a distribution phase, during which it updates its maximum but encounters strong resistance. What's next?
Bitcoin breaks through resistance, updating its maximum and opening up a new chance for growth for altcoins. Correction and retesting of support in the market may end with continued growth.
SOL is testing resistance at 231.5. The rally has temporarily stalled, and a correction is forming, during which the market may test the break-even and imbalance zone before returning to growth. It is worth keeping an eye on Bitcoin, as a resumption of growth by the flagship will support the growth of altcoins.
Resistance levels: 231.5, 235, 250
Support levels: 218, 205
A false breakout of 231.5 is provoking a pullback. It is necessary to monitor the further halt in price. I expect a retest of 220-218 before the price returns to growth.
Sincerely, R. Linda!
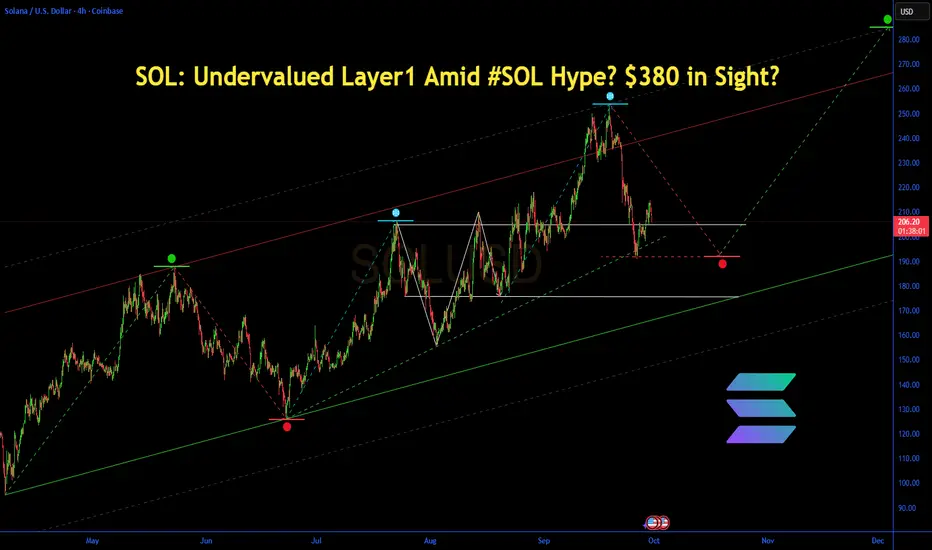
SOL: Undervalued Layer1 Amid #SOL Hype? $380 in Sight?SOL: Undervalued Layer1 Amid #SOL Hype? $380 in Sight?
Price $210.94 (-1.07%), fueled by TVL $12.2B surge and X airdrops, undervalued with 31.83% YTD, questioning if ETF inflows drive breakout.
Fundamental Analysis
Market cap $114.55B, TVL $12.2B up 57% 6M, supply growth stable; Lynch-like growth emphasis on 198% TVL rise, PEG adapted low vs peers; DCF projects $300+ on adoption moat; opportunity cost vs ETH favors efficiency, inversion warns outages.
Positive:
3.88% monthly rise.
67% staked.
Negative:
High volatility.
Rival competition.
SWOT Analysis
Strengths: Fast DeFi hub.
Weaknesses: Past downtimes.
Opportunities: ETF in #Altseason.
Threats: Regulations.
Technical Analysis
Sell signal short-term. Price: $210.94, VWAP N/A. Key indicators: RSI: Below 40/oversold.
MACD: N/A.
Moving Averages: Neutral.Support/Resistance: $177/$214. Patterns/Momentum: Potential rebound. Bullish | Bearish.
Scenarios and Risk Management
Bullish: Break $214, DCA to $380 on hype; second-order thinking amplifies network effects.
Bearish: To $150.
Neutral: Range $177-214.Risk Tips: 10% stops, diversify crypto, DCA weekly.
Conclusion/Outlook
Bullish on ecosystem, lollapalooza from #Crypto trends parabolic. Watch ETFs. Fits layer1 theme with #SOL upside. Take? Comment!
Crypto = Stocks, saying this since 2021Sorry for not posting as much
Want more? A lot more? See profile for more info.
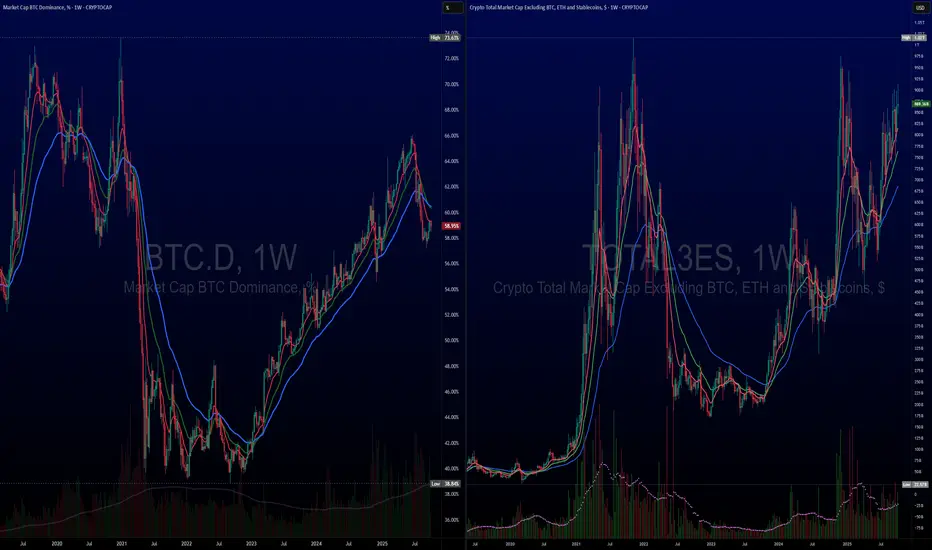
Until we see a significant shift and change to our theses since 2021 >Crypto = Stocks. People were clamoring institutions. When big boys come to the party things change. Deal with that now. It is not the same game.
Since 2021 we've been saying that Crypto was no longer the same and that it turned into a similar asset as stocks.
Since then the top 10 have done well & most coins, especially after top 25, have suffered.
See the following charts to compare. Not in any order.
It's kind of like NASDAQ:NDX index vs CRYPTOCAP:BTC index.
Then the largest tech companies vs the largest Crypto.
NASDAQ:META NASDAQ:MSFT NASDAQ:NVDA = CRYPTOCAP:SOL CRYPTOCAP:XRP CRYPTOCAP:BNB Capish?
$300 Solana Inevitable!Nice rejection on Solana. Now lets see if we will get the move to the downside for a nice long trade to target $300.
Calculate Your Risk/Reward so you don't lose more than 1% of your account per trade.
Every day the charts provide new information. You have to adjust or get REKT.
Love it or hate it, hit that thumbs up and share your thoughts below!
This is not financial advice. This is for educational purposes only.

solana x binance coin Solana follow it Binance Coin on its journey to $1k
CRYPTOCAP:SOL vs. CRYPTOCAP:BNB

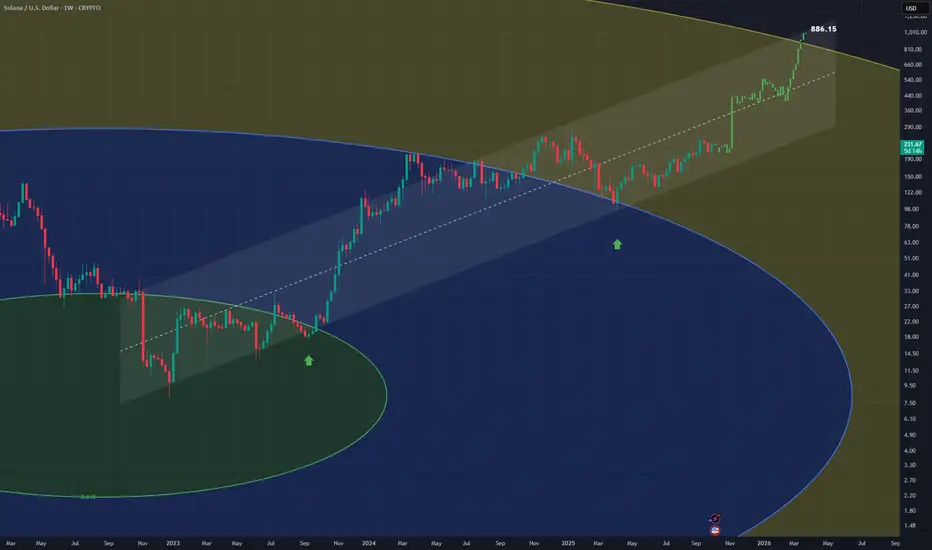
SOLUSD - Up Channel A sharp up channel has formed on solana's daily chart
im allowing further movement up as price bounces off the fib circle ring
bullish towards the top of channel
SOLUSD H4 | Could we see a bearish reversal from here?Based on the H4 chart analysis, we can see the price reacting off the sell entry which is a pullback resistance that aligns with the 78.6% Fibonacci retracement and could reverse from this levle to the take profit.
Sell entry is at 238.31, which is a pullback resistance that aligns with the 78.6% Fibonacci retracement.
Stop loss is at 253.39, which is a swing high resistance.
Take profit is at 216.84, which is a pullback support that is slightly below the 38.2% Fibonacci retracement.
High Risk Investment Warning
Trading Forex/CFDs on margin carries a high level of risk and may not be suitable for all investors. Leverage can work against you.
Stratos Markets Limited (tradu.com ):
CFDs are complex instruments and come with a high risk of losing money rapidly due to leverage. 65% of retail investor accounts lose money when trading CFDs with this provider. You should consider whether you understand how CFDs work and whether you can afford to take the high risk of losing your money.
Stratos Europe Ltd (tradu.com ):
CFDs are complex instruments and come with a high risk of losing money rapidly due to leverage. 66% of retail investor accounts lose money when trading CFDs with this provider. You should consider whether you understand how CFDs work and whether you can afford to take the high risk of losing your money.
Stratos Global LLC (tradu.com ):
Losses can exceed deposits.
Please be advised that the information presented on TradingView is provided to Tradu (‘Company’, ‘we’) by a third-party provider (‘TFA Global Pte Ltd’). Please be reminded that you are solely responsible for the trading decisions on your account. There is a very high degree of risk involved in trading. Any information and/or content is intended entirely for research, educational and informational purposes only and does not constitute investment or consultation advice or investment strategy. The information is not tailored to the investment needs of any specific person and therefore does not involve a consideration of any of the investment objectives, financial situation or needs of any viewer that may receive it. Kindly also note that past performance is not a reliable indicator of future results. Actual results may differ materially from those anticipated in forward-looking or past performance statements. We assume no liability as to the accuracy or completeness of any of the information and/or content provided herein and the Company cannot be held responsible for any omission, mistake nor for any loss or damage including without limitation to any loss of profit which may arise from reliance on any information supplied by TFA Global Pte Ltd.
The speaker(s) is neither an employee, agent nor representative of Tradu and is therefore acting independently. The opinions given are their own, constitute general market commentary, and do not constitute the opinion or advice of Tradu or any form of personal or investment advice. Tradu neither endorses nor guarantees offerings of third-party speakers, nor is Tradu responsible for the content, veracity or opinions of third-party speakers, presenters or participants.

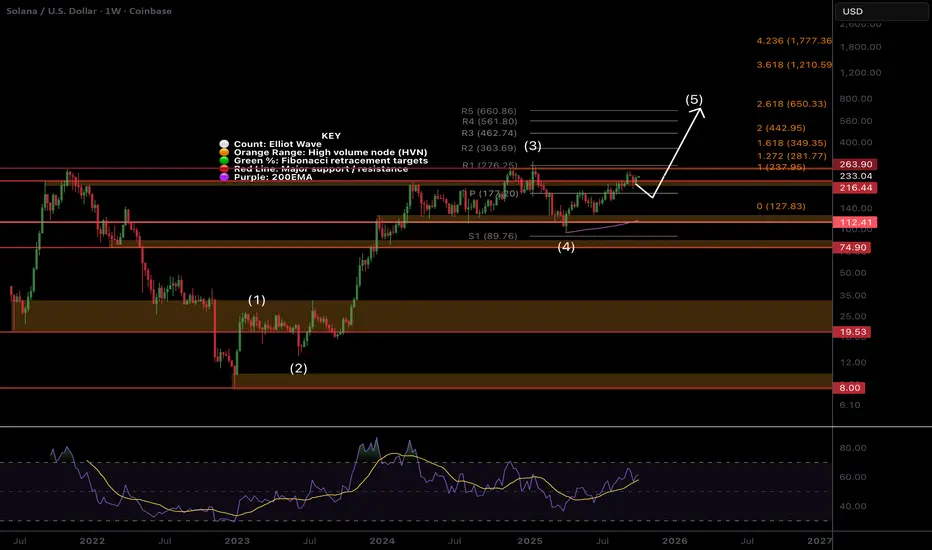
SOL Macro - Time for Price discovery?$SOLWeekly RSI has returned to the EQ giving Solana plenty of space for upside growth! Price is attempting to break into all time high but just can’t find the momentum it needs. This is good thing for now, keeping volatility to a minimum!
Weekly R5 Pivot and Fibonacci extension targets are $660. Price is above the weekly pivot showing the uptrend is in tact and may well test it as support again!
Consolidating under resistance for an extended period often leads to a breakout!
Safe trading