Solana (solusdt): a correction and a possible bounceHi guys!
As you can see Solana breakout from the resistance line but it was a false breakout and then started a drop there!
I see the drop will continue at least until the gray area and then price could rise from there!
short position target: $123
Solana

Solana's Price Action reflects some Short-Term AmbiguityPrice now appears to be operating within the b-wave portion of the corrective pattern. While I acknowledge we could see marginally lower prices from here, my base case remains that price recovers and continues to subdivide as depicted in my chart in the black pathway. What remains less clear is whether we are still subdividing to new local lows under the purple alternate, or if the retracement instead continues in a more standard fashion into my target box.
The uncertainty stems from the fact that SOL’s price never decisively traded above the $147–$148 region we have been monitoring for some time. That failure keeps the purple count viable.
However, what lends slightly more confidence to my black primary count over the purple alternate, specifically with respect to Solana, is Bitcoin. BTC has managed to trade above a level that can reasonably be interpreted as the wave iv of a lesser degree. If that interpretation proves correct, it becomes increasingly difficult to envision Bitcoin continuing its corrective advance without exerting upward influence on Solana as well.
As always, time and structure will resolve this short-term ambiguity.

SOL, uptrend intactCRYPTOCAP:SOL
🎯Price caught a bid moving bullishly above the daily pivot, now being tested as support. Wave 2 of a new motif wave appears to be underway with an inital target of the daily 200EMA.
📈 Daily RSI is back to the EQ, restting quickly. A good sign for bullish continuation.
👉 Analysis is invalidated below wave C, $110
Safe trading

BTC ETH SOL Crypto The pattern within the pattern.
This smaller channel within the zoomed-out channel is starting to form more.
Overall near term we have a rather clear picture on price action and things have remained somewhat predictable for several tradeable plays here.
Sol if anything looks the most suspect here but it's been the most resilient so far this cycle.
I'll continue to use the channel until it doesn't work.
This still just looks like a relief rally thus far and we still need more time to see if the ever famous 4-year cycle is broken.
The theory of that alone invites its own scenario for a push that could be further fueled with a short squeeze along with further fuel from the idea that the cycle is now broken, only to turn around and become the normal fake out double top bear winter.
Patience is the key here and keep it simple and moves small or SL tight

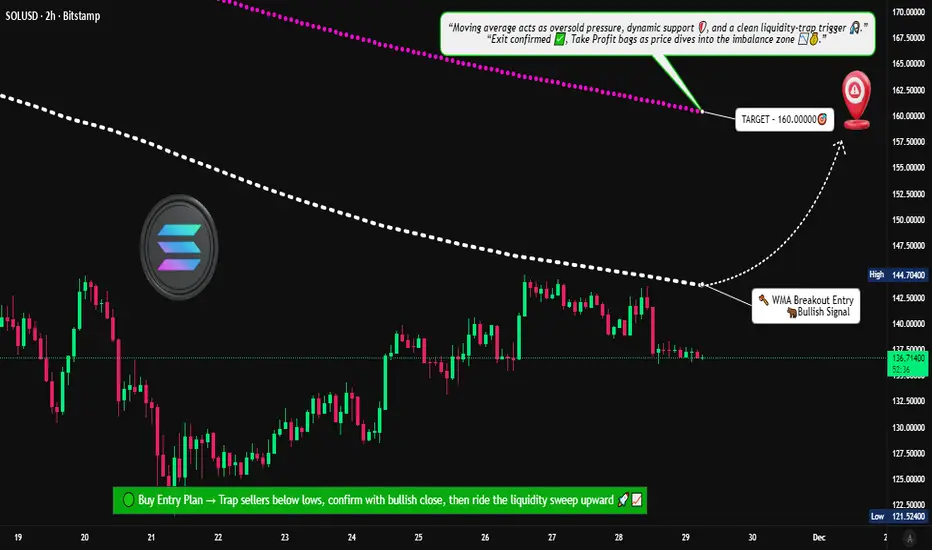
Is Solana Preparing for a New Upside Wave After WMA Breakout?📊 SOL/USD – “SOLANA VS U.S Dollar” Crypto Market Opportunity Blueprint (Swing Trade)
🟢 Trade Plan Overview
The bullish structure is confirmed after Weighted Moving Average (WMA) dynamic support breakout, signalling fresh momentum entering the market. This setup favors continuation as long as SOL holds above the breakout zone.
📌 Entry Zone
➡️ Entry: Any price level after the WMA breakout above 145.00000
The breakout + retest combination is your strongest confirmation. Let the chart validate the move—no rush entries.
🛡️ Stop Loss (Risk Protection)
➡️ Suggested SL: 132.50000
Dear Ladies & Gentlemen (Thief OG’s):
Use this SL only as a reference. Adjust based on your personal execution style, risk tolerance, and position size.
Place SL only after breakout confirmation — not before.
🎯 Profit Target
➡️ Target: 160.00000
Weighted moving averages are acting as dynamic resistance, and indicators show signs of potential overbought traps, so secure profits early instead of overstaying.
Dear Ladies & Gentlemen (Thief OG’s):
TP is your own choice. Lock in profits based on your comfort, not just my blueprint.
📚 Market Reasoning
WMA breakout shows renewed bullish strength.
Structure support aligned with higher-timeframe trend.
Volume expansion confirms buyers stepping in.
Resistance cluster around 160 remains the key zone to offload profits.
🔎 Related Pairs to Watch (Correlation & Key Notes)
💠 BITSTAMP:BTCUSD (Bitcoin)
High correlation with total crypto liquidity.
Strong BTC breakouts often pull SOL upward because altcoins follow BTC’s macro flow.
If BTC loses trend support, SOL setups weaken.
💠 BITSTAMP:ETHUSD (Ethereum)
ETH and SOL share similar Layer-1 ecosystem flows.
When ETH rallies aggressively, funds rotate into strong alts like SOL.
Good to use as a sentiment confirmation tool.
💠 COINBASE:ADAUSD (Cardano)
Another L1 competitor; correlated during broad alt-season pushes.
When ADA moves, retail interest usually spreads across L1s — including SOL.
💠 COINBASE:AVAXUSD (Avalanche)
Solana + Avalanche often move together during risk-on bursts.
AVAX momentum adds conviction to SOL’s breakout reliability.
💠 BINANCE:SOLBTC
The most important relative strength pair for SOL.
If SOLBTC is trending upward, SOL outperforms majors — huge confirmation signal for swing trades.
📈 Final Thoughts
This trade plan balances momentum, trend structure, and dynamic WMA confirmation. Follow the breakout logic, respect your risk, and let the chart guide your exits. The idea is designed to help traders act with clarity, control, and professional-level precision.
SOL - Descending Wedge Rejection at $145 | FVG Retest Incoming
What's up traders! 👋
SOLUSD is setting up for a key move. We've got a symmetrical wedge pattern with price respecting the descending resistance perfectly - hitting it and getting rejected. Let me break down what I'm seeing on the 45-minute chart.
The Setup
SOL is trading at $144.85 on the 45-minute timeframe. Price is inside a symmetrical wedge pattern - descending resistance on top (lower highs) and ascending support on bottom (higher lows). The key here: price just hit the descending resistance near $145-$147 and got REJECTED.
This is textbook wedge behavior. Price respects the trendlines until breakout. Right now, it's following the wedge DOWN toward the FVG zone.
Why I'm Leaning Bearish (Short-Term)
Price rejected from descending resistance at $147
Failed to clear $150 resistance - sellers defending
Dropped below $146 and $145 - now below 100-hour SMA
Hourly RSI below 50 - bearish momentum
MACD showing bearish pressure
Long/short ratio at 0.7569 - traders leaning short
$10.5M in liquidations - $7.7M were longs
3M performance: -20.40% | 1Y: -29.60% - macro downtrend
The Wedge Structure
DESCENDING RESISTANCE (Top): Lower highs forming - sellers capping rallies at $145-$147
ASCENDING SUPPORT (Bottom): Higher lows forming - buyers defending around $138-$140
CURRENT ACTION: Price hit descending resistance and rejected
FVG ZONE: $140-$142 is the next target for retest
TREND: Following the wedge DOWN until breakout
The News Context - January 16, 2026
Mixed signals but leaning bearish short-term:
SOL failed to hold above $146 - entered short-term correction
Price below 100-hour simple moving average
Broke below 61.8% Fib retracement of $138-$149 move
$10.5M liquidations - mostly longs ($7.7M)
Long/short ratio 0.7569 - traders positioning short
RSI below 50, MACD bearish
Bullish Catalysts (Watch For Breakout)
Solana ETF inflows $23.57M - highest in 4 weeks
Forward Industries building largest SOL treasury (6.9M SOL)
Alpenglow upgrade coming - transaction finality 100-150ms (from 12.8s)
RWA ecosystem hit $1.15B record valuation
Network processed $1.6T in 2025 trading volume
68M active addresses (up 14%) - most used network
Open Interest jumped from $6.8B to $8.8B
"Clarity Act" could ease SEC requirements for SOL
Key Levels I'm Watching
Resistance:
$145.50 - Day's high / immediate resistance
$146 - First major resistance
$148.29 - MAJOR RESISTANCE (breakout level)
$150 - Psychological round number
$155 - Next target if breakout
$162 - Extended bullish target
$200 - Analyst target (if network growth continues)
Support:
$144.85 - Current price
$141 - Bullish trendline support
$140-$142 - FVG ZONE (key retest target)
$140.23 - MAJOR SUPPORT (76.4% Fib)
$138 - Swing low
$137.72 - CHANNEL BOTTOM
$132 - Next support if breakdown
$124 - Extended bearish target
Two Scenarios
BEARISH CONTINUATION (PRIMARY):
Price continues following the descending wedge. After rejecting from $145-$147 resistance, SOL drops to retest the FVG zone at $140-$142. If FVG fails to hold, continuation to $137.72 channel bottom.
First target: $141 (trendline support)
Second target: $140.23 (major support / 76.4% Fib)
Extended target: $137.72 (channel bottom)
Breakdown target: $132, then $124
Triggers: Continued rejection at descending resistance, break below $140, risk-off sentiment, no major bullish catalyst.
BULLISH BREAKOUT (ALTERNATE):
Big news hits and price breaks above the descending wedge resistance. SOL clears $148.29 with volume and targets higher levels.
First target: $150 (psychological)
Second target: $155 (next resistance)
Extended target: $162, then $173
Moon target: $200 (if network growth accelerates)
Triggers: Break above $148.29 with volume, major ETF news, Alpenglow upgrade hype, institutional buying.
My Take - BEARISH BIAS (Short-Term)
I'm leaning BEARISH here. Here's why:
1. Price respecting descending resistance - SOL hit the wedge top at $147 and got rejected. This is textbook - follow the trend until breakout.
2. Technical indicators bearish - RSI below 50, MACD bearish, below 100-hour SMA. Momentum favors sellers.
3. Liquidation data bearish - $7.7M in long liquidations vs $2.8M shorts. Longs getting squeezed.
4. Long/short ratio bearish - At 0.7569, traders are positioning short. Smart money leaning bearish.
5. Macro structure weak - Down 20.40% in 3 months, down 29.60% in 1 year. Still well below $295 ATH.
BUT - Watch for the Breakout
The bullish catalysts are real:
ETF inflows strongest in 4 weeks
Alpenglow upgrade is massive (100ms finality)
Institutional adoption growing (Forward Industries)
Network fundamentals strong (68M addresses, $1.6T volume)
If big news hits, SOL could spike above $148.29 and invalidate the bearish thesis. But until that happens, I'm following the wedge DOWN.
Trade Plan
Bearish Entry (PRIMARY):
Entry: Rejection at $145-$146 resistance OR break below $141
Stop: Above $148.29 (above major resistance)
Target 1: $141 (trendline)
Target 2: $140.23 (major support)
Target 3: $137.72 (channel bottom)
R:R: ~1:2
Bullish Entry (if breakout):
Entry: Break above $148.29 with volume
Stop: Below $144
Target 1: $150 (psychological)
Target 2: $155
Target 3: $162
R:R: ~1:2.5
The Bottom Line
SOLUSD is respecting the symmetrical wedge perfectly. Price hit descending resistance at $147 and got rejected - now heading toward the FVG zone at $140-$142 for a retest.
Short-term, I'm BEARISH. Follow the wedge until it breaks. The FVG zone at $140-$142 is the next target. If that fails, $137.72 channel bottom is in play.
Long-term, the fundamentals are strong (ETF inflows, Alpenglow upgrade, institutional adoption). But technicals say DOWN until we break above $148.29.
Watch the FVG zone. That's your tell.
What do you think? Continuation down or breakout up? Drop your thoughts below! 👇

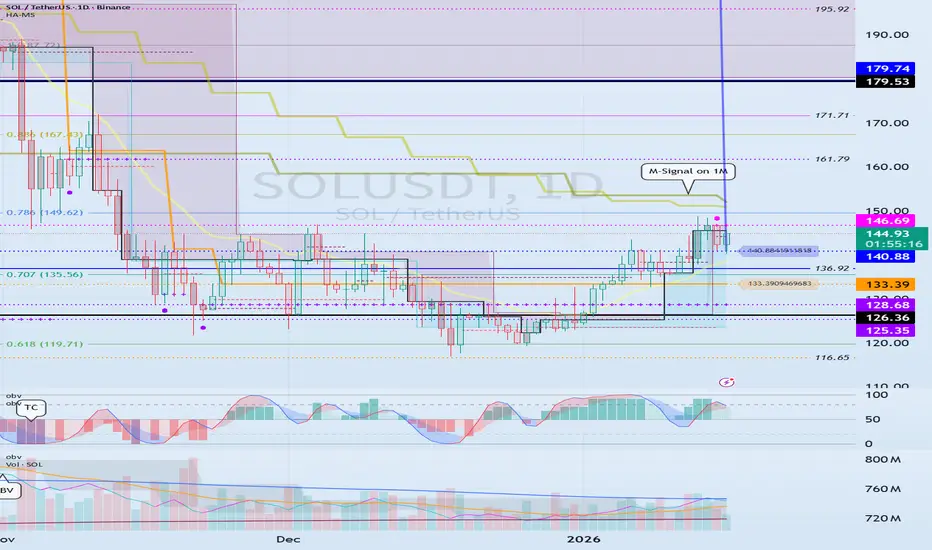
Support and Resistance Area: 140.88-146.69
Hello, traders!
Follow us to get the latest information quickly.
Have a great day!
-------------------------------------
(SOLUSDT 1D Chart)
SOLUSDT is entering a new phase with the emergence of the DOM(60) and HA-High indicators.
Accordingly, the key question is whether the price can rise while gaining support near the 140.88-146.69 level.
If not, it could fall below the 128.66-133.39 level and set a new low.
A decline below the M-Signal indicator on the 1M chart is highly likely to trigger a downtrend, so caution is advised when trading.
Therefore, we should set a buy point when the price rises above the M-Signal indicator on the 1M chart and maintains its level.
Since BTCUSDT's volatility period is around January 20th, we should monitor whether the price can rise above the M-Signal indicator on the 1M chart after this period.
-
To continue the uptrend by breaking above a key point or level, the StochRSI, TC, and OBV indicators must show upward trends.
If possible,
1. The StochRSI indicator should not have entered an overbought zone. 2. The TC indicator should remain above the 0 level.
3. The OBV indicator should remain above the High Line.
Looking at the current auxiliary indicators, we can see that the conditions for a sustained uptrend are not met.
Therefore, we should examine whether the conditions for a sustained uptrend can be met around the 140.88-146.69 range.
-
Thank you for reading to the end.
We wish you successful trading.
--------------------------------------------------
SOLUSDT M30 HTF FVG Rejection and Bearish Continuation Setup📝 Description
BINANCE:SOLUSDT has reacted into a clear M30 HTF FVG zone and failed to sustain upside momentum. The recent bounce appears corrective after a strong selloff, with price now stalling below imbalance resistance.
________________________________________
📈 Signal / Analysis
Primary Bias: Bearish while price remains capped below the M30 FVG
Preferred Setup:
• Entry: 144.50
• Stop Loss: Above 145.10
• TP1: 143.90
• TP2: 143.20
• TP3: 142.40 (lower HTF FVG / liquidity)
________________________________________
🎯 ICT & SMC Notes
• Rejection from M30 FVG indicates weak bullish follow-through
• Move up classified as pullback, not structural shift
• Bearish continuation favored toward stacked imbalances below
________________________________________
🧩 Summary
As long as CRYPTOCAP:SOL trades below the highlighted M30 FVG, downside continuation toward lower liquidity pools remains the higher-probability scenario.
________________________________________
🌍 Fundamental Notes / Sentiment
No immediate bullish catalyst is present, keeping sentiment neutral-to-bearish and aligned with technical downside pressure.
________________________________________
⚠️ Risk Disclosure
Trading involves substantial risk and may result in capital loss. This analysis is for educational purposes only and does not constitute financial advice. Always apply proper risk management, predefined stop-loss levels, and disciplined position sizing aligned with your trading plan.

SOL — High-Confidence Long Zone
This is one of the safest areas to look for longs on CRYPTOCAP:SOL , as long as price continues to hold above 121, which marks the monthly value area.
What I’m Looking For
Holding above 121: Keeps the bullish structure intact.
Target: A push toward just below 400 remains on the table.
Stronger continuation: If SOL manages to build a clean mode around 172, the odds of an accelerated move increase significantly.
I seriously doubt we’ll get another opportunity to long SOL anywhere near the 2023 close, which is why current levels are already attractive from a risk–reward perspective.
For now, this is a hold-and-build setup, not a chase.

Solana Still Has Room to Run | Targets AheadHello traders! 🚀
Hope your week is off to a great start!
Today I’d love to share my thoughts on Solana (SOL) 💎
Even though SOL has already made a solid move to the upside, the chart is still sending bullish signals 📈 The structure suggests that the momentum may continue, and the party might not be over yet 😉
From current levels, I’m looking for a move toward 148.
❌ Invalidation level:
Any touch of the 141.6 area will invalidate this bullish scenario.
Let’s break down the targets step by step 👇
🎯 Target 1: 145
🎯 Target 2: 148
🎯 Bold target: (151.4) — a bit optimistic, so I’ll keep it in brackets 😄
If this idea resonates with you, hit the like 👍,
follow for more trading ideas, and
share your thoughts in the comments — where do you see SOL going next? 💬
Trade smart, manage your risk 🧠
Let’s watch the chart together! 🚀📊

SOL 1D Update: Looking to establish new uptrendSOL update.
SOL is now establishing a new short-term uptrend after spending months inside a descending channel. The key shift is structural: price has broken out of the downtrend and is no longer making lower lows. Instead, it’s holding above former support around the $125 level and building higher lows, which is exactly what you want to see in an early trend transition.
The move higher toward the $140–145 area has been more controlled and constructive than prior bounces. Instead of sharp relief moves that fade immediately, SOL is grinding higher and holding gains, suggesting real demand rather than just short covering.
This strength is also starting to show up across the Solana ecosystem. Several SOL meme coins are attempting to break out of their own basing structures, which typically happens when SOL itself stops trending down and begins to lead. That kind of breadth is important and often precedes stronger continuation if it sustains.
Key levels to watch:
As long as SOL holds above $125, the uptrend structure remains intact.
Acceptance above $145 opens the door for a move toward the $160–180 region, where heavier resistance sits.
A failure back below $125 would invalidate the breakout and shift this back into range behavior.
Overall, SOL’s character has changed from sell-the-rip to buy-the-dip. It’s still early and likely to be choppy, but the market is finally starting to lean in the right direction. If this structure holds, both SOL and its meme ecosystem have room to expand further.

SOLANA — Absorption at HTF Resistance | Downside Risk IncreasingTraders,
CRYPTOCAP:SOL pushed into resistance and stalled. Not aggressively. Not weakly either.
What we are seeing now is absorption, and the market is quietly deciding what to do next.
The question is not “bullish or bearish.”
The question is where the real decision gets made.
Right now, the chart gives us a very clean structure.
1. What happened
SOL rallied back into a higher-timeframe resistance zone around $142–145.
This area is important because:
It previously acted as distribution
It aligns with a harmonic exhaustion level
Liquidity is clearly resting above
Price did not reject immediately.
Instead, it slowed down.
That already tells us something.
2. What price is doing now
On the 1H, price is pushing higher in small steps:
Push
Pause
Shallow pullback
Push again
Each high looks constructive, but none are being accepted cleanly.
This is not breakout behavior.
This is price being worked inside supply.
Liquidity above is visible.
Yet price hesitates just below it.
3. Momentum in strength, not divergence
RSI is not aggressively diverging here.
Instead:
RSI stays elevated
Each push higher produces less expansion
Momentum rolls over inside strength
That usually means effort is being absorbed, not rewarded.
When momentum stalls at resistance without breaking down, it often reflects absorption inside strength, not weakness.
4. Spot flow tells the real story
Spot CVD continues to rise.
On both the 1H and the 4H, spot CVD is making clear higher highs. Buyers are not hesitating. Market orders keep hitting the ask, and spot demand is persistent across timeframes.
On the surface, that looks bullish.
But price is not responding.
Despite spot CVD printing higher highs, price remains capped beneath resistance and fails to gain acceptance. Each attempt higher is absorbed rather than extended.
That mismatch matters.
When spot demand increases across multiple timeframes and price fails to move, it usually means one thing:
Supply is sitting above the market
Sellers are passive and patient
Buyers are doing all the work
This is classic absorption behavior.
The important detail here is that this is not a single-timeframe signal. The fact that spot CVD is making higher highs on both the 1H and 4H strengthens the read. Real buyers are present, but they are being met by consistent supply.
That is not how breakouts start.
That is how distribution hides.
5. Futures are not confirming
While spot keeps buying:
Stablecoin-margined futures CVD trends lower
Perp traders are selling into strength
Leverage is not chasing this move
Coin-margined futures remain net negative, suggesting longer-horizon participants are still distributing.
Different groups, same message: less appetite for higher prices here.
6. Open interest adds tension
Open interest remains elevated.
Price is not expanding, yet positions are being added.
That creates pressure.
Crowded markets don’t drift.
They eventually move, and usually fast.
7. The higher-timeframe context
On the daily, accumulation and distribution remains pointed lower.
Rallies continue to be used to offload supply.
This move fits that pattern.
Push into resistance.
Effort from buyers.
No acceptance.
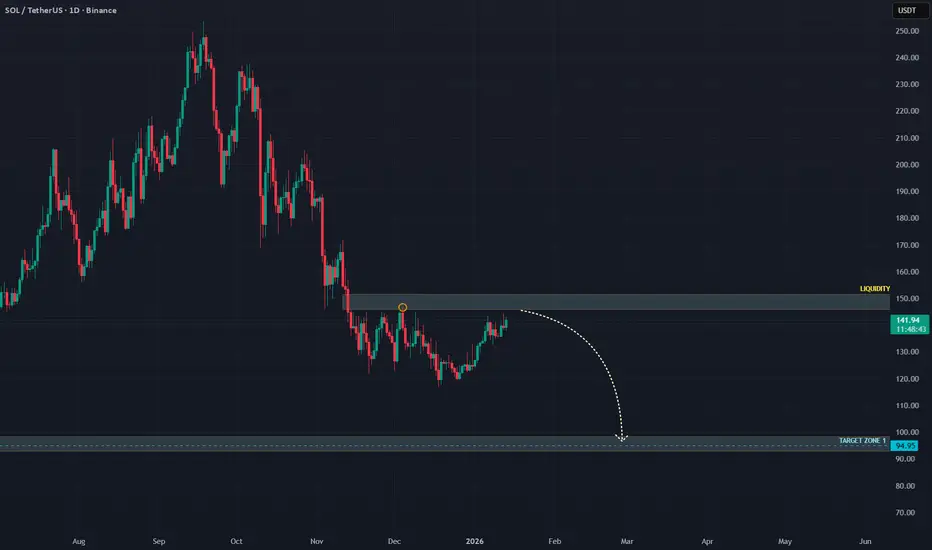
8. The decision zone
The area around $142–145 is the key checkpoint.
This is where supply has been active before, and it is where the market has to prove it can do more than just absorb.
If price:
Pushes slightly higher
Sweeps the liquidity sitting in the blue box
But fails to hold or shows weakening spot follow-through
Then this area becomes a distribution and take-profit zone, not a breakout.
A sweep without acceptance is often the final act before rotation.
If sellers remain patient here, downside opens quickly.
9. Downside focus
Below the current range, the structure is thin.
There is unfinished business lower, and price has not spent enough time there to build support.
Target zone: $94–100
This area stands out because:
It previously acted as acceptance
Liquidity is concentrated there
It represents a clean mean reversion for the entire move
If price starts to roll from the current region, this zone becomes the primary magnet.
Moves like this rarely stop halfway.
10. How to read it in real time
A push into the blue box followed by stalling price and slowing spot CVD → distribution
Spot CVD still rising but price failing to hold → absorption, not strength
Spot CVD rolling over at highs → rotation starting
The market does not need to break down immediately.
It only needs to stop rewarding buyers.
When that happens, the path lower opens fast.
------------------------------------------
The market is leaning into supply.
It may take one more push into liquidity before the real move starts, but the risk remains skewed lower as long as buyers are not being rewarded.
Let price do the talking.
If this analysis helped you see the structure more clearly, a like is always appreciated.
Feel free to share your thoughts or alternative scenarios in the comments.
Thanks for reading.
MUBARAK/USDT at a Critical Trendline – Breakout or Rejection?On the 2D timeframe, MUBARAK/USDT remains in a medium to long-term downtrend. Since its previous peak, price action has consistently formed lower highs and lower lows, confirming sustained selling pressure.
Currently, price is attempting a recovery and is now approaching the main descending trendline, making this area a critical decision zone for the next major move.
---
Pattern & Structure Explanation
1. Descending Trendline (Major Dynamic Resistance)
The yellow trendline represents a key dynamic resistance that has rejected price multiple times in the past.
As long as price stays below this trendline, the overall structure remains bearish.
2. Bearish Continuation Structure
After the strong breakdown in October, price entered a weak recovery and consolidation phase.
The current upward move is still considered a pullback unless a confirmed breakout occurs.
3. Horizontal Key Levels
0.02660 USDT: Important horizontal resistance and previous reaction zone.
0.02320 USDT: Short-term equilibrium / minor resistance currently being tested.
0.02100 – 0.02000 USDT: Nearest support zone.
0.03800 USDT: Next major resistance if a bullish breakout happens.
---
Key Levels
Dynamic Resistance: Descending trendline
Horizontal Resistance:
0.02660 USDT
0.03800 USDT
Main Support:
0.02100 – 0.02000 USDT
0.01700 USDT (next downside support)
---
Bullish Scenario
The bullish scenario is only valid if price breaks and closes clearly above the descending trendline.
Bullish confirmation:
Strong 2D candle close above the trendline
Price holds above 0.02660 USDT
Potential upside targets:
TP 1: 0.02660 USDT
TP 2: 0.03200 USDT
TP 3: 0.03800 USDT
A breakout supported by increasing volume would signal a trend reversal from bearish to bullish.
---
Bearish Scenario
The bearish scenario remains dominant if price gets rejected at the descending trendline.
Bearish confirmation:
Clear rejection or long upper wicks near the trendline
Failure to close above 0.02660 USDT
Downside targets:
Support 1: 0.02100 – 0.02000 USDT
Support 2: 0.01700 USDT
Rejection at this level would confirm that the current rise is only a dead cat bounce or pullback within a broader downtrend.
---
Conclusion
MUBARAK/USDT is currently trading at a critical decision zone.
Trendline breakout → potential bullish reversal
Trendline rejection → continuation of the downtrend
Traders should wait for clear confirmation before entering large positions, as this area carries a high risk of false breakouts.
---
#mubarak #mubarakusdt #cryptotrading #technicalanalysis #downtrend #trendline #altcoinanalysis #binance #priceaction #supportresistance

Solana ~ TRADE The CHOP: 3 Ways to Make ATLEAST +15%Choppy markets are identified by low volume and sideways trading / range trading. It seems uninteresting in most cases, but you don't have to sit around and wait for the next big impulse wave!
Here are three plays YOU can take during choppy markets:
1) 4H : Short Resistance
Chop trading can be a blessing - the price often touches the same support zone and the same resistance zone 2 - 3 times, before breaking out either way. This means that if you spot your zone early, you could take a short timeframe swing trade. Another way to find a trade is to look for gaps in the candles, for example:
2) 4H : Long Support
South Africa is in a time of turbulence, and the Rand is unpredictable as the effects of G20 settle in. During these times, and this counts for all markets, placing a low risk leveraged long on support is a way to trade the chop:
3) Daily : SPOT Hold to TP Zone
Nothing like a classic low risk trade - but you may need some patience with it! If you're not willing to look at charts all day, or have alarms wake you up at 2:30am to take a trade then this is your style., for example:
What do you do during choppy markets?

SOLUSDT M15 HTF FVG Rejection and Bearish Continuation Setup📝 Description
CRYPTOCAP:SOL failed to reclaim recent highs after an impulsive move and is now consolidating below key M30 FVG zones. The price action appears corrective, with downside liquidity still acting as the main draw.________________________________________📈 Signal / Analysis
Primary Bias: Bearish while price remains capped below the M15 supply and FVG rejection zone
Preferred Setup:
• Entry: 140.05
• Stop Loss: Above 140.50
• TP1: 139.30
• TP2: 138.42
• TP3: 137.72 (HTF draw / lower liquidity)
________________________________________
🎯 ICT & SMC Notes
• Rejection from stacked M30 FVGs confirms valid short-term supply
• Current structure aligned with a corrective retracement before continuation
• Liquidity resting below recent lows remains the main magnet
________________________________________
🧩 Summary
CRYPTOCAP:SOL is showing signs of exhaustion after failing to reclaim higher structure. As long as price remains below the defined supply zone, downside continuation toward lower PD arrays is favored, with targets aligned to internal and HTF liquidity.
________________________________________
🌍 Fundamental Notes / Sentiment
With expectations of a stronger USD driven by this week’s US data, risk appetite remains weak. As a result, crypto assets like SOL are vulnerable to downside, with any rebounds likely corrective.
________________________________________
⚠️ Risk Disclosure
Trading involves substantial risk and may result in capital loss. This analysis is for educational purposes only and does not constitute financial advice. Always apply proper risk management, predefined stop-loss levels, and disciplined position sizing aligned with your trading plan.

SOLANA - Your ticket to Lambo!Across all altcoins Solana looks the strongest:
Liquidity sweep
Shift on 4h TF
Most volume on the bottom
Great choice for mid-long term investment/speculation
Potentialy price can move ~80% or more , but i really like to buy it here
my avg entry is 124
Follow for more

$SOL 1D update: Things are looking up SOL is still in the process of breaking out of the broader downtrend, even though the move hasn’t been clean or impulsive yet.
After spending months respecting the descending channel, price has now pushed out of the lower boundary and is holding above the $125 area, which was previously acting as key support inside the downtrend. That’s an important structural shift. Instead of making fresh lower lows, SOL is now forming higher lows and building above former demand.
The recent push toward the $135–140 area shows buyers are willing to step in earlier, rather than waiting for a full return to the lower channel. While price is still below major resistance near $160–180, the character has changed from trend continuation to basing and early breakout behavior.
This doesn’t mean SOL is in a confirmed uptrend yet. Breakouts from long downtrends are often messy, with overlap, pullbacks, and false starts. What matters is that downside follow-through has stalled and price is no longer accelerating lower.
As long as SOL continues to hold above the $125 level and avoids slipping back into the channel, the bias remains that this is an early trend transition rather than just another dead cat bounce. The next key test will be whether this breakout can hold on retests and eventually reclaim higher resistance, but structurally, SOL is still breaking out of the downtrend.

[SHORT] SOLUSDT - Another Move!HTF Market still in Bearish Trend.
Waiting for signal Breakout the 15m trendline, -> Bearish Engulfing then Entry!
Be Ready for SHORT, The TP is in the Chart

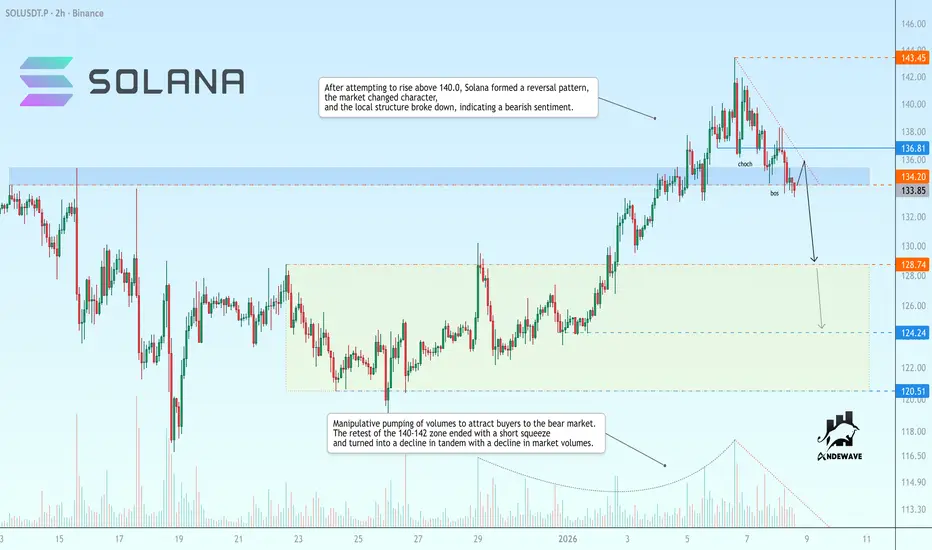
SOLUSDT is poised to break support before falling Manipulative pumping of volumes to attract buyers to the bear market. The retest of the 140-142 zone ended with a short squeeze and turned into a decline in tandem with a decline in market volumes
After attempting to rise above 140.0, Solana formed a reversal pattern, the market changed character, and the local structure broke down, indicating a bearish sentiment.
If the coin closes below 134, the market may intensify the sell-off and decline to 128.75 - 124.25
Scenario: A retest of 134.2 - 136.8 may confirm market weakness. If the price consolidates below this area, it may cause further price decline
ETH/USDT | From this FVG to the other! (READ THE CAPTION)By analysing the 2h chart of ETHUSDT, we can see that 3308, it dropped in price all the way down to the lower FVG's high, showing an initial reaction before dropping in the FVG zone yet again. It is currently being traded at 3109. I expect it to hit the Consequent Encroachment of the FVG and then going back up to test the high of the FVG again.
Current targets: 3113, 3124, 3136, 3148 and 3160.

SOLANA road map (daily) !After the drop, the price can slightly bounce back up if buyers support it and we have a price correction. If the red trendline is broken, the price can move to the ranges we have specified.

SOL/USDT | Back to the demand zone (READ THE CAPTION)As you can see in the 4H chart of SOLUSDT, After an initial run to 143.48 level, Solana has dropped in price again, reaching the demand zone it was stuck to for a matter of weeks at 133.79 level, it is currently being traded at 134.80, barely above the demand zone.
It is expected for it to retest the IFVG.
For the time being, Bullish targets: 136, 137.20, 138.40 and 139.60.
Bearish targets: 133.80, 132.65, 131,50 and 130.35.

XAUUSD | Still bullish! (READ THE CAPTION)In the hourly chart of XAUUSD we can see that after reaching 4500 in the early hours of Wednesday, Gold dropped all the way to 4415, a massive drop of 850 pips! However, after hitting the C.E. of the FVG and closing the smaller FVG in that zone, it retraced and reached 4439. At the moment, it is being traded 4430, and I believe Gold will go back up soon enough.
For now the targets are: 4440, 4453, 4466 and 4479.
