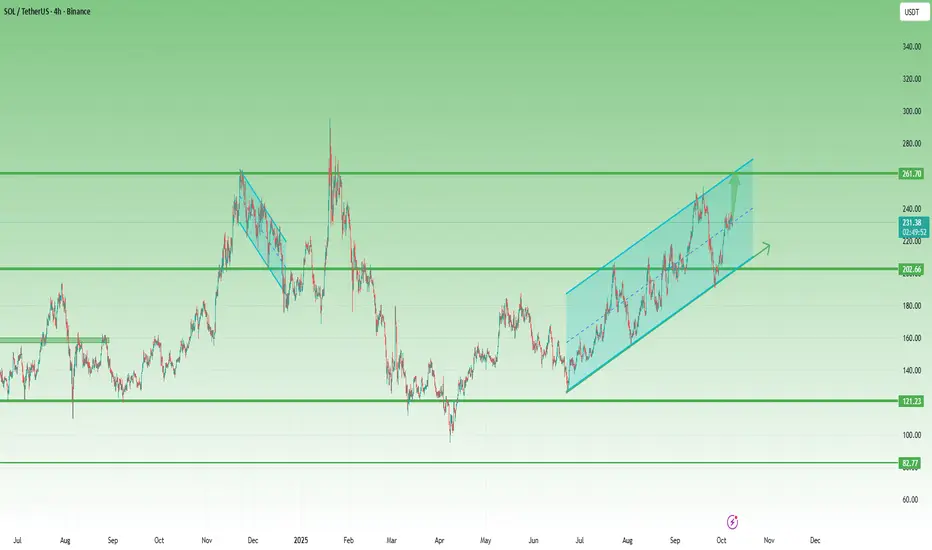
Solana in an Ascending Channel – Bulls Must Hold Above 215After the strong correction from 300 to below 100, Solana finally started to recover. Following an impressive 90% rebound, the price corrected again but managed to form a higher low just above the 120 support zone — a constructive signal for medium-term buyers.
Since then, Solana has been trading inside an ascending channel, showing consistent bullish control with well-defined higher highs and higher lows.
Recently, the market spiked slightly below 200, only to confirm the lower boundary of this channel before bouncing back.
In my previous SOLUSDT analysis, I mentioned that it was imperative for bulls to hold the 200 level to validate the ongoing reversal structure — and that’s exactly what happened. The market respected this support zone perfectly, leading to a 15% advance since then.
At the time of writing, Solana is consolidating near the midline of the ascending channel, suggesting a temporary pause before the next potential leg higher.
If this consolidation breaks to the upside, the next key target for bulls is 260, a confluence resistance formed by the upper boundary of the channel and the November 2024 swing high.
________________________________________
🔹 Summary
• Strong support: 200 (confirmed)
• Ideal bullish threshold: Above 215
• Next resistance: 260 followed by 300
• Structure: Ascending channel – continuation pattern
________________________________________
In conclusion, Solana remains bullish while holding above 200, but ideally, the price should stay above 215 to preserve upside momentum.
A breakout above 240 would likely trigger a test of 260 followed by 300, which becomes very probable— the next key resistance zone. 🚀
Solana
SOLUSD - Up Channel A sharp up channel has formed on solana's daily chart
im allowing further movement up as price bounces off the fib circle ring
bullish towards the top of channel
Bitcoin hits all-time high, altcoins follow suit!Bitcoin (BTCUSD) has smashed a new all-time high, reaching $125,700! The rally is fueled by steady inflows into spot ETFs, rising institutional interest, expectations of a softer Fed policy, and growing demand for safe-haven assets. Additional tailwinds include tech upgrades across networks and a revival in trading activity. This historic milestone for Bitcoin has lifted the entire crypto market. Investors are turning their attention back to top-10 altcoins — names with strong recognition, loyal communities, and clear development roadmaps.
Ethereum (ETHUSD) — trading around $4,558.76. The network has undergone major upgrades, making wallets more user-friendly and transactions faster and more stable. Layer-2 solutions are gaining traction, fees are becoming more predictable, and the network load is better distributed. As a result, investor interest in ETH-based tools and its ecosystem continues to grow. If Ethereum’s roadmap stays on schedule, it could further strengthen its position as the go-to platform for decentralized applications.
Solana (SOLUSD) — around $233.30. The ecosystem is preparing a high-performance validator module aimed at significantly boosting speed and resilience. This is critical for high-traffic use cases like exchanges, gaming, and micro-payment services. Solana is also set to gain the spotlight during a major industry conference later this year — a typical launchpad for new partnerships, grants, and product announcements. If improvements are implemented successfully, Solana could gain more ground in the fast and low-cost transactions segment.
BNB (BNBUSD) — approximately $1,208.83. The network continues to cut costs for users and developers, expand its toolkit for launching apps, and maintain price stability through regular supply control. The easier it becomes to build and scale on BNB Chain, the greater the volume — and the stronger the token demand. With security and performance updates expected on schedule, BNB remains a top-tier infrastructure asset.
FreshForex analysts believe Bitcoin’s record high reaffirms the global appetite for digital assets, while strong developments across major altcoins add depth and resilience to the market. Q4 2025 could deliver solid returns for active buyers — with the most powerful surge expected in Q1 2026.

Long the king, and short the "Sol" Jack ?Being long Bitcoin is being long on a healthy market rally with BTC.D bouncing, and therefore Bitcoin leading.
If BTC.D bouncing means an overall retrace on the market, I think Sol makes a good candidate for a short position to target 150s
I think the DATs and the ETF narratives are getting pretty exhausted, and that could make an extra argument, even if this is the part where it gets tricky (timing tops is hard).
Still, i think playing this with 30/40% of the Bitcoin long is EV+
Game on!

BNB/USDT | BNB Smashes $1200 Target – Momentum Remains Strong!By analyzing the BNB (Binance Coin) chart on the weekly timeframe, we can see that the price continued its bullish rally exactly as expected, breaking multiple new all-time highs (ATHs) and hitting the $1200 target.
It’s now trading around $1220, and the previous analysis remains valid. The next upside targets are $1400 and $1550, while the main support and demand zone lies between $980–$1050.
This setup has delivered over 30% profit so far — hope you made the most of it!
Please support me with your likes and comments to motivate me to share more analysis with you and share your opinion about the possible trend of this chart with me !
Best Regards , Arman Shaban

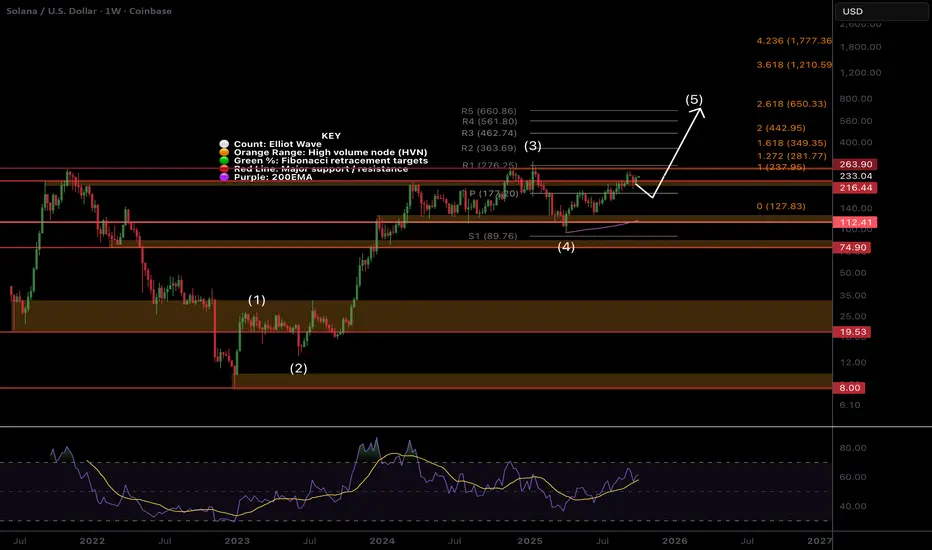
SOL Macro - Time for Price discovery?$SOLWeekly RSI has returned to the EQ giving Solana plenty of space for upside growth! Price is attempting to break into all time high but just can’t find the momentum it needs. This is good thing for now, keeping volatility to a minimum!
Weekly R5 Pivot and Fibonacci extension targets are $660. Price is above the weekly pivot showing the uptrend is in tact and may well test it as support again!
Consolidating under resistance for an extended period often leads to a breakout!
Safe trading
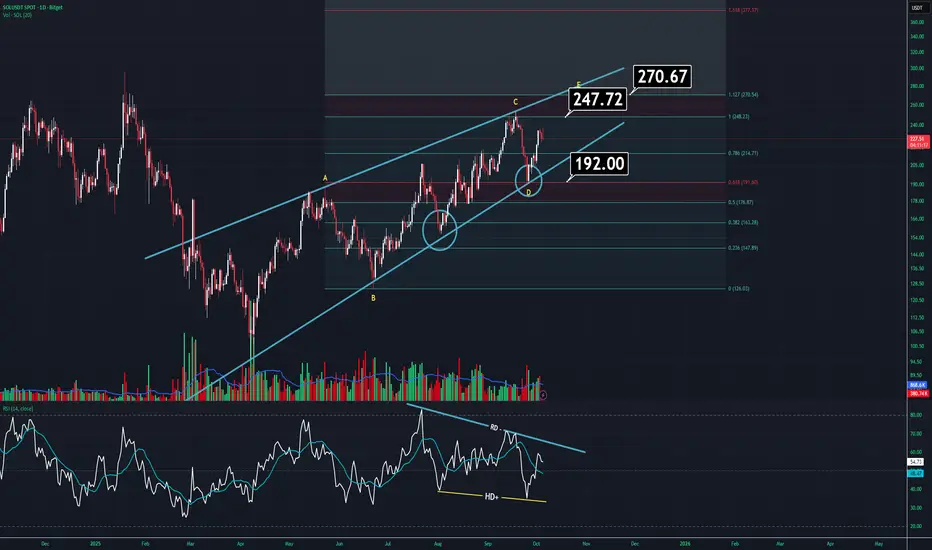
SOLANA UPDATE (1D)SOL is currently at a decision point, mainly due to both the ongoing recession and the delayed ETF approvals.
On the daily chart, it’s getting squeezed inside a large wedge pattern. Normally, it should make one more top before breaking down. However, just to be clear — if price drops below 192, there’s a strong possibility of a sharp sell-off. That’s where both the character shift and wedge breakdown would occur.
Some additional details:
Volume is flat and indecisive. It’s moving in line with the wedge, which isn’t a great sign. Typically, this kind of volume behavior is seen during wedge formations.
The RSI looks unusual — there are both negative and hidden bullish divergences. If you’re wondering which one matters more, it’s the hidden bullish divergence — it’s the stronger signal here.
If the recent high is broken, we could see SOL climbing towards the 270 region, after which we’ll know whether the wedge remains valid. However, in general, the outlook doesn’t look too strong at the moment.
TradersCity Pro | Solana Bulls Eye Breakout Beyond Resistance👋 Welcome to TradeCity Pro!
In this analysis, I’ll be breaking down Solana (SOL),one of the most popular “Ethereum Killer” projects, currently ranked #6 on CoinMarketCap with a market cap of $122.87B.
⌛️ 4-Hour Timeframe
On the 4-hour chart, Solana started a bullish move after being supported at the $194 zone. Once it broke the trigger at $213.14, it rallied strongly toward the next resistance zone I’ve marked on the chart.
✨ At the moment, that bullish wave has cooled off. The RSI has exited the overbought zone, and price has been rejected from the resistance ceiling.
✔️ The next bullish trigger we’re watching will be a clean breakout of this resistance zone. On future retests, we can identify the exact resistance level more precisely and use it as an actionable entry trigger.
⭐ The main resistance for SOL is at $248.58. A breakout here would confirm the start of a larger bullish wave in the higher cycles. That’s why it’s important to already have a position before this breakout—so if the level flips, you’re not left behind and your earlier long runs into solid profit.
🔍 If price pulls back, the outlook remains bullish as long as SOL stays above $213.14. In that case, I see more probability for the next bullish leg than for a trend reversal.
📊 However, if $213.14 breaks and price consolidates below it, that would be the first confirmation of a bearish shift and a possible trend reversal.
📝 Final Thoughts
Stay calm, trade wisely, and let's capture the market's best opportunities!
This analysis reflects our opinions and is not financial advice.
Share your thoughts in the comments, and don’t forget to share this analysis with your friends! ❤️

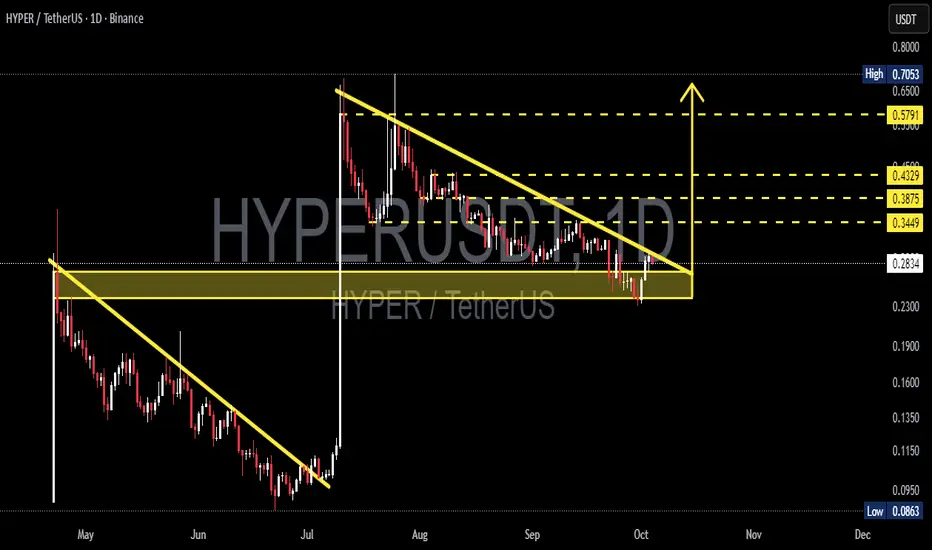
HYPER/USDT — Descending Triangle: Breakout or Breakdown?🔎 Overview
HYPER/USDT is currently trading inside a crucial consolidation zone (0.23–0.29 USDT) while being compressed by a descending trendline.
This setup forms a descending triangle pattern, typically a bearish continuation, but in some cases (especially after a strong rally), it can act as an accumulation phase before another bullish leg.
The market is now at a decision point — waiting for either a confirmed breakout to the upside or a breakdown below support.
---
📌 Pattern & Market Structure
Previous Trend: Strong pump in early July → followed by consolidation with selling pressure.
Main Pattern: Descending Triangle = flat horizontal support + descending trendline of lower highs.
Support Zone: 0.23 – 0.29 (highlighted yellow box on the chart).
Key Resistance Levels (if breakout occurs):
0.3449 → initial target
0.3875 → mid resistance
0.4329 → major resistance
0.5791 → extended target if momentum continues
Historical High/Low: High 0.7053 / Low 0.0863.
---
🚀 Bullish Scenario
1. Confirmation: A strong daily close above the descending trendline, ideally above 0.31.
2. Retest: Breakout gains strength if price retests the trendline and holds as new support.
3. Upside Targets:
TP1: 0.3449
TP2: 0.3875
TP3: 0.4329
TP4: 0.5791 (if rally extends)
4. Invalidation: A daily close below 0.23 invalidates the bullish setup.
---
🐻 Bearish Scenario
1. Confirmation: A daily close below 0.23 with strong volume confirms breakdown.
2. Downside Targets:
0.16 – 0.135 zone → historical support area
0.0863 → previous cycle low, major bearish target
3. Invalidation: If price reclaims and sustains above 0.34, the bearish outlook fails.
---
⚖️ Conclusion & Outlook
Neutral Zone: As long as price stays between 0.23 – 0.30, the market remains sideways without clear direction.
Bullish Outlook: Needs confirmation with daily close above trendline.
Bearish Outlook: Breakdown below 0.23 would shift momentum clearly bearish.
Best Strategy: Wait for confirmation on daily close & volume before entering, since descending triangles are prone to false breakouts.
---
📝 Notes for Traders
Apply strict risk management (1–2% risk per trade).
Take partial profits at each resistance level.
Focus on daily closes and volume spikes for confirmation, not intraday wicks.
---
#HYPERUSDT #Crypto #TechnicalAnalysis #Altcoin #PriceAction #ChartPattern #DescendingTriangle #Breakout #Bearish #Bullish #SupportResistance
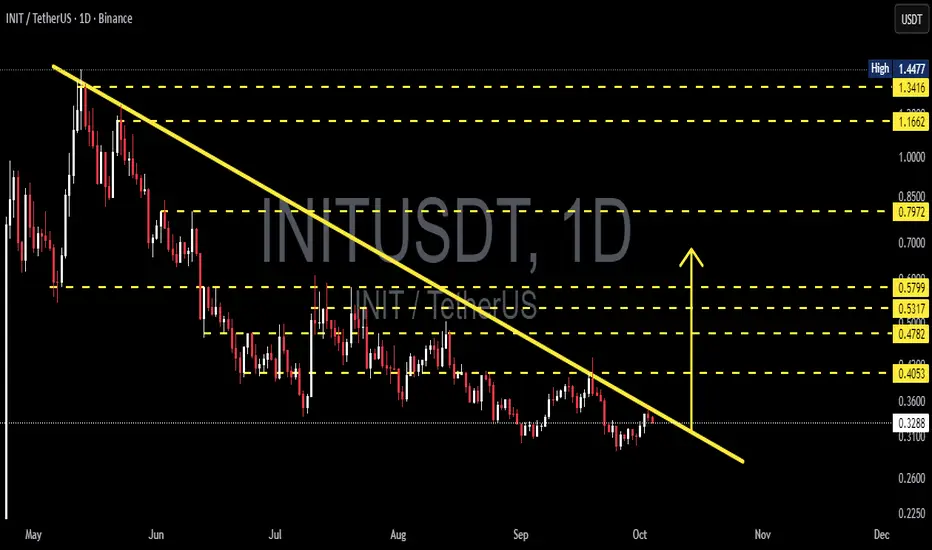
INIT/USDT — Breakout or Continuation of Downtrend?🔎 Chart Analysis
INIT/USDT has been in a clear downtrend since its peak earlier this year. The yellow descending trendline connecting the series of lower highs continues to act as a major dynamic resistance. Current price is trading around $0.3295, right at a critical decision zone.
Key elements on the chart:
Main Trend: Bearish (lower highs & lower lows).
Dynamic Resistance: Descending trendline (yellow).
Horizontal Resistances: $0.4053 – $0.4782 – $0.5317 – $0.5799 – $0.7972 – $1.1662 – $1.3416 – $1.4477.
Nearest Support: Consolidation zone around $0.3000 – $0.3100.
The price is now pressing against the trendline. A decisive move (breakout or rejection) will determine the next major direction.
---
📈 Bullish Scenario
1. Breakout Confirmation: Daily close above the descending trendline is required.
2. Retest Validation: A successful retest of the broken trendline turning into support would strengthen the bullish case.
3. Upside Targets:
First target: $0.4053 (+23%)
Next levels: $0.4782 (+45%), $0.5317, $0.5799
Extended targets: $0.7972, $1.1662, $1.3416, up to $1.4477 if a trend reversal solidifies.
4. Risk Management: Stop loss can be placed slightly below the retest level or below the $0.31 support zone.
---
📉 Bearish Scenario
1. Rejection at Trendline: If price gets rejected at the yellow line, the downtrend remains intact.
2. Breakdown of Support: A daily close below $0.30–$0.31 support zone could trigger a move to new lows.
3. Trading Plan: Aggressive traders may short at trendline rejection with stops above the rejection candle; conservative traders may wait for a breakdown + retest confirmation.
---
📊 Pattern & Structure
The chart highlights a descending trendline pattern, typical of bearish market conditions. However, the longer the price tests this resistance, the higher the chance of a breakout. At this stage, INIT is clearly at a make-or-break level.
---
📝 Conclusion
A confirmed breakout above the trendline could trigger a trend shift to bullish.
A rejection at the trendline confirms further downside pressure.
Horizontal levels act as step-by-step targets/resistances.
Risk management is crucial here due to the high probability of false breakouts.
---
#INITUSDT #INIT #Crypto #Breakout #Downtrend #BullishScenario #BearishScenario #TechnicalAnalysis #SwingTrading
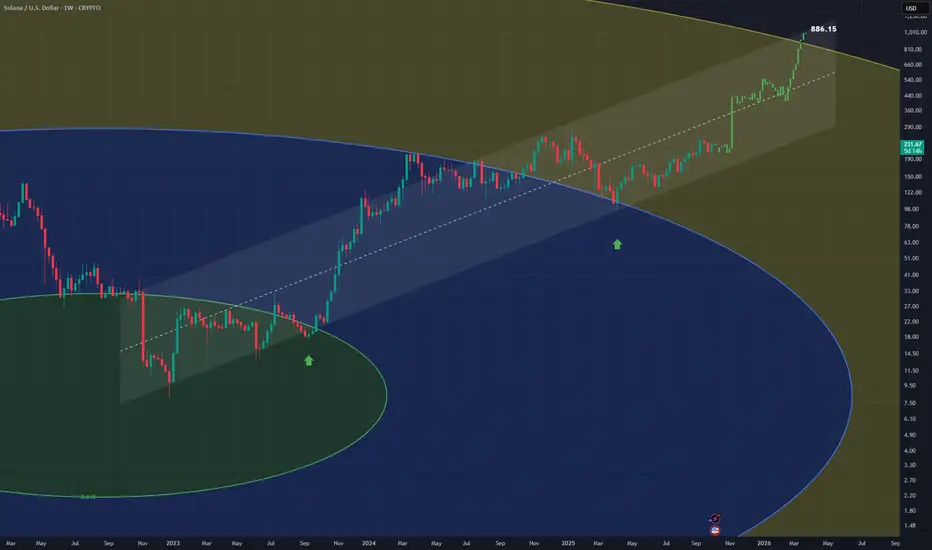
SOL: Ready for a Big MoveWe can see CRYPTOCAP:SOL is currently in a period of accumulation, just like it was back in 2021 before a massive rally . The key rising support line has been holding up strong, and after periods of accumulation, the price has consistently exploded upwards, reaching new highs.
Right now , the price is approaching its previous all-time high (ATH), and if history repeats itself, we could be in for another "boom" phase. The price is holding well above the key support, which strengthens the bullish outlook.
Keep an eye on the price action around the ATH level, if we break through, it could signal the next major leg up. This setup looks very similar to past accumulation phases that led to significant price jumps.
#PEACE
Stay tuned for more updates

Bonk InuSEED_DONKEYDAN_MARKET_CAP:BONK 💹
Bonk Inu, one of the pioneers of the Solana memecoin category, is heading toward new highs with a broadening wedge.

SOLUSD sell at Market PriceHi everyone.
I think we can sell our Solana at this level.
I'll partial exit at first tp that I mentioned, and I think it will has potential to go lower.
Let's see what happens.
Good luck.
Dear traders, please support my ideas with your likes and comments to motivate me to publish more signals and analysis for you.
Best Regards
Navid Nazarian

Solana SOL price analysis📞 Rumor has it that as soon as the global geopolitics reach a “temporary lull”, the following ETFs will be launched
Solana ETF is the most likely to be the next one (but there are at least 2 coins more on the list, which we will talk about in the coming days)
🪙 So, are you ready to buy CRYPTOCAP:SOL in your investment portfolio? For example, in the range of $117-123
🤖 Maybe we need to launch a long trading bot OKX:SOLUSDT so that it can buy in micro portions on the current possible price correction to get a “tasty price” as a result
◆ Would you like to join such a trading bot and copy them?
◆ And then compare the results with all “ETF candidates”
_____________________
Did you like our analysis? Leave a comment, like, and follow to get more

ETH/USDT | ETH Weekly Setup – Strong Demand Pushes Toward $6K!By analyzing the Ethereum chart on the weekly timeframe, we can see that after entering the $3,800 demand zone, ETH gained strong buying pressure and reached the $4,200 and $4,600 targets.
Currently, Ethereum is trading around $4,500, up about 19%, and I expect further bullish movement soon. The next upside targets are $4,950, $5,500, and $6,000.
THE LATEST TA :
Please support me with your likes and comments to motivate me to share more analysis with you and share your opinion about the possible trend of this chart with me !
Best Regards , Arman Shaban

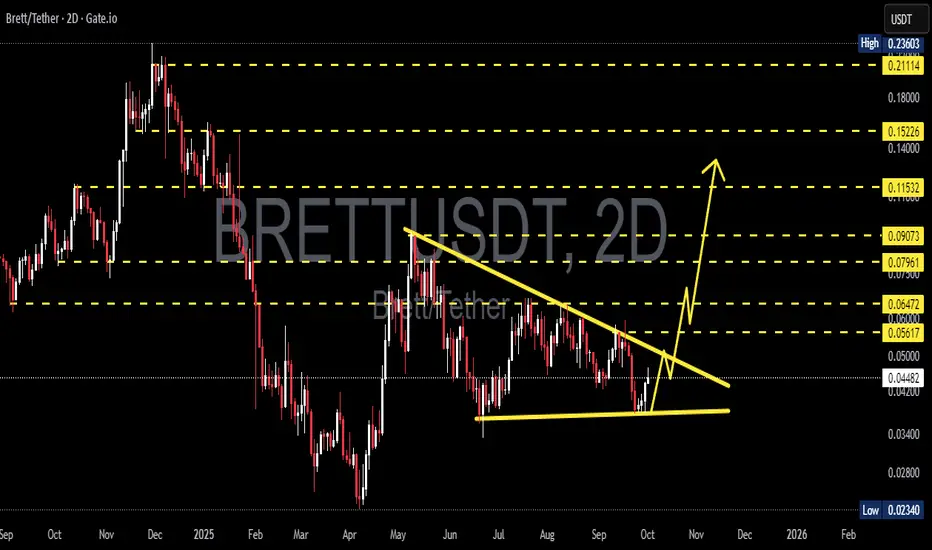
BRETT/USDT — Triangle: Market Compression Before a Big Breakout?🔎 Pattern Analysis
BRETT/USDT is currently trading inside a contracting triangle (descending resistance + flat/rising support). This pattern shows:
Lower Highs: sellers consistently pressing the price lower.
Higher Lows / Flat Support: buyers holding the floor strongly.
The market is in a “pressure cooker” phase — volatility is shrinking, and once price escapes, the move is usually explosive.
Technically, a symmetrical triangle is neutral, but since the prior trend was bearish, probabilities lean slightly bearish unless a breakout to the upside is confirmed with strong volume.
---
📈 Bullish Scenario
If price breaks upward:
1. Trigger: 2D candle close above 0.05617 with strong volume.
2. Healthy Retest: price pulls back to confirm support and then bounces.
3. Upside Targets:
TP1: 0.06472 (+44%)
TP2: 0.07961 (+77%)
TP3: 0.09073 (+102%)
TP4: 0.11532 (+156%)
TP5 (measured move / extension): 0.130–0.150 (strong momentum case).
4. Psychology: breakout means buyers take control, and if BTC/ETH are stable or bullish, momentum could accelerate.
---
📉 Bearish Scenario
If price breaks downward:
1. Trigger: 2D candle close below 0.038–0.040 with strong volume.
2. Failed Retest: price retests support turned resistance and rejects.
3. Downside Targets:
TP1: 0.03400
TP2: 0.03000
TP3: 0.02340 (major low, nearly −48% downside).
4. Psychology: breakdown signals capitulation — sellers dominate while buyers step aside.
---
🎯 Measured Move
Applying the height of the triangle gives a projected target:
Upside breakout: 0.11 – 0.13
Downside breakdown: 0.023 – 0.025
---
⚖️ Risk & Money Management
Confirmation is key: wait for a 2D close + volume, not just intraday wicks.
Stop Loss:
For longs → below triangle support / under 0.039.
For shorts → above triangle resistance / above 0.056.
Risk/Reward: aim for at least 1:2 before entering.
Position sizing: risk only 1–2% of total capital per trade.
---
🚨 Key Catalysts to Watch
1. Bitcoin & Ethereum trend: if BTC dumps, alts usually follow.
2. Liquidity/volume: thin order books risk false breakouts.
3. News/events: project updates, listings, or partnerships can be catalysts.
4. Macro market: US equities, Fed policy, and the Dollar Index (DXY) often influence crypto capital flows.
---
📝 Summary
BRETT/USDT is compressing inside a 2D contracting triangle, and volatility is set to expand.
Bullish trigger: 2D close >0.05617 + volume → targets 0.0647 / 0.0796 / 0.0907 / 0.115–0.13.
Bearish trigger: 2D close <0.038–0.040 → targets 0.034 → 0.030 → 0.0234.
Golden rule: wait for confirmation (2D close + strong volume) to avoid false breaks.
This setup provides a clear trading map with defined upside/downside levels, offering opportunities in both directions.
---
#BRETT #BRETTUSDT #Crypto #Altcoin #TechnicalAnalysis #TrianglePattern #Breakout #SupportResistance #CryptoTrading
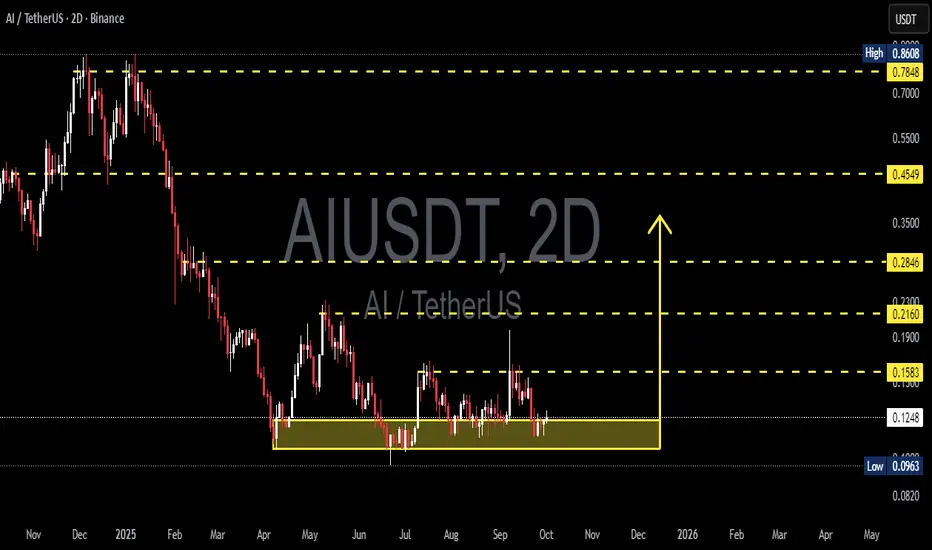
AIUSDT (2D) — Entering a Major Accumulation Phase?Overview:
AIUSDT is currently in a deep accumulation phase after a long decline from the peak at 0.8608. Price is consolidating within the critical support zone of 0.0963 – 0.1257 (highlighted in yellow). This level has been tested multiple times, showing strong interest from both buyers and sellers.
On the 2D timeframe, the structure suggests that the market is waiting for a decisive move: will this support hold as the base for a reversal, or will it break down to extend the bearish trend?
---
🔑 Key Technical Levels
Main Support: 0.0963 – 0.1257
Secondary Support: 0.0820 (historical level)
Key Resistances:
0.1583 → first breakout confirmation
0.2160 → strong psychological resistance
0.2846 → major swing target
0.4549 → higher timeframe resistance
0.7848 → major supply zone from previous distribution
---
📈 Bullish Scenario
Trigger: A confirmed 2D close above 0.1583 with solid volume.
Momentum confirmation: Formation of higher lows and strong bullish candles.
Upside targets:
1. 0.1583 (initial resistance)
2. 0.2160 (trend validation)
3. 0.2846 (swing extension)
Bullish signals: RSI bullish divergence or a bullish engulfing candle forming at support.
---
📉 Bearish Scenario
Trigger: A confirmed 2D close below 0.0963 with increasing sell volume.
Retest confirmation: If price retests the 0.0963 – 0.1257 zone and fails to reclaim it, the area turns into resistance.
Downside targets: Next support at 0.0820, with risk of further price discovery to the downside.
Bearish signals: Long upper wicks near resistance combined with strong selling volume.
---
📊 Structure & Pattern
Current structure resembles an accumulation range following a prolonged downtrend.
The longer price stays within this range, the stronger the eventual breakout or breakdown move is likely to be.
This pattern could evolve into re-accumulation or redistribution, depending on the direction of confirmation.
---
🎯 Trading Strategy
For bulls: Consider entries near support with bullish confirmation, SL below 0.09, targets scaled across resistance levels.
For bears: Wait for a confirmed breakdown below 0.0963, enter on failed retests, SL above 0.1257, target down to 0.0820.
Note: Always apply risk management (max 1–2% risk per trade).
---
📌 Conclusion
AIUSDT is at a critical decision zone. This range will decide whether the market starts a new bullish trend or continues its bearish extension.
Holding support → potential for a strong rally.
Breaking support → continuation of the downtrend.
Traders should wait for volume confirmation and 2D candle closes before committing to a major position.
---
#AIUSDT #CryptoAnalysis#SupportResistance #Altcoin #Breakout #Accumulation #TechnicalAnalysis #SwingTrade #PriceAction
(LSSOL) liquid staked SOL "listing to kraken"A new listing to kraken that went unnoticed is LSSOL. There is Liquid staked Ethereum and now similarly for Solana. Not much else to say, the MCAP is quite small. At the time of processing the information there was around $2.5 million dollars in the bucket. I guess I would say liquid staking is a concept of digital synthetic value that acts as a derivative of the infrastructure of the main company. I've been asking myself why would I buy Liquid Staked Ethereum instead of Ethereum. What is the benefit? The same may be said for LSSOL. To buy Solana or the Liquid Staked Version. You gain the process of staked value on top of holding the value of the price of the mainstream cryptocurrency through an intermediary.

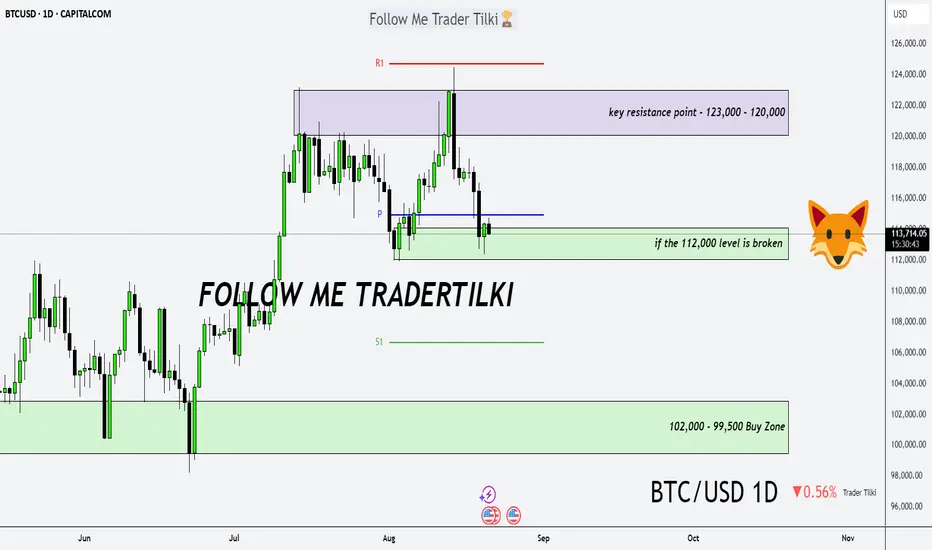
Bitcoin Daily Analysis – The Trend Is Our FriendGood morning, Guys,
I’ve prepared a fresh Bitcoin analysis for you.
🔹 First off, I stand firmly behind my long-term targets of **127,000 – 137,000 – 146,000**. I previously shared these levels with you in a weekly analysis.
🔍 Now let’s shift to the 1-day chart:
What is Bitcoin telling us right now?
📉 If the **112,000 level breaks downward**, we could enter a correction phase toward **102,000** or even **99,500**. I expect strong buying interest to return from those zones.
📈 After that, we’re facing a key resistance structure between **123,000 – 120,000**.
But I believe this zone will also be broken—because we’re in an **uptrend**, and…
💬 **The trend is our friend. Never forget that.**
Speculative **Trade setup** GIGACHADGIGA is a meme token deployed on the Solana blockchain intended to honor the legend Ernest Khalimov the original “Gigachad”, by utilizing the strength of memes and “Chad” energy.
GIGA is a community run project.
On the Daily there is a possible Double bottom forming
Taking this #Meme coin back over 2 cents.
Probably catching a bid from the strong performance shown by #SPX6900
Part of #Murad's meme index.

Solana Breaks $220 on ETF HypeSolana Breaks $220 on ETF Hype, Can the Momentum Sustained?
Solana has broken through the critical resistance at $220, fueled by growing excitement over a potential ETF. Price hit an intraday high of $226.7 as bullish sentiment takes hold. At press time, SOL is trading at $224.35
On the 2-day chart, we can say that the bullish momentum remains intact as the liquidity curve is being respected. The resistance that we need to break is $230, a break above $230 could pave the way toward $260-$270.
If we can establish the $200 as base support, buyers remain in control. However, a drop below $200 might stall the bullish momentum and a possible retest of $160.

Support near 222.61 is key
Hello, fellow traders!
Follow us to get the latest information quickly.
Have a great day!
-------------------------------------
(SOLUSDT 1D chart)
There are many lines drawn, but the important area is ultimately the 179.74-247.50 range.
Among these, a rise above 236.88-247.50 is necessary for a stepwise uptrend to continue.
The key is whether the current 202.45-222.61 range, i.e. the DOM (60) ~ HA-High range on the 1W chart, can provide support and allow for an upward movement.
Therefore, based on the 202.45-222.61 range, we need to monitor whether the price rises above 236.88-247.50 or falls below 179.74.
-
To break through this critical point or range and continue the uptrend,
- The StochRSI indicator must be trending upward. If possible, it should be below the overbought level.
- The On-By-Significant Volume indicator must be trending upward. If possible, it should remain above the High Line.
- The TC (Trend Check) indicator must be trending upward. If possible, it should remain above the 0 level.
-
Thank you for reading to the end.
I wish you successful trading.
--------------------------------------------------

Why Solana Could Surpass $300 in 2025–2026Hey guys, today I want to share my full view on Solana (SOL) .
For a long time, my main focus as an investor and trader was always on Bitcoin and Ethereum. But in the last 12 months, I started massively investing into Solana. The reason is simple: the ecosystem is not only recovering from its darkest days but is now proving real resilience, adoption, and growth.
When FTX collapsed in November 2022, Solana took one of the hardest hits. FTX and Alameda were among the biggest backers of the Solana ecosystem. When they went bankrupt, SOL crashed under $12 and many people stopped believing in its future. The market saw Solana as “FTX’s chain.” But fast forward to today, and we are witnessing a complete turnaround. Users are coming back, new protocols are being launched, and on-chain activity is stronger than ever.
In our crypto prop trading company , we’re building new infrastructure for our traders, and after careful research, we chose Solana as the best chain for implementation . Its speed, scalability, and near-zero fees make it the most practical blockchain to build on. And it’s not just us — many other companies and institutions are starting to integrate with Solana, which will bring even more growth in the months ahead.
⚠️ Quick disclaimer: This is not financial advice — only my humble opinion based on research, analysis, and experience.
Solana Price Action & Key Events (2022–2025)
To understand Solana’s current position, let’s look back at its journey over the last few years:
Bridge Breach (Feb 2022): The Wormhole bridge hack stole ~$325M, hurting trust in Solana DeFi.
DeFi Winter (May 2022): The Terra UST/LUNA collapse triggered a full liquidity crisis across all DeFi. Solana’s TVL drained fast.
FTX Implosion (Nov 2022): The turning point. FTX and Alameda went bankrupt, SOL crashed under $12, and the bear market bottom was defined.
Meme Season (Early 2024): Retail users came back with BONK and other meme coins. Solana’s speed and low fees made it the perfect hub for speculation.
WIF Mania (Spring 2024): Dogwifhat (WIF) went viral, volumes on Solana even surpassed Ethereum at times.
Pump.fun Frenzy (Apr 2024): Millions of tokens launched through Pump.fun, onboarding hundreds of thousands of wallets and driving record on-chain activity.
Full Recovery (2025): After two years of stagnation, SOL broke above $200 again, fully recovering to pre-FTX levels and proving that it can thrive as a community-driven, retail-driven chain.
Solana On-Chain TVL (Total Value Locked)
TVL (Total Value Locked) shows how much capital is locked in DeFi protocols on Solana — lending, staking, DEXes, and yield farming.
2021–2022: First boom, TVL surged past $10B.
2022–2023: Collapse after Terra and FTX, TVL fell close to zero.
2024–2025: Strong recovery — TVL passed $9–10B again, showing users are back and Solana DeFi is alive.
Why this matters: TVL growth proves Solana is not only about meme coins. Capital and liquidity are returning, and users are once again trusting the chain with real money.
Solana DEX Volume & Pump.fun Impact
In just one day, DEXs on Solana processed $10.3B in trading volume.
Pump.fun alone made up ~80% of that ($7.93B).
Pump.fun is unique because it allowed anyone to instantly create and trade tokens, onboarding massive numbers of new users. At its peak, Pump.fun had over 400,000 weekly active addresses , and even today it still makes up around 10% of all Solana DEX activity .
This shows two things:
Solana is the clear leader in retail-driven trading.
The ecosystem still needs broader use cases to sustain growth once meme speculation slows.
Futures Open Interest – Market Confidence
Open interest (OI) in Solana futures collapsed after FTX, but in 2024–2025 it came roaring back, growing alongside SOL’s price.
Positive: Rising OI shows traders trust Solana again, and rallies are backed by real activity.
Risk: Very high OI means higher liquidation risk. If markets turn, leveraged positions could cause sharp corrections.
Pump.fun Traders Data – Not Everyone Wins
According to Dune Analytics, 99.6% of Pump.fun traders never made more than $10K in realized profits . Only a small fraction hit big wins, while most made little or lost money.
This highlights the gambling-style nature of meme trading: it drives huge network activity but is not sustainable long-term. For Solana, the key is converting this short-term hype into long-term adoption.
Why Solana Could Rise in Late 2025–2026
Looking forward, here are the main reasons I believe Solana has strong upside potential:
1. Tokenization Boom
By 2033, $20T in assets could be tokenized.
Solana has the scalability, low fees, and adoption needed to be the leading infrastructure.
2. On-Chain Usage
Solana already surpasses Ethereum in active addresses and transactions (100M monthly users, 3.5B monthly txs).
More usage → more fees → higher staking yield → stronger SOL demand.
3. Institutional Adoption
Major players like BlackRock, Franklin Templeton, Visa, and PayPal are already launching tokenized products or stablecoin integrations on Solana.
4. Ecosystem Growth
Solana dominates in trading, token creation (60% of new tokens), and new sectors like AI agents.
From Pump.fun (retail) to xStocks and OnRe.finance (institutional), Solana is proving versatile.
5. Technology Roadmap
With Firedancer and other upgrades, Solana is moving toward 100k–1M TPS capacity, making it “internet-scale finance.”
6. Investment Case
SOL is scarce (~750M fixed supply), yield-bearing (7–13% staking), and directly tied to network growth.
Analysts project potential 4x–30x appreciation (short-term ~$900, medium ~$2,000, long-term ~$6,000).
Outlook – Target $300+
If 2022–2023 was about survival, and 2024–2025 was about recovery, then 2026 could be Solana’s breakout moment as the backbone of digital finance.
With on-chain activity at record highs, institutional adoption growing, and scalability improvements rolling out, a move above $300 in late 2025 or 2026 is not only possible but realistic.
