SOL Parabolic Run Despite the recent chop, when you zoom out to the 1D timeframe there is a clear pattern being followed since the April crash.
From the sub $100 low Solana has posted progressively higher lows in a parabolic fashion. The highs on the other hand are in more of a linear fashion as shown by the diagonal S/R level, at first it provided support and now since March it has been resistance.
So for me there are two possible actionable trades:
- Continuation of the parabolic move, this would include flipping the Diagonal S/R level, currently at time of writing this resistance level is being tested, a close above gives a better possibility of the rally continuing.
- The rally becomes exhausted and fails to flip the Diagonal S/R and loses the parabolic support level. Should this support break $185 is the first target (light green zone), $160 as the second target (dark green zone).
Important to remember we have CPI & FOMC rapidly approaching that could provide the volatility to trigger either of these moves, lets see what happens next.
Solana

ADA/USDT | Cardano Targets $1 – Pump Ahead? Let's See!By analyzing the Cardano (ADA) chart on the 3-day timeframe, we can see that after our last analysis, the price corrected down to $0.78. Then, with renewed demand, it started rising again and has so far reached $0.89.
Based on the price action, if ADA can hold above $0.85, we could see a strong rally or even a pump. The possible bullish targets are $0.93, $1.00, and $1.05.
Please support me with your likes and comments to motivate me to share more analysis with you and share your opinion about the possible trend of this chart with me !
Best Regards , Arman Shaban

$SOL / $BTC 50WMA Reclaimed - Alt Season Confirmed!Ladies and Gentlemen,
CRYPTOCAP:SOL / CRYPTOCAP:BTC has officially closed the Week above the 50WMA and is back within the POI.
Double bottom confirmed this setup.
Along with the longest cup and handle I’ve ever seen lol.
Let the rotation for Alt Season begin!

SOL/USDT | SOL Breaks 7-Month High – Still Bullish Above $218!By analyzing the Solana chart on the daily timeframe, we can see that the price is still pushing toward higher targets based on the main analysis. It has reached its highest level in the past 7 months and is currently trading around $225.
If the price holds above the key $218 level, we can expect further growth toward levels above $245. This analysis will be updated again. So far, the return from this setup has been more than 52% — I hope you’ve made the most of it!
Please support me with your likes and comments to motivate me to share more analysis with you and share your opinion about the possible trend of this chart with me !
Best Regards , Arman Shaban

DOGE/USDT | Dogecoin Bulls Eye $0.287, $0.32, and Beyond! (READ)By analyzing the Dogecoin chart on the daily timeframe, we can see that, as expected, the price was supported around $0.21, which brought strong demand. This move gave nearly a 20% return, hitting the target at $0.24, and the momentum is still strong. I believe the next target at $0.287 could be reached soon.
The key supply zones are $0.264–$0.289 and $0.305–$0.34. Based on the main analysis, the next possible targets are $0.287, $0.32, $0.41, and even $0.70.
Please support me with your likes and comments to motivate me to share more analysis with you and share your opinion about the possible trend of this chart with me !
Best Regards , Arman Shaban

PUMP NOW THANK ME LATERBeen holding this gem since 0.0028, project has perfect tokenomics with team specialising on draining crypto degen-monkeys, investing profits from pump.fun platform into SPOT token buybacks, no sell-out has been started yet (and it won't be until new ATH).
So I expect at least x2 from current price range in the upcoming weeks with a rapid parabolic-like growth on the daily.
I used basic fibs to mark support/resistance levels, feel free to comment and suggest ideas/takes.
I cannot see a reason to search for any kind of any more advanced patterns because BYBIT:PUMPUSDT is just starting to grow and the trend is mostly towards new price-discovery.
pump.fun has already facilitated over 5.3M token launches since early 2024, generating nearly $800M in revenue and even pulling off a $1.3B ICO in minutes. Current market cap sits above $1.7B with daily volume regularly crossing $200M — massive liquidity for a memecoin-born project. With ~350B tokens circulating (vs. 1T max), the room for valuation expansion is still huge.
So back to 'crypto degen monkeys' - don't become one, chose your exit points cleverly and avoid high margin (I know it might be tempting).

SOL & Memes | Is Solana season here ?From Weekend Hero to Market King
Sol szn is here ? YESS, We are 70% up since our last analysis and recent data strongly suggests we might be entering the early days of SOL mania, Here’s why
1.SOL Outperformed BTC and ETH This Weekend: Solana delivered significantly better returns compared to Bitcoin and Ethereum over the weekend. don't let me compare it with Eth cuz it will break Eth holders Soul
2.Market Cap Milestone: Solana's total market capitalization hit an all time high earlier today, now making up 3.53% of the entire cryptocurrency market with a valuation of $114.3 billion.
3.Dominating Daily Net Inflows: As of now, SOL tops the leaderboard for daily net inflows.
4.Revenue Growth: Last week, Solana’s Real Economic Value (the revenue it generates) doubled its previous all-time high.
5.Meme coins often choose the Solana blockchain for a variety of reasons, primarily due to its unique technical advantages and its growing ecosystem. Here’s why: Low Transaction Costs, High Throughput and Scalability, Fast Transaction Speed, Strong Community and Ecosystem,Developer-Friendly Environment, Early Mover Advantage...
6.Weekend Trading Volumes: Between Saturday and Sunday night, SOL trading volumes surpassed those of all major altcoins.
All of this recent movement is huge for two specific groups of people:
-My wife, who has been worried sick since I told her I invested 100% of my life savings in Solana!
-Our followers, who got worded up on SOL around this time last year and load the dip at 20$
But will these trends hold, especially after ETH and BTC ETFs wrap up their first trading day of the week? Probably not but it’s worth noting how impressive this is, given Ethereum’s market cap is 3.3x larger than Solana’s, and Bitcoin’s is a staggering 16x bigger!
As you can see Sol ready for correction and pullback then it gets ready for Sol Mania

SOLANA (SOL/USDT) – TP: 170 - 252 & 295SOLANA (SOL/USDT) is currently trading at $130.17 after rebounding from a well-defined sell-side liquidity zone between $98 and $131. The recent weekly candle shows a strong bullish recovery (+22.93%), suggesting that liquidity has been swept and buyers are stepping in. This level has historically served as a key accumulation zone, and the bounce aligns with oversold conditions on the StochRSI, which is now curling upward — indicating growing bullish momentum. If price sustains above the $125–131 level, the next immediate upside target lies between $170 and $188, where prior supply and consolidation occurred. A confirmed breakout above this range opens the path toward a higher resistance zone between $254 and $295 — a region that aligns with unfilled inefficiencies and previous price distribution.
The ideal swing trade approach would be to enter on a pullback within the $110–125 range, set a stop loss below $98, and scale out at the $170 and $254 levels. This setup offers a favorable risk-to-reward ratio of approximately 1:3.5.
Trade Strategy Suggestion (Swing or Positional):
Entry: Ladder between $115–$125 on retrace
SL: $105–110 (below wick low)
TP1: $170–188
TP2: $254–295
Scaling Out: 50% at TG1, rest at TG2 or trail stops above $200
With macro tailwinds like renewed interest in Solana’s DeFi and meme coin ecosystems, institutional flow returning, and technical confirmation across multiple timeframes, this could be a high-conviction mid-term play for swing traders and positional investors alike.
🔮 Narrative & Fundamentals:
ETH L2 congestion → SOL gets transactional inflows
SOL’s DeFi, NFT, and memecoin activity resurging (e.g., SEED_WANDERIN_JIMZIP900:WIF , SEED_DONKEYDAN_MARKET_CAP:BONK ecosystem)
Institutional flow picking up (Grayscale SOL trust rallying)
SOL remains one of the fastest L1s with growing developer traction

SOLANA (SOL/USD) C&H TG: 295 → 341→ 370 → 450 → 475 → 523SOL/USD is building a multi-year Cup & Handle on the weekly chart, signaling the potential start of a major long-term bull cycle. Price has reclaimed the breakout trigger at 218.50 and is heading towards the key breakout zone at 260–295. A clean weekly close above this zone can confirm a structural breakout and shift the market structure bullish on the higher timeframe.
Once confirmed, the long-term measured move points to 341–370 initially, followed by extended targets at 450 → 475 → 523. Any sustained hold above 260–295 will likely flip this zone into a strong demand base, supporting a multi-month uptrend.
Ideal strategy for investors: Accumulate gradually on dips near 218.50–230, add on confirmed weekly close above 260, and hold for long-term trend targets with a protective stop below 206 to manage downside risk.

SOLUSDTThis is a bullish setup for BINANCE:SOLUSDT , but the $230 level is crucial for potential reactions. My strategy is to stay bullish and wait for the upcoming US CPI news, then decide whether to buy or sell CRYPTOCAP:SOL based on the news.
⚠️Ensuring your position size aligns with your risk tolerance.

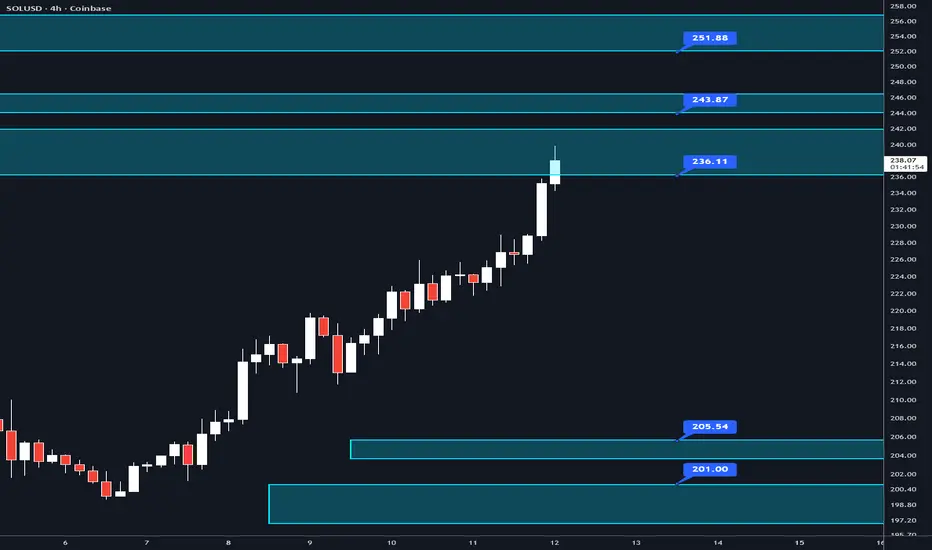
SOLUSD – Key Confluence Levels to WatchHere are some levels on SOLUSD worth noting. The goal is to show how confluence builds around certain areas of price, not to predict direction.
$197 - $201 → Naked weekly level, two naked daily levels, daily naked POC, poor low, and a naked weekly VAL.
$203.50 - $205.50 → Current monthly POC, weekly naked POC, and a poor low.
WHERE SOL IS NOW: $237 - $242 → All time high range POC which is extremely important, and weekly naked VAH.
$244 - $246.50 → Important wick high, all time high range VAH, and a single print.
$252 - $256.50 → Naked weekly, monthly naked POC, weekly naked POC, daily naked POC, weekly time POC, and a naked daily level.
When multiple levels line up (high timeframe levels, point of controls, value areas, liquidity levels, TPO levels, etc), the level tends to attract more attention and liquidity. That makes it an important ‘decision point’ — even without predicting bullish or bearish outcome.
If you’re new to concepts and levels like these, don’t worry — these terms can feel overwhelming at first. Feel free to drop a comment or send me a message if you’d like me to explain any of them in more detail. Always happy to help.
This post is educational only. No predictions or trade signals. If you find this helpful, follow for more breakdowns of confluence levels.
IDOLUSDT - Break or Breakdown? IDOL at Decision Zone!Currently, MEET48/USDT is sitting at a critical decision zone after a parabolic rally from 0.012 → 0.0428. The euphoric surge was followed by a healthy correction and distribution phase, forming lower highs capped by a descending trendline (yellow) while price consolidates within the 0.030 – 0.033 box zone (yellow box).
This area now acts as the ultimate battlefield between buyers and sellers. The next decisive move will determine whether we get a bullish continuation breakout or a bearish breakdown into deeper correction.
---
Visible Patterns
1. Descending Trendline (seller pressure)
Price has repeatedly failed to close above this yellow line → showing sellers are defending strongly.
2. Consolidation Box (accumulation zone)
The 0.030–0.033 zone is the current tug-of-war area. As long as price holds above it, buyers still have a chance.
3. Two Technical Interpretations:
Descending Triangle (bearish bias): if price continues to press against support.
Falling Wedge (bullish bias): if price breaks to the upside, often signaling trend continuation after a pullback.
---
Bullish Scenario
Trigger: 4H candle close above 0.033 with strong volume confirmation.
Targets:
TP1 → 0.0361 (first resistance)
TP2 → 0.0405
TP3 → 0.0428 (local high/ATH)
Narrative: A breakout signals buyers regaining control and resuming the prior rally after consolidation.
---
Bearish Scenario
Trigger: 4H candle close below 0.030 with high selling pressure.
Targets:
First support zone → 0.024 – 0.025
Extended target → 0.0115 (historical low shown on chart)
Narrative: A breakdown confirms sellers dominating the zone, opening room for a deeper correction.
---
Key Takeaway
0.030 – 0.033 = Decision Zone
Breakout above → continuation higher.
Breakdown below → deeper correction.
Watch volume and 4H candle close for confirmation.
---
Notes for Traders
Avoid FOMO, wait for confirmation before entering.
Use scaling strategies (partial entries/exits).
Always manage risk with stop loss outside the box zone.
MEET48 is a low-cap altcoin → expect potential false moves due to low liquidity.
---
#MEET48 #MEET48USDT #CryptoAnalysis #Altcoin #TechnicalAnalysis #Breakout #DescendingTriangle #FallingWedge #SupportResistance

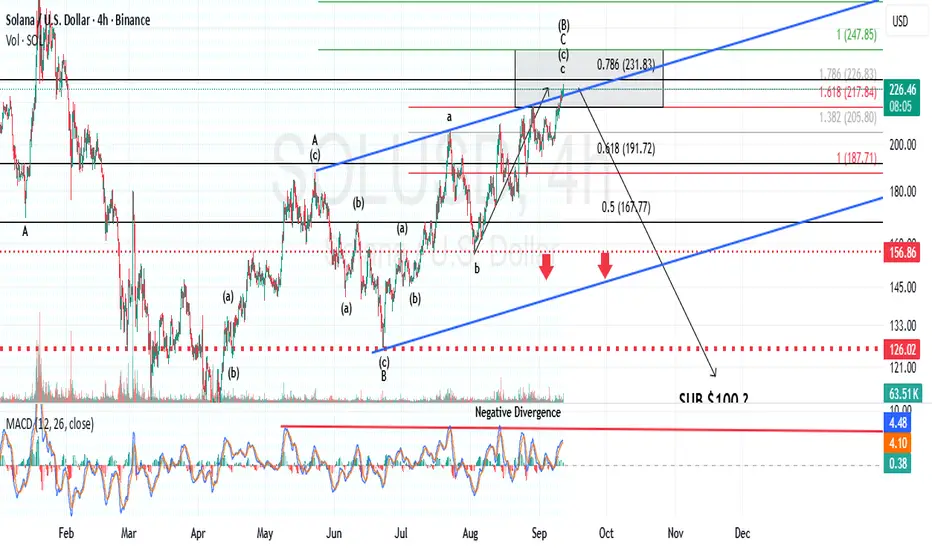
Solana in Target Box: Watching $228–$247 for a TopIn my last update, I raised the question: Is Solana About to Top?
Today’s price action has delivered as expected, with Solana now trading inside my anticipated target box for that potential top. Key resistance levels within the target box remain at $228, $232, and $247.
Over the coming weeks, I’ll be watching closely for signs of reversal. A clearly defined 5-wave micro pattern decline, would be the first indication that a top may be in place. True confirmation comes with follow-through below $155, and ultimately $125. Such a move should open the door to a deeper correction into the $70–$80 bottoming zone.
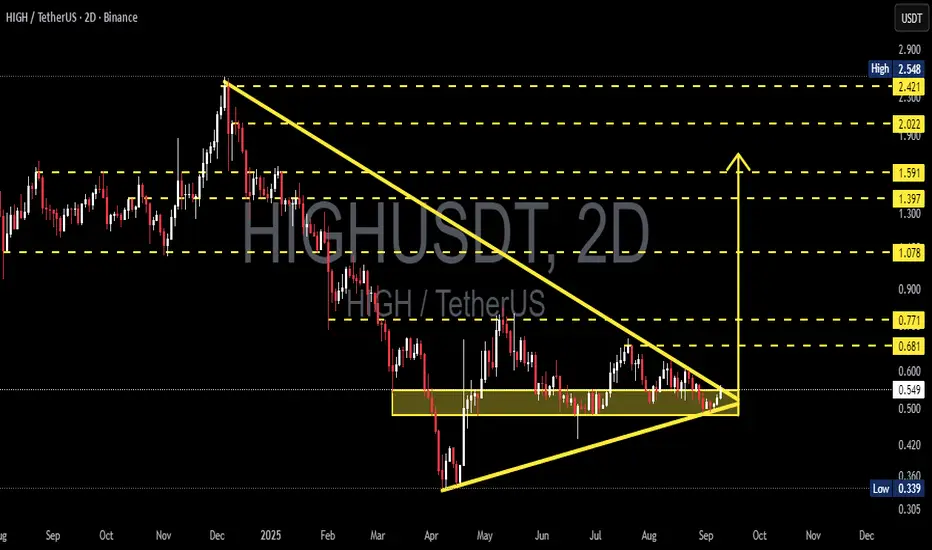
HIGHUSDT — Symmetrical Triangle A Major Breakout Is Approaching?The pair HIGH/USDT is currently at a critical stage after experiencing a prolonged downtrend earlier this year. On the chart, we can clearly see the formation of a Symmetrical Triangle, marked by a descending resistance line from the $2.5 peak and a rising support line that has been holding since April 2025.
This type of pattern usually appears during a consolidation phase, where both buyers and sellers are competing to decide the next medium-term trend.
---
🔑 Key Highlights from the Chart:
1. The accumulation zone (0.45 – 0.55) has been tested multiple times since April and continues to hold — making it a critical demand area.
2. Price action is now squeezing into the apex of the triangle, suggesting that a major breakout is likely to occur soon.
3. Key resistances: 0.681 → 0.771 → 1.078 → 1.397 → 1.591 → 2.022 → 2.421.
4. Key supports: 0.45, with the last major floor at 0.339. A breakdown here would strengthen the bearish case.
---
📈 Bullish Scenario
A breakout above the descending trendline and a confirmed 2D candle close above 0.68–0.77 would open the door for a strong rally.
Short-term targets: 0.77 → 1.08 → 1.40
Mid-term targets: 1.59 → 2.02 → 2.42
Full measured move target: 2.63 – 2.76
Confirmation: Breakout must come with rising volume + successful retest.
---
📉 Bearish Scenario
Failure to hold above 0.45 would invalidate the triangle pattern and likely lead to further downside.
First bearish target: 0.339 (previous low).
If broken, extended bearish measured move could reach around 0.12 (extreme scenario).
Confirmation: 2D close below 0.45 with strong selling volume.
---
🧭 Conclusion
HIGH is at a decisive turning point.
Bulls need a confirmed breakout above 0.68–0.77 to shift momentum and reclaim medium-term strength.
Bears will dominate if 0.45 breaks, pushing price back to 0.339 or lower.
Until confirmation, the setup remains neutral, but the tightening triangle indicates that a large move is imminent.
---
#HIGHUSDT #HIGH #Crypto #TechnicalAnalysis #SymmetricalTriangle #Breakout #Bullish #Bearish #Altcoin #SupportResistance
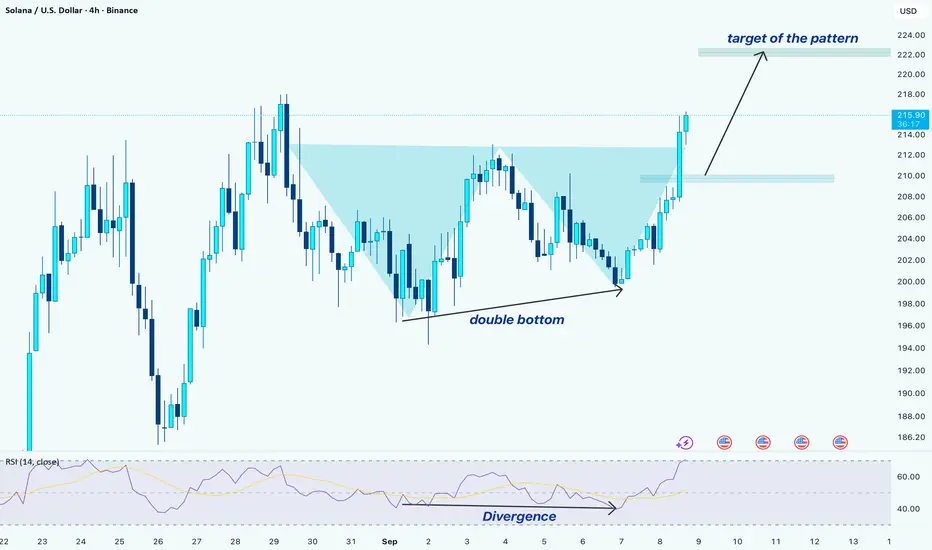
SOL/USDT –> Double Bottom Breakout with Bullish DivergenceHello guys!
Solana has completed a double bottom pattern and broken above the neckline, signaling bullish momentum. Here’s the breakdown:
1-Pattern Formation
A clear double bottom has formed around the $200 zone.
The neckline breakout happened at ~$213–214, confirming the reversal.
2- Momentum Confirmation
Bullish divergence on RSI supported the double bottom.
While price made equal lows, RSI showed higher lows → early sign of trend reversal.
3-Entry Options
Market entry
Pullback entry: Around the $210 area, in case of a retest of the neckline zone.
5- Target
The projected move from the pattern points to $222.
This also aligns with the next resistance area.
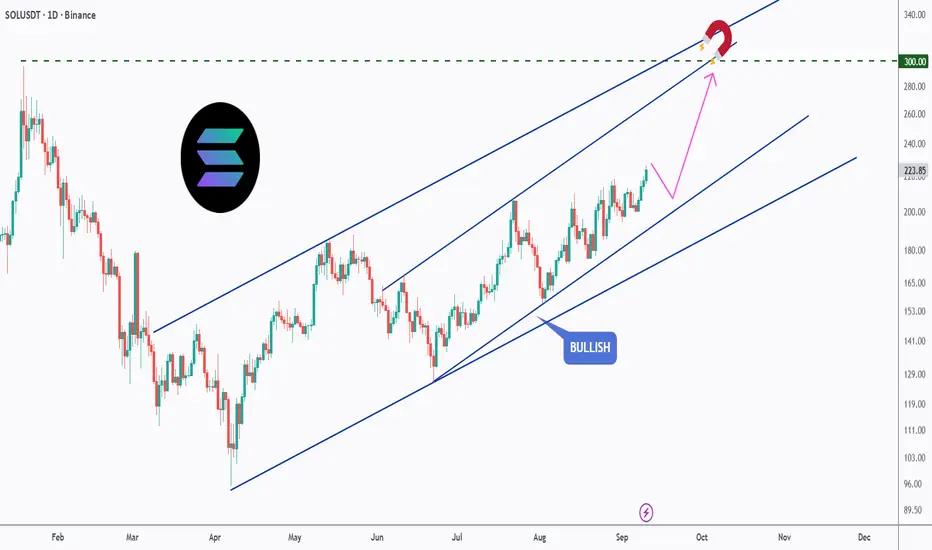
SOL’s Magnetic Path to $300!Solana has been steadily climbing inside a clean bullish channel, and the momentum is showing no signs of slowing down. The price action continues to respect higher highs and higher lows, keeping the bullish structure intact.
🟢 Bullish Channel: SOL is trading neatly within an ascending channel, confirming the trend’s strength.
🎯 Key Target: The $300 level acts as a magnet — a psychological resistance aligning with the channel’s upper boundary.
🔄 Healthy Pullbacks: Any short-term dips within the channel are being absorbed quickly, signaling strong buyer interest.
🚀 Upside Outlook: As long as SOL holds within the channel, the path of least resistance remains to the upside, with $300 as the next major milestone.
📌 Eyes remain on whether Solana can reach the $300 mark before the year’s end.
This is for educational purposes only, not financial advice. Always manage risk properly before trading.
📚 Stick to your trading plan regarding entries, risk management, and trade execution.
Good luck!
All Strategies Are Good; If Managed Properly!
~Richard Nasr
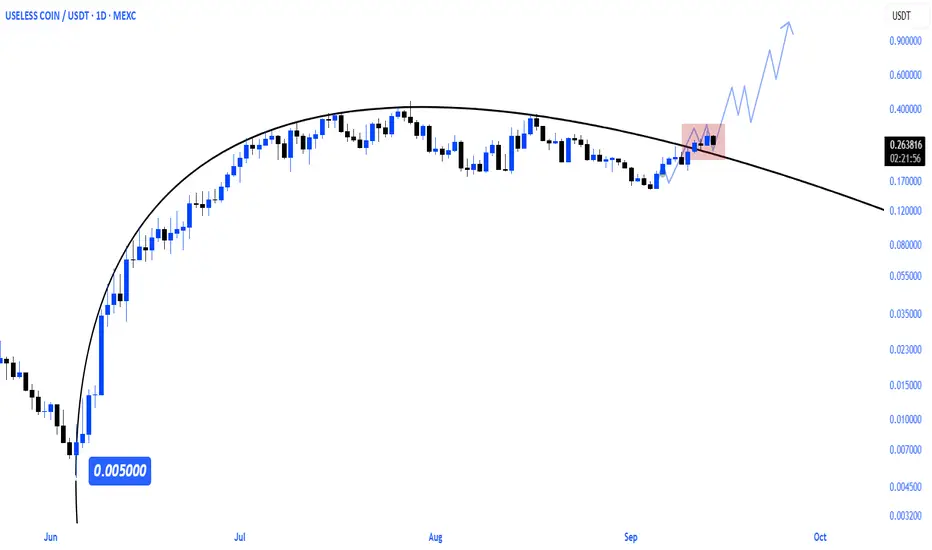
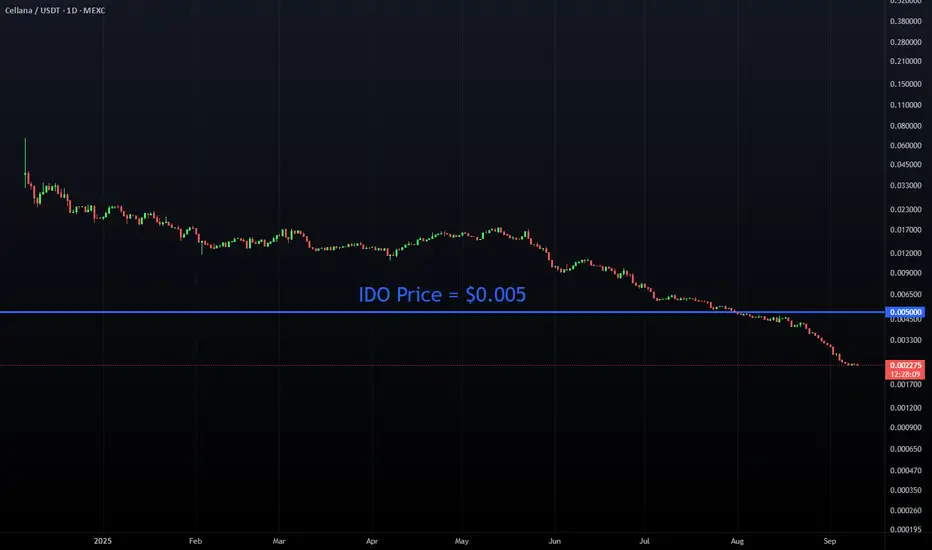
CELL token of Cellana Finance (main DEX on Aptos) is OVERSOLDCELL ("CELL" on Cellana Finance or "CELLA" on MEXC) is a token of the main DEX platform on Aptos blockchain - Cellana Finance.
IDO Price (public sale) = $0.005 per CELL;
ATH = $0.1164 per CELL.
Since the CELL token is always trending on the Aptos blockchain, there is a very high probability that its current price is extremely undervalued, even compared to its IDO price of $0.005 per CELL.
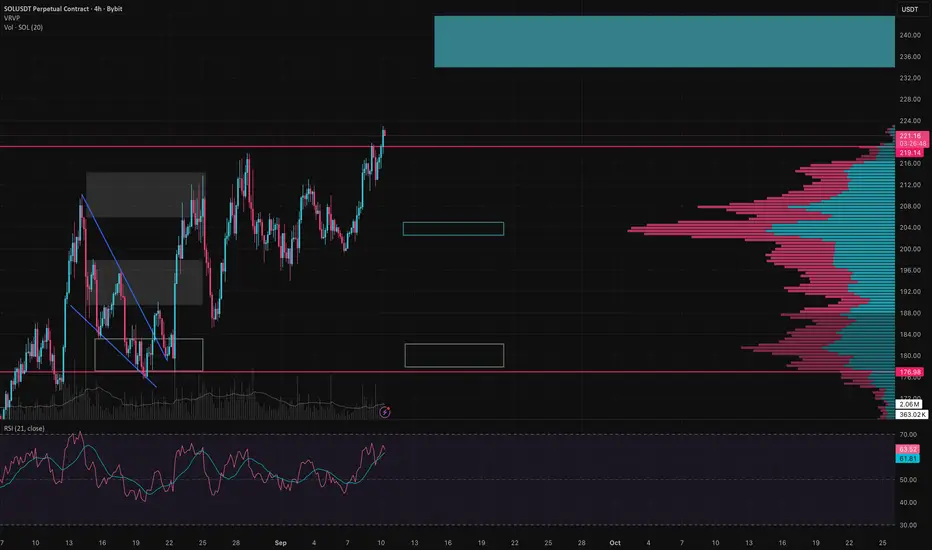
SOL Weekly Update – Bulls Losing Steam?SOL is testing a strong resistance zone right now. The problem I see is that RSI is already running hot and the volume keeps dropping. Price is pushing up, but buyers aren’t showing real conviction. That’s why I’m leaning toward a correction into the 202–204 range. This level looks like a good spot to start looking for long entries if the reaction is strong enough.
🔹 Bullish scenario: if we get a confirmed daily close above 222 with higher volume, the next target zone sits at 234–242. From there, bulls will need to prove they still have momentum, otherwise we could see another local correction.
🔹 Bearish scenario: a break and close below 201 opens the way for a move into 178–182, which is the POC zone with the heaviest traded volume. That level should act as major support if the correction deepens.
RSI is showing that the market is overheated, but it doesn’t mean the rally is over. If buyers suddenly show strength and step in with volume, we could still get another impulsive leg higher before any pullback.
My view: while price is grinding higher on weak volume, the risk of a drawdown into 202–204 is much higher than a clean breakout. That’s the zone I’ll be watching closely for long setups.
Disclaimer: The author’s opinion may not align with yours
Solana Price Hits 7-Month High But Caution Awaits SOL HoldersAt the time of writing, Solana trades at $219, holding firm above its $214 support floor. This represents a seven-month high, with the token facing resistance at $221. Sustaining this level will be crucial in shaping short-term direction.
Should momentum fade, Solana’s price could retrace to $206 or even lower, testing $195 as support. Such a correction would align with the RSI and address data signals pointing to short-term cooling.
Conversely, if existing SOL holders increase demand, the altcoin could defy bearish signals. A breakout above $221 would strengthen the bullish case, potentially driving Solana toward $232 and invalidating expectations of an imminent decline.

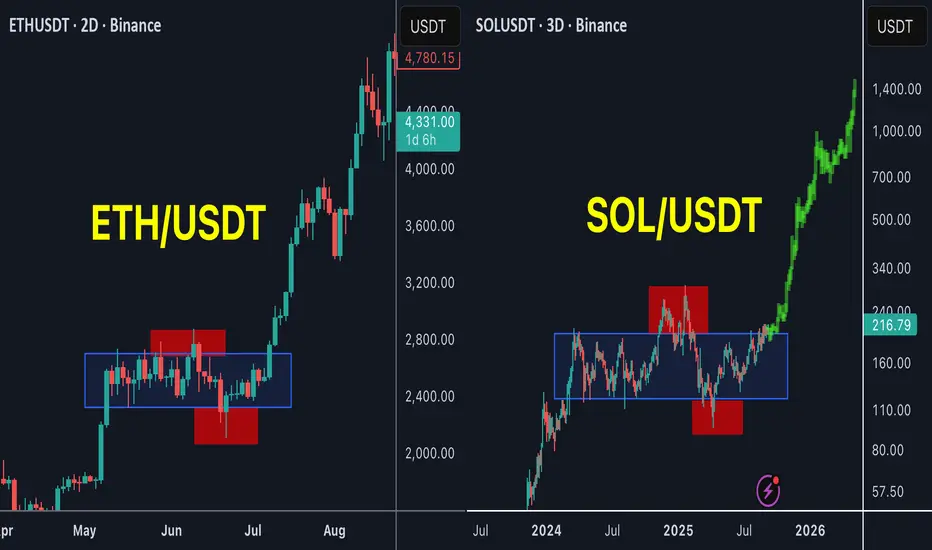
SOL is the next ETH !SOL / USDT
SOL is forming the same pattern as ETH before the huge breakout in past few weeks
Accumulation with 2 major stoploss hunt for bulls and bears and now is trying to breakout the accumulation zone
History show high success rate of this pattern
Will SOL be the next ETH ?
Best of wishes
Record Breaking Solana Highs & The Rise of Dark DexsDark DEXs routed through aggregators are eating Solana spot flow- leaving BINANCE:SOLUSDT & BINANCE:JUPUSDT as the cleanest upside while order-book DEXs fight for share.
TVL on Solana just hit all-time highs, with the biggest lift coming via Jupiter (JUP) routing.
Over the last 30 days, the largest spot volume was on a private “dark DEX” (Humidifi) - not Meteora, BINANCE:RAYUSDT , or BYBIT:PUMPUSDT .
These private venues plug into Jupiter’s aggregator, filling at better prices; efficiency accrues to the dark DEXs + the aggregator + the chain.
Net result: Raydium/Orca can rise with the tide short-term, but market share pressure is real if dark routing keeps compounding.
Trade view: The most direct upside is SOL + JUP. SOL’s pivotal level ≈ $175 - sustained breakout targets $250, then thin resistance up to ~$300.
Watching JUP share of routed volume, SOL TVL/fees, and spot depth for confirmation.
Not financial advice. Do your own research.

MOVEUSDT — Descending Triangle Critical: Breakout or Breakdown?📊 Chart Analysis
The MOVE/USDT daily chart is currently forming a clear Descending Triangle pattern. This structure is defined by:
A downward sloping resistance trendline (yellow) that has been pressing the price lower since the beginning of the year.
A horizontal support zone (yellow box) around 0.105 – 0.125 USDT, acting as the last stronghold for buyers.
This pattern signals that the market is in a compression phase. Price has repeatedly failed to break above the descending trendline, while support has also been tested multiple times but still holds. This indicates we are entering a make-or-break moment for MOVE.
---
🔼 Bullish Scenario
If price manages to break above the descending trendline with a strong daily close and rising volume, this could be a potential reversal signal.
First confirmation level: Breakout above 0.1514.
Upside targets:
TP1: 0.1514 (+20%)
TP2: 0.1841 (+46%)
TP3: 0.2465 (+96%)
With sustained momentum, a mid-term target could extend to 0.4018 or higher.
The bullish case would be further supported by signs of bullish divergence on RSI or MACD.
---
🔽 Bearish Scenario
On the other hand, if price fails to hold the 0.105 – 0.125 support zone and closes daily below this area with increased volume, strong selling pressure could drive further downside.
Bearish targets:
0.087 (−31%)
0.075 (−40%)
0.050 (−60%)
A confirmed breakdown from a descending triangle within a downtrend often signals a strong continuation to the downside.
---
📌 Pattern & Implications
Descending Triangle is typically a bearish continuation pattern, though false breakouts to the upside are not uncommon in crypto markets.
The current support zone is the critical decision level that will determine the next major move.
Traders should wait for a confirmed breakout or breakdown before committing, in order to avoid bull traps or bear traps.
---
⚖️ Conclusion
MOVE/USDT is standing at a critical decision point.
Bullish bias if daily close above the trendline and 0.1514 with strong volume → upside potential to 0.1841 / 0.2465.
Bearish bias if daily close below 0.105 → downside targets at 0.087 / 0.075.
This is a make-or-break moment, and confirmation from price action and volume will be crucial before entering a position.
---
#MOVE #MOVEUSDT #Crypto #TechnicalAnalysis #DescendingTriangle #SupportResistance #Breakout #BearishScenario #BullishScenario #DYOR
