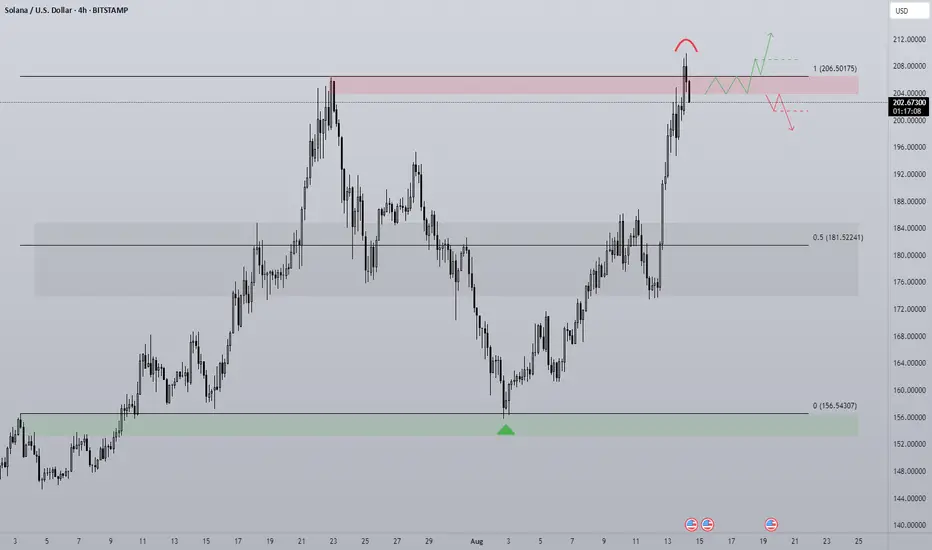
SOLANA's Situation (4h) !!!It appears that the price is forming a cup and handle pattern, and if this occurs, it could push the price above $210.
Best regards CobraVanguard.💚
Solana

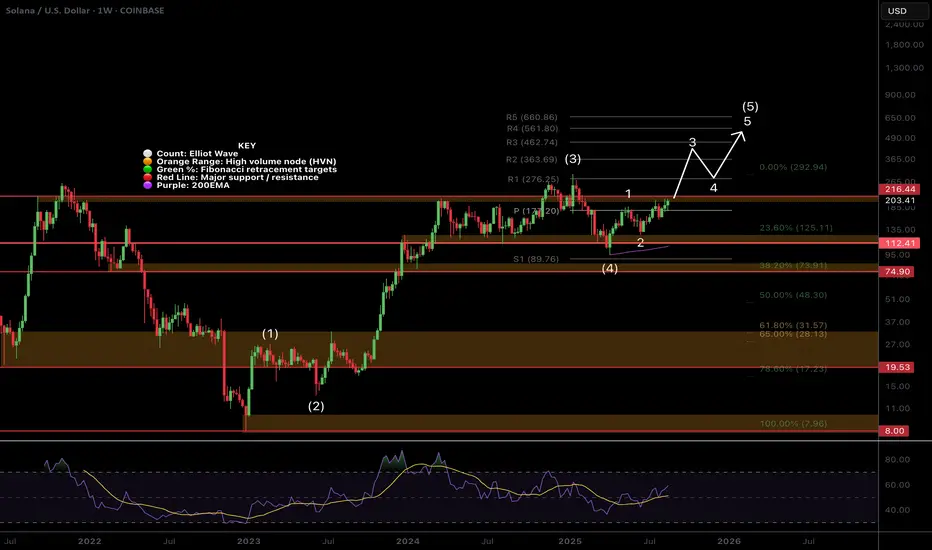
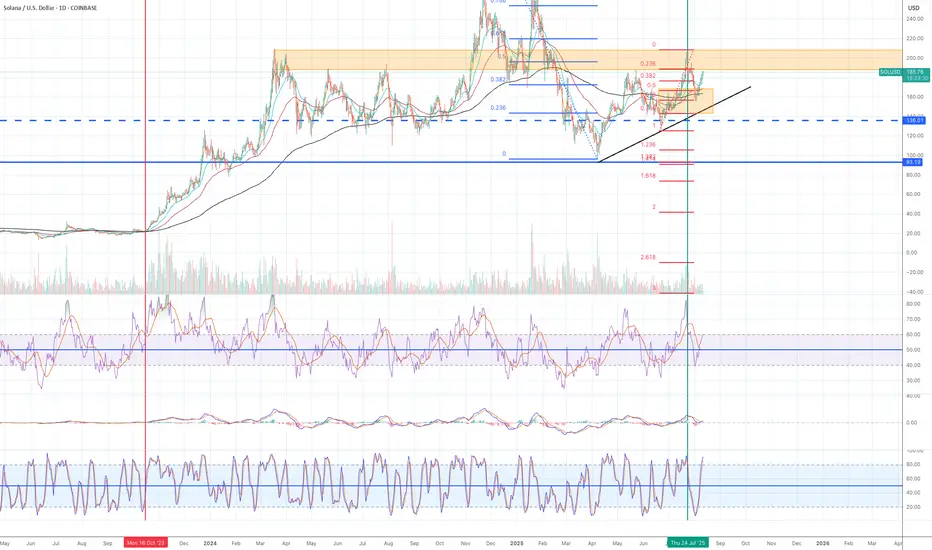
$SOL Ready for Price Discovery?CRYPTOCAP:SOL wave 3 of (5) appears to be underway but has to get through the major resistance High Volume Node at $216 and previous high first for an impulsive move.
Weekly pivot point was tested successfully as support and RSI has plenty of room to continue upwards.
Analysis is invalidated below $130.
Safe trading
SOLANA Potential Bullish Continuation OpportunitySolana seems to exhibit signs of potential Bullish Momentum on the shorter timeframes as the price action may form a credible Higher Low with multiple confluences through key Fibonacci and Support levels which presents us with a potential long opportunity.
Trade Plan:
Entry : CMP
Stop Loss : 172
TP 0.9 - 1 : 207 - 209

Solana at the Gates of Breakout- 250-300 in sight1. What happened lately
After the sharp drop that started on July 23 and bottomed at 155 in early August, Solana has shown strong recovery.
The rebound pushed price back to the 207 resistance zone, followed by a pullback to 175, confirming it as a solid demand area. Yesterday, in line with the entire crypto market, SOLUSDT rallied strongly, and today, after a quick dip below 200, buyers stepped back in, pushing price once again toward resistance.
2. The key question
Is Solana ready to finally break above resistance and continue higher into a new bullish leg?
3. Why I expect continuation to the upside
• Positive fundamental backdrop across the crypto sector.
• Constructive technical structure with consecutive higher lows since April.
• 175 confirmed as a strong support zone, with buyers stepping in twice this month.
• 207 resistance under pressure again, showing growing bullish momentum.
4. Trading plan
As long as the daily close holds above 190, Solana remains firmly bullish.
A clear breakout above 207 could open the path toward 250, and in a more extended scenario, even 300 in the medium term.

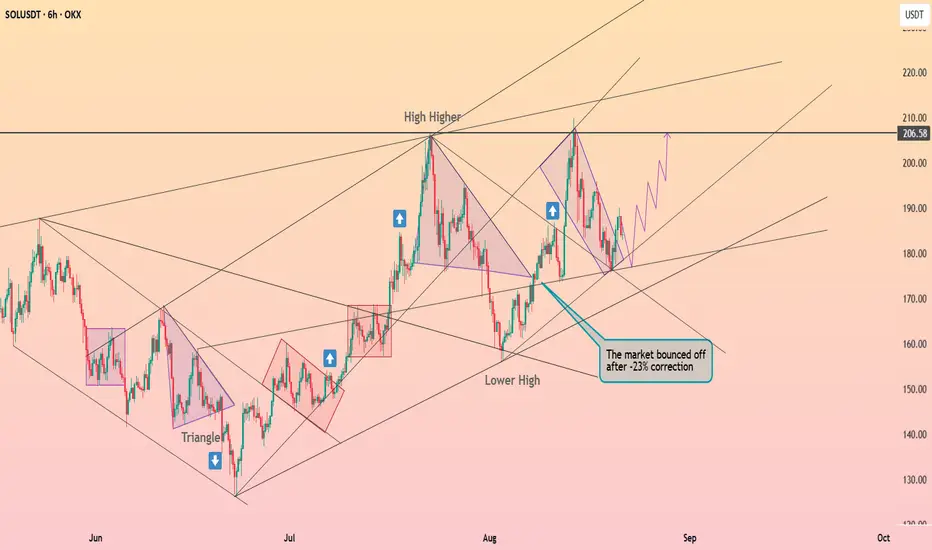
Solana exited the descending wedge ┆ HolderStatOKX:SOLUSDT has recovered quickly from a -23% correction, holding structure with higher highs and resilient rebounds. The market is now preparing for a retest of $206.58 resistance, and a breakout could fuel another push higher toward $220+.
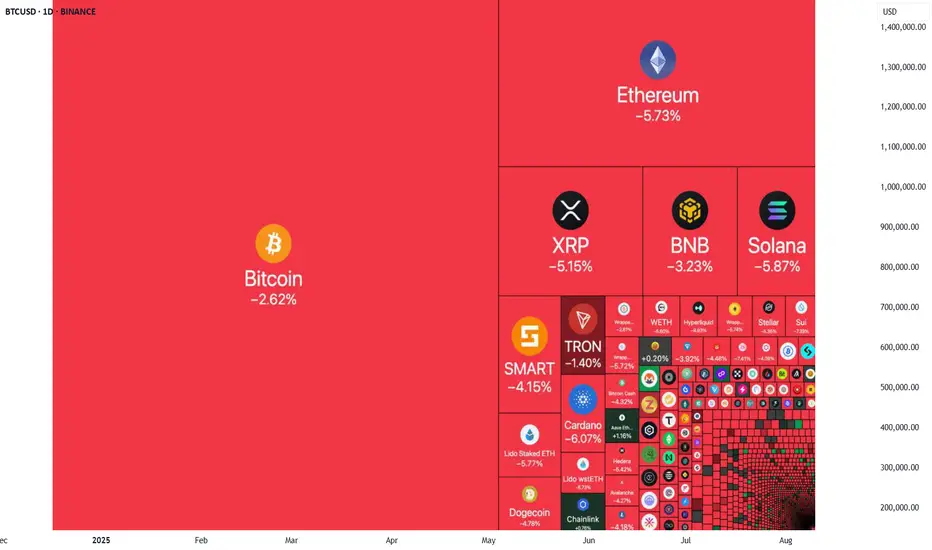
BTC is losing dominance, Alt season!With the passing of the Genius Act , ETH , ADA , and many other American altcoins gained strong momentum. BTC dominance is bearish, and with the Clarity Act in the process of being passed, I expect lower dominance for BTC in 2025 and 2026. As you can see in the weekly chart, BTC dominance lost its momentum within a key rising parallel channel and dropped into a lower channel. Alt season is coming!

Solana Prediction for 8/22I believe what we're seeing (order flow) is a bullish range order flow.
I don't see abnormal or excited sellers with huge size coming in constantly to bring price to any huge bearish targets.
Which leads me to believe, we're in a giant range.
Also today we had lots of buying activity that did strike me as excited. Big buyers, if they can get loose this target should be easy.

Solana shows weak growth of +0.12%,Short-term support and resistance levels
Main resistance: $200 — SOL has already bounced off this mark, confirming its importance.
Support: $172 — a key zone where a reversal occurred earlier in early August.
Analytical review and scenarios for today
Financial sources indicate that SOL has turned bearish from $200, forming a "Bearish Engulfing" pattern. A pullback to $172 is possible.
Other forecasts believe that SOL is testing resistance at $188-190, and if broken, it may aim for $210-225.
Futures volume and open interest have grown significantly, indicating accumulating institutional interest and support for bullish dynamics.
Overview of other scenarios: technically, SOL is still neutral — mixed signals, but positive on-chain dynamics (for example, TVL) remain.

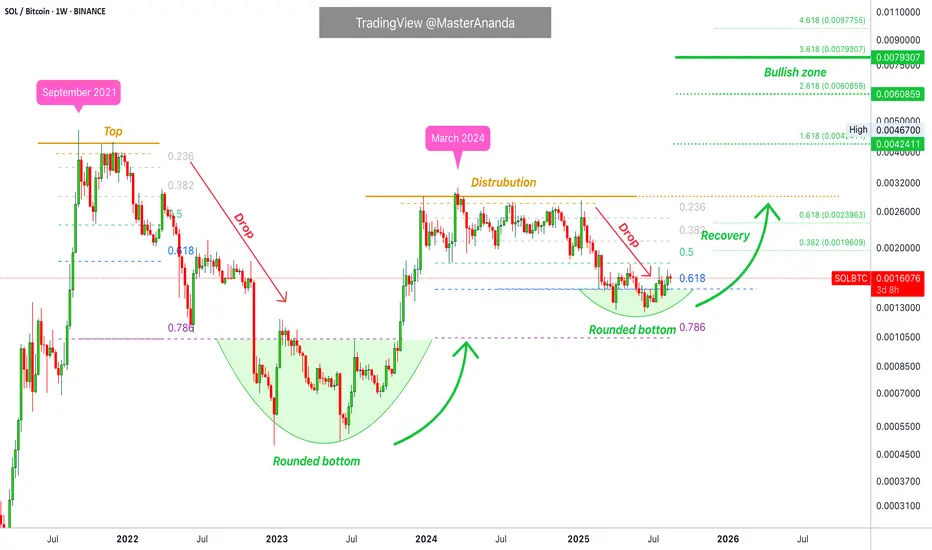
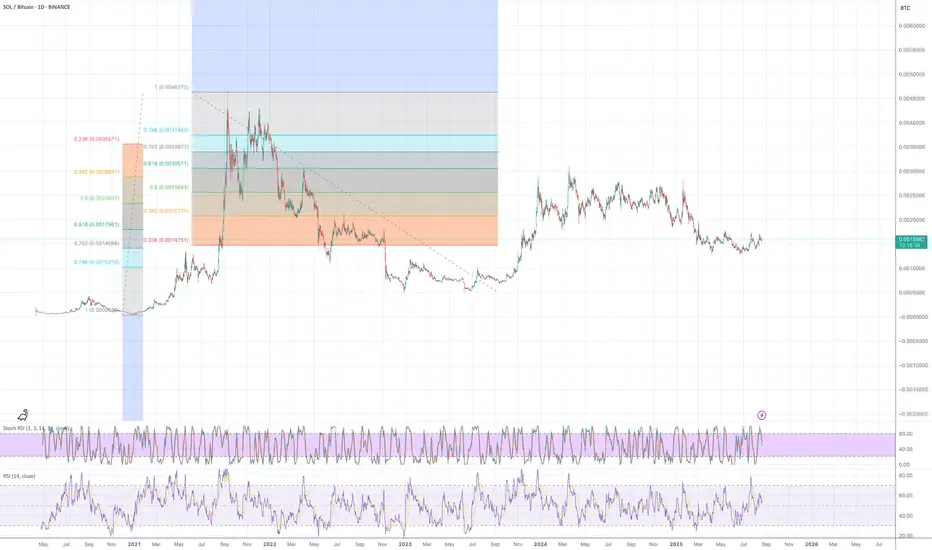
Will Solana Recover? SOLBTC Reveals the AnswerThe truth is that we can find the answer by looking at SOLBTC (Solana vs Bitcoin). If we have a bearish SOLBTC then we know the market is about to tank and about to do so wildly. But, with a bullish SOLBTC we know Solana to be bullish and related altcoins as well. Let's dive into this chart and see what it has to say.
SOLBTC peaked March 2024. A peak is always followed by a correction and this time it took a while before support broke. SOLBTC went into distribution and crashed earlier to reach long-term support. The support zone established appeared just below 0.618 and right above 0.786 Fib. retracement. SOLBTC activated the lowest prices since November 2023.
This last part represents the rounded bottom on the chart between April and August 2025. Notice how SOLBTC is trading back above 0.618 Fib. retracement. This makes this a very strong bullish setup.
Back in September 2021, SOLBTC peaked and produced a drop. The drop or bear market resulted in a huge rounded bottom and from this bottom a recovery, the recovery leads to a bullish cycle and wave. Currently we are in this bullish cycle.
The recent drop is a long-term higher low. We are now entering a new recovery phase and this will lead to massive growth. Seeing SOLBTC being extremely bullish long-term, we know SOLUSDT (Solana vs Tether) is also set to grow. There you have your proof.
By the way, SOLBTC is now good for a LONG trade. I will give this chart a closer look.
Namaste.
Long!!!!!I bought more Solana, opened a leveraged long position and also opened an option trading over the weekend.
I think Solana is about to end the 18th month's consolidation and is getting ready to move to the upside.
Reasons for my directional bias:
1) RSI lines crossed at 50 area and are moving to the upside.
2) MACD stayed in the bull zone and lines have crossed to the upside.
3) EMA 55 crossed above EMA200 on 24th July. As I said in the previous articles, when they cross, the price often pulls back significantly and retests some key areas. The price dropped to Fib 0.618, found support and it is now moving to the upside. (green vertical line in the chart)
4) EMA21>EMA55>EMA200 - all EMAs are pointing to the upside (not horizontal)
5) $185 -$200 has been working as a strong liquidity zone. It has been difficult to break above and stay above, but I think it has enough momentum to start the next leg up.
6) In the monthly chart, RSI lines and MACD lines are above to cross to the upside. The last time that happened was Oct 2023. The price consequently moved from $20 ro $210 (Fib 0.786) in a matter of 6 months. And it was when EMA55 crossed above EMA200 in the daily chart and price pulled back and retested Fib 0.618. (Red vertical line)
RAREUSDT — at Critical Accumulation Zone: Breakout or Breakdown?📊 Market Analysis
On the 4D timeframe, RARE/USDT is trading at a crucial pivot zone. The chart structure highlights:
1. Descending Triangle
Clear formation with lower highs pressing price down.
Strong horizontal support between $0.0415 – $0.065 (yellow box).
This pattern often signals bearish continuation, but if accumulation dominates, a bullish reversal can emerge.
2. Major Support Zone
Price has rejected breakdown multiple times in the $0.0415 – $0.050 region, showing active buyers.
This zone acts as the final defense before deeper downside risk.
3. Layered Resistances to the Upside
Key resistance levels if breakout occurs:
$0.0747 → $0.0949 → $0.1349 → $0.1715 → $0.2018 → $0.2208 → $0.2609 → $0.3476 (local high).
---
🚀 Bullish Scenario
For a bullish case, we need:
A confirmed breakout above the descending trendline (yellow).
Strong 4D candle close with volume.
Upside Targets if breakout holds:
🎯 TP1: $0.0747
🎯 TP2: $0.0949
🎯 TP3: $0.1349
🎯 Extended targets: $0.1715 – $0.20
📌 Note: Breakouts from descending triangles often trigger short squeezes → sharp upside moves possible.
---
🐻 Bearish Scenario
If sellers take control and support breaks:
A confirmed breakdown occurs if price closes 4D below $0.0415 with volume.
Downside targets:
🎯 Initial: $0.029 (psychological & historical support).
Lower levels possible if broader crypto sentiment turns bearish.
📌 Note: Descending triangle breakdowns tend to accelerate selling momentum.
---
📌 Pattern & Sentiment
The descending triangle shows sustained selling pressure, but repeated support tests suggest accumulation.
Overall crypto market sentiment (BTC & ETH) will heavily influence the outcome.
In short: RARE is waiting for a major trigger — either breakout or breakdown.
---
🧭 Trading Plan Recap
Bullish if breakout above trendline + close above $0.065–$0.0747 → targets $0.09 / $0.13.
Bearish if close below $0.0415 → target $0.029.
4D timeframe = stronger signals & less noise → better for swing setups.
---
> RARE/USDT 4D — Descending Triangle at Critical Support
RARE is consolidating inside a descending triangle, holding a key support zone at $0.0415 – $0.065.
• Bullish Case → breakout above trendline + volume → targets $0.0747 / $0.0949 / $0.1349 / $0.1715.
• Bearish Case → breakdown below $0.0415 → main target $0.029.
Market structure suggests both accumulation potential and breakdown risk. Wait for confirmation before entering a position.
#RARE #RAREUSDT #Crypto #TechnicalAnalysis #Altcoins #Breakout #SupportResistance #DescendingTriangle

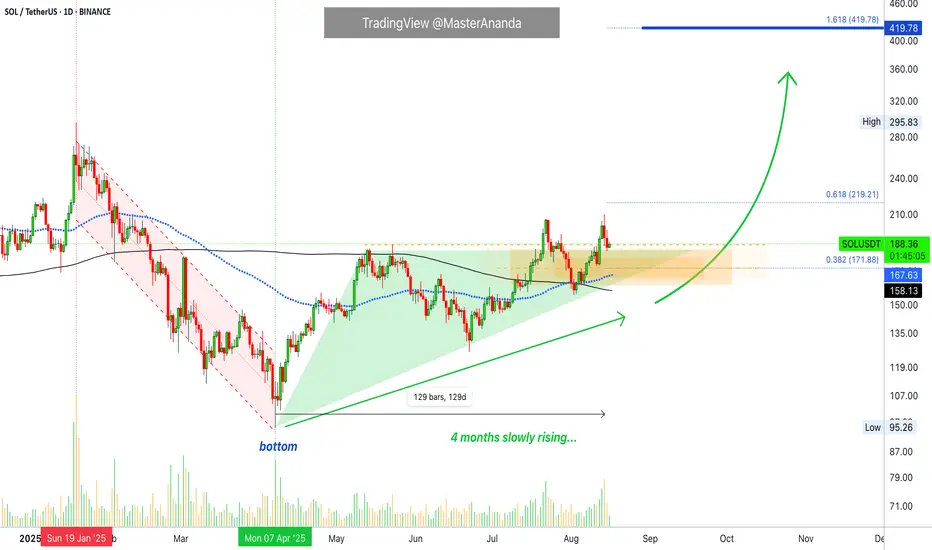
Solana Bullish · Long-Term Growth ConfirmedAfter the market bottom in April Solana has been rising slowly for four months.
Look at this chart here. I am keeping it very simple because I believe simple is best. Where is Solana at now? What happens next?
Solana is trading safely above EMA89 and MA200, notice the dynamics on the chart. These levels were first conquered as resistance back in July and by the 2nd of August these levels were being tested as support, they both held.
SOLUSDT is trading safely above these levels and also a price of $172 which is the 0.382 Fib. extension of the current wave. This is an important zone and the action is happening safely above it.
Solana has room to move around, wiggle around. This is what happens as prices grow. There can be stops and retraces but this does not mean that the rise is over, there is always more.
Solana just conquered the EMA89/MA200 duo-resistance recently, we have not yet seen what is possible now that the trading is happening on the bullish zone. We are due a major advance... The market is consolidating, building up strength to be able to grow long-term.
Namaste.
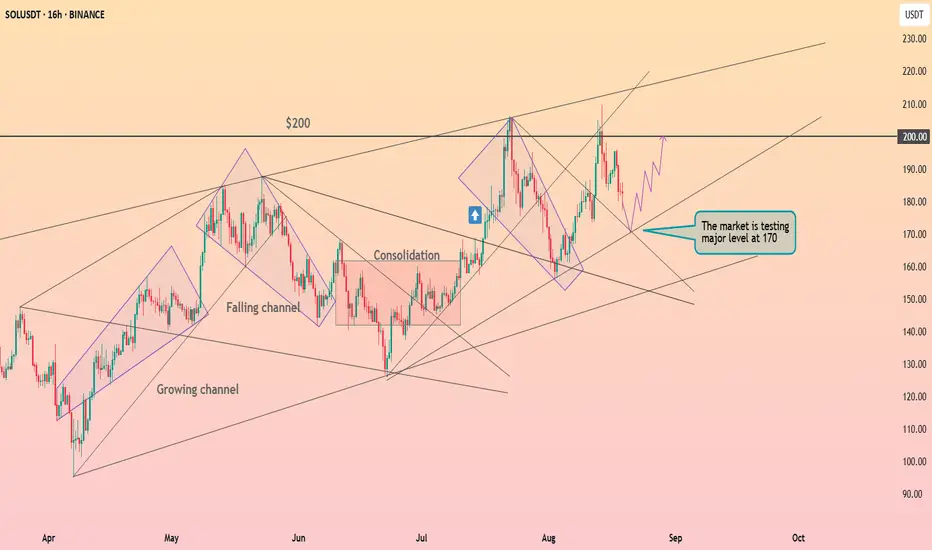
Solana above the strong support ┆ HolderStatBINANCE:SOLUSDT is currently testing $170, just beneath major resistance at $200. Breakout confirmation could open path to new highs, while rejection risks pullback to $150 support. Consolidations suggest momentum is building for another significant move.
SOL - BTC Is it a buy? Checking the SOLBTC chart I notice that it might be time to buy into SOL.
Why? We have reached the golden pocket 0.702 level in retracement and now SOL could gear up for a massive pump.
Are you buying? Or Waiting?
Do you want to risk your BTC for it?
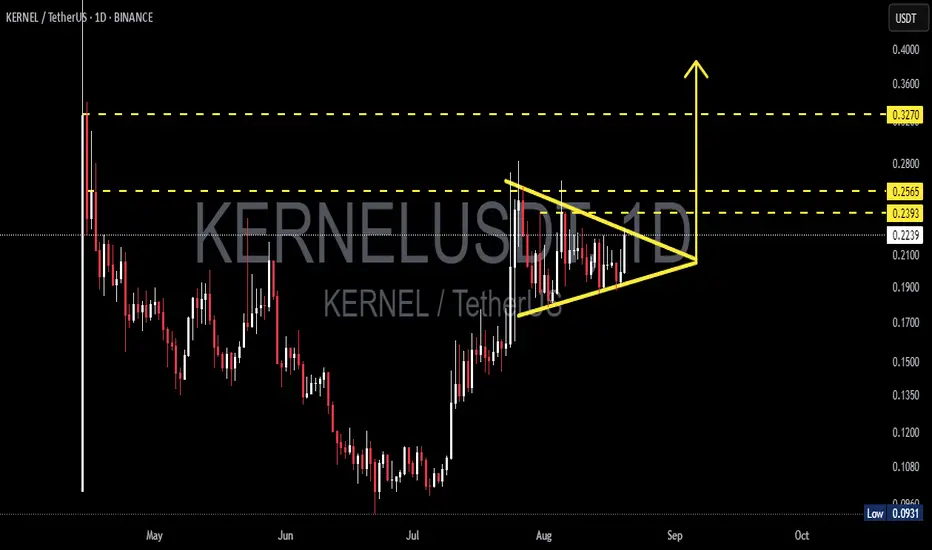
KERNEL/USDT – Symmetrical Triangle Nearing a Major Breakout?📝 Overview
KERNEL price is currently trading around $0.2228, consolidating inside a symmetrical triangle on the daily timeframe. This pattern indicates a period of equilibrium between buyers and sellers, where volatility contracts before a decisive move. While symmetrical triangles often act as continuation patterns, they can also trigger reversals if confirmed by strong volume.
📐 Pattern & Chart Structure
After dropping to a low of $0.0931, KERNEL staged a strong rebound.
Since July–August, the price has been compressing into a series of higher lows and lower highs, forming a classic symmetrical triangle.
Key levels to watch:
🔹 Minor resistance: $0.2393
🔹 Key resistance: $0.2565
🔹 Major resistance: $0.3270
🔹 Dynamic support: $0.210 – $0.218 (triangle bottom)
🔹 Further supports: $0.190 – $0.170
---
🚀 Bullish Scenario (Upside Breakout Potential)
1. A break and daily close above $0.234–$0.236 would be the first confirmation of bullish continuation.
2. With strong volume, upside targets are:
🎯 TP1: $0.2393
🎯 TP2: $0.2565
🎯 TP3: $0.290 – $0.300 (triangle measured move, approx. $0.06)
🎯 Extended target: $0.3270 (major resistance zone)
3. Ideal confirmation: successful retest of the breakout zone ($0.230–$0.235).
4. Bullish invalidation: price closes back inside the triangle after a breakout.
---
🐻 Bearish Scenario (Downside Breakdown Risk)
1. A daily close below $0.216–$0.218 would signal bearish momentum.
2. Downside targets if breakdown occurs:
⚠️ Support 1: $0.210
⚠️ Support 2: $0.190
⚠️ Support 3: $0.170
⚠️ Extreme case: retest of $0.0931 low
3. Bearish invalidation: quick rebound back above $0.224–$0.226 after breakdown.
---
📌 Key Notes
The triangle is getting tighter, meaning a major breakout is imminent.
Direction depends heavily on volume confirmation.
Traders should wait for a daily close outside the triangle before entering.
Always apply risk management since false breakouts are common in this pattern.
---
✨ Conclusion
KERNEL/USDT is at a critical point inside a symmetrical triangle. A breakout above $0.236 could open the path to $0.2565 and potentially $0.3270. On the other hand, a breakdown below $0.217 may trigger further downside toward $0.190–$0.170.
👉 The market is at a decision point — watch closely for the next big move.
#KERNELUSDT #KERNEL #CryptoAnalysis #SymmetricalTriangle #Breakout #PriceAction #Altcoins #TechnicalAnalysis #DailyChart #SupportResistance #CryptoTA #DYOR
SOLUSDT 4H✅ SOL/USDT — 4H (Binance) | Aug 20, 2025 — Professional Technical Read
🔎 Chart context
• Structure is broadly bullish since early Aug, but the last leg printed a lower high → pullback into a 4H demand/FVG block.
• Price now ~180.7 inside that block. Two paths are drawn on your chart: a reaccumulation → breakout to 210 or a loss of demand → sweep 158.
📍 Key levels (approx.)
• Supply / liquidity above: 200–210 (major liquidity line marked 210.00).
• Decision block (current): ~175–183 (4H demand/FVG; prior breakout origin).
• Pivot / CH reference: ~194–196 (CH 4H label — reclaim turns momentum cleanly bullish again).
• Support below: ~158 (tagged on chart), then 150–145 (deeper old base).
🧭 Market structure & liquidity map
• After the CH 4H and rally to the recent peak, price created a higher low around ~165–168, then a spike to ~205, and is now mitigating the 175–183 block.
• Wicks show responsive buyers at the upper edge of the block, but the midline is soft; a clean close below ~175 likely exposes the resting liquidity at 158.
• Above, buy‑side liquidity sits over 200 with a cluster around 209–210 (equal‑highs feel).
📈 Bullish continuation (probable if 175–183 holds)
Conditions:
• Hold 175–183 with a 4H HL and impulsive reclaim of ~188–190, then CH area ~195.
Path & targets:
1. Trigger reclaim: 188–190 → momentum confirmation above 195 (CH 4H).
2. TP1: 198–200 (partial).
3. TP2: 205–206 (prior swing).
4. TP3: 209–210 (liquidity sweep).
Invalidation: a 4H close below 175.
📉 Bearish continuation (activated on loss of demand)
Conditions:
• 4H close below 175 or failed bounce capped under 188–190.
Path & targets:
1. Pullback/failed retest into 182–186 (sell zone).
2. TP1: 168–166 (intermediate shelf).
3. TP2 (main): 158 sweep (your downside tag).
4. Extension (if momentum persists): 150–145 mitigation.
Invalidation: sustained reclaim >195.
🎯 Trade plans (system‑agnostic

Solana tests supportAfter a solid recovery from the daily 200MA, Solana has retraced from its local high around $210.
Currently trading around $180, previous resistance and potential support, if the bulls can reclaim $184, we may see a recovery towards $206.
Potential resistance can be expected around $190 first.
Continued short-term weakness from current levels could see price test $170 - $175 as support.
Considering that a new high was created and price is trading above the daily 200MA, the market could be signaling strength and potential for further bullish momentum.
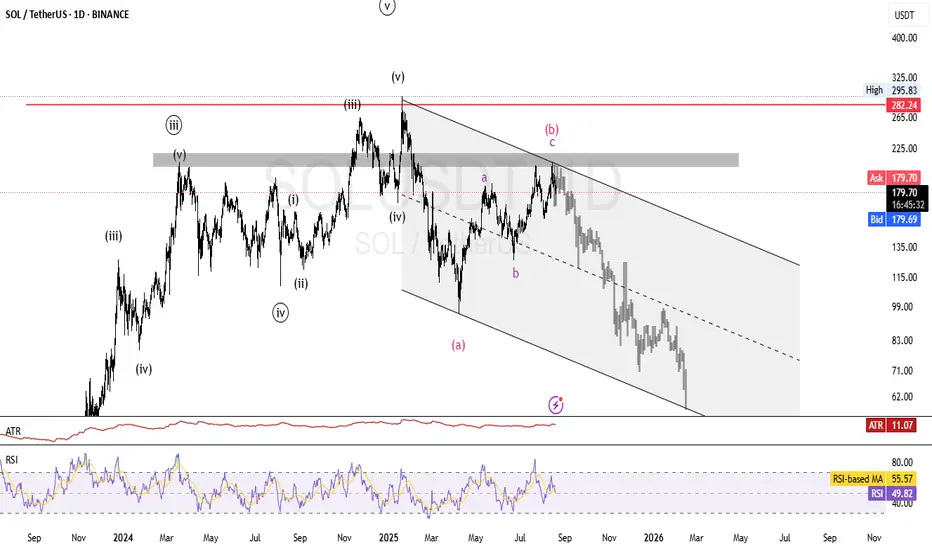
SOLUSDT: Elliot waves Analysis Hello. As you can see in the Solana chart, the analysis is based on Elliott waves in the long term. This is only a perspective and cannot be the basis for trading, but it seems that after reaching the deadline area, we can expect a continuation of the correction for wave C. So keep this perspective in mind, as it is possible.
Solana: $178 Holds - Next Step To $200+📈 Solana (SOL/USD) – Technical Review — August 2025
- Support at $178 (20-day EMA) is keeping the price from falling. A rebound from this zone provided growth to $190-195. The current price is around $193.
- Technical “Buy” signals: Bitget is a pure BUY on the daily chart (13 Buy vs 4 Sell), TipRanks — Strong Buy, TradingView — Buy (weekly and monthly timeframes).
- Market volumes and dynamics: Growing trading volumes and maintaining upward dynamics confirm the upward momentum.
- Next growth targets: the nearest resistance is $200-205. A breakout of this range will open the way to an extension of the movement to the $220-250 area.
Conclusion: SOL is showing a solid bullish trend. Key area to watch is $178-$180: holding above confirms upside potential to $200+. Breakout of $200 will open the way to new highs.
Recommendation:
- Buy on dip: rebound from $178
- Buy breakout: on volume breakout of $200
- Stop-loss: can be placed below $178
- Targets: $200 → $220 → $250

Solana Buy SetupAs we're in the daily OB zone, I think this area has a good potential to set a buy order.
I take the SL a little tight but you can set in even below the low.
Please consider the risk management.
Dear traders, please support my ideas with your likes and comments to motivate me to publish more signals and analysis for you.
Best Regards
Navid Nazarian

Why Is Crypto Tumbling? A Trader's Guide to the Recent Sell-OffWhy Is Crypto Tumbling? A Trader's Guide to the Recent Sell-Off 📉
🚨 If you're watching the markets today, you've seen the sea of red. Bitcoin, Ethereum, and major altcoins have experienced a significant pullback, leaving many to wonder about the cause.
While sharp drops can be unsettling, for the strategic trader, they are critical moments to analyze, not to panic. The current downturn isn't random; it's driven by a convergence of clear geopolitical, technical, and macroeconomic factors.
Here’s a breakdown of what’s happening behind the charts:
1. Geopolitical Uncertainty 🌐
High-stakes diplomatic meetings are underway involving the US, EU, and Ukrainian leaders to discuss the Russia-Ukraine peace deal. Markets inherently dislike uncertainty. As traders await a clear outcome, many are de-risking their portfolios, leading to selling pressure on assets like cryptocurrencies.
2. A Healthy Market Reset 📊
The crypto market just came off a powerful rally where many assets saw gains of 50-100%. This rapid rise led to a buildup of high-leverage positions. Today's dip is forcing a "leverage flush," liquidating over-extended traders. While painful for some, this is a standard market mechanism that washes out speculative excess and often creates a more stable foundation for future growth.
3. Shifting Macroeconomic Tides 📉
Just a week ago, a September interest rate cut was seen as a certainty. Now, recent economic data has slightly lowered those odds. Financial markets, including crypto, are incredibly sensitive to central bank policy. The market is now pricing in this small but significant shift in expectations, contributing to the downward pressure.
The Trader's Perspective: Opportunity in Volatility 💡
So, what does this all mean? It underscores a core principle of successful trading: volatility has a source.
For the prepared trader, this isn't a signal to abandon ship. It's a signal to consult your strategy. This is precisely the kind of environment where a clear, data-driven forecast becomes invaluable.
By understanding the root causes of the sell-off, you can better anticipate market structure, manage risk, and identify potential zones of support where "smart money" may begin to re-accumulate.
This is where the difference between a professional and a novice trader becomes clear. Experienced traders welcome every correction or pullback in the market, seeing it as an opportunity to re-enter and profit from the next upward wave. 📈
Therefore, instead of worry and stress, shift your focus to finding key reversal points and defining new entry zones (Watchboxes) for future trades at more attractive prices. View this price correction as a strategic opportunity, not a threat. 🚀
What are your thoughts on this pullback? Are you seeing it as a risk or an opportunity? Let's discuss in the comments. 👇
Trade Smart!
Navid Jafarian
Solana seeks to rebound ┆ HolderStatKUCOIN:SOLUSDT on the 6h chart broke through the $150 key level, then extended to 210 before correcting. The market is now testing 172.60 support. If buyers defend this level, upside targets at 190–200 remain valid.

SOL - Breakout or Rangebound?For me this chart is quite simple with two options, a bullish and bearish scenario. SOL is currently rangebound but the massive momentum in the broader market has opened the door to a potential breakout of this trading environment.
To look at the context of the chart we has a clear push from the midpoint up to range high, very little in the way of pullbacks until price breaks up above the old local high. We know that generally stop losses hide behind a key high or low and so price trading into it with such momentum is something to note when entering a trade at this level.
Liquidations for SOL are currently 50:50 long and short and so this balance shows no clear liquidation event in one particular way, at least not yet.
Bullish scenario -
SOL continues the rally above the range, strong volume to confirm that price is ready to expand beyond the area that failed in the past. A retest of $206 with a strong bounce gives this move a higher probability and proof buyers are still willing to buy at the level. Idea is invalid should price accept back below the range high, signifying buyers are not ready to sustain rally continuation.
Bearish scenario -
Price accepts below range high and shows that buyers are not willing to expend beyond the range. Naturally a retreat would then follow as the bears defend the same point that they successfully defended in the past (range high). Any price action that resembles chop within the red box would be a non action area as there is an area of balance giving no clear clue of direction either way.