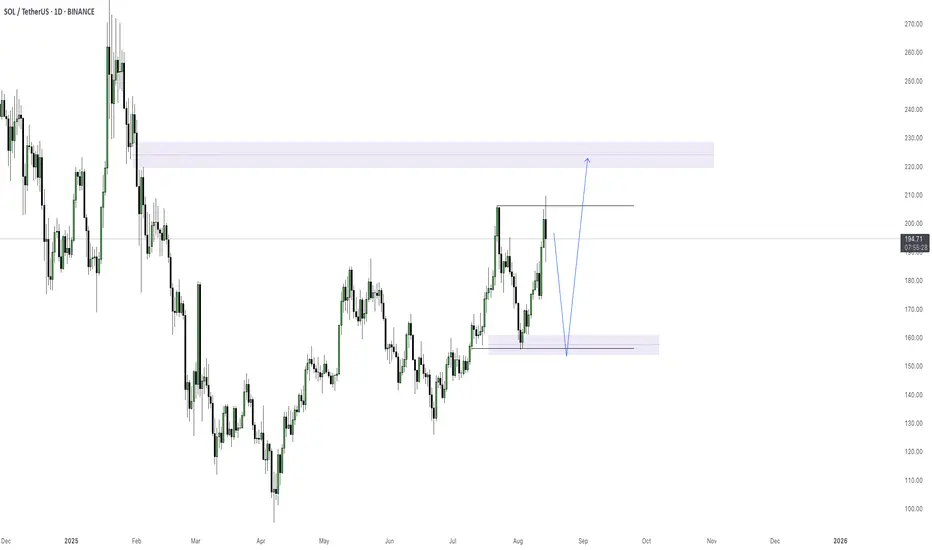
SOL. 100% upside potential.If markets as a whole remains bullish, probability of this move is high. CRYPTOCAP:SOL price has been touching the middle of the channel with higher lows since May.
Solana

Solana - Don't miss it General background and conclusions
Solana is showing a pre-split state - neutral with an upward slope, holding above MA-200 and receiving confirmation from structural patterns.
Technical signals point to the importance of the $188 level: its breakout will open the way to $200-206 and potentially to $247.
In the short term, growth to $180 is possible if the direction is confirmed.
In the absence of volumes and strength, a downward movement to the lower support of $160 and further is possible.
Recommendations
Strategy "buy on breakout": entry at the close and holding above $188 with a target of $200-206. Alternative: buy on dip to $160 in case of a technical rebound.
Stop loss: it is reasonable to place it just below $160.
Additional monitoring: It is important to monitor the dynamics of volumes, price behavior around $188, as well as the development of fundamental drivers (ETF, Firedancer, etc.) in order to clarify the movement scenario.

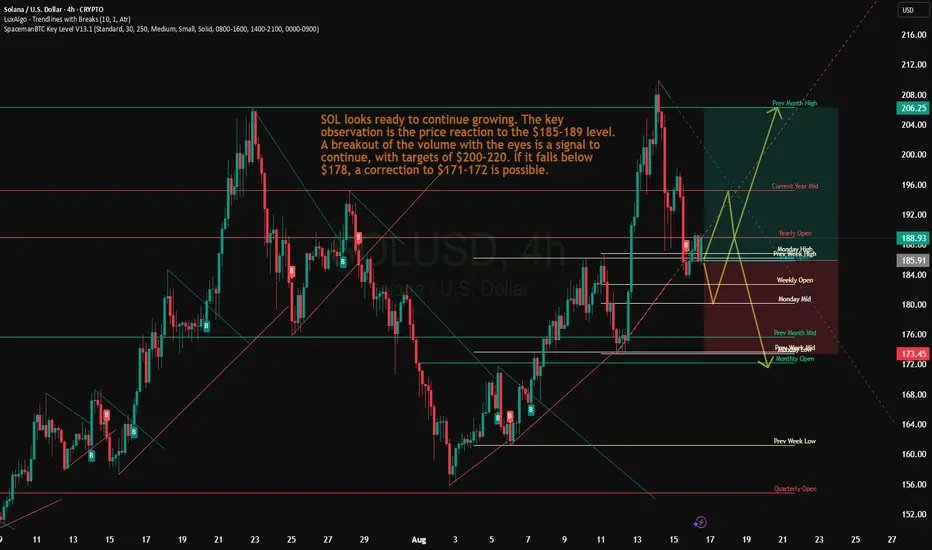
Solana: $178 to $200+ - The Next Level on the PathSOL/USD Technical Review
Support around $178 (20-day EMA) is holding the price, indicating high buying interest.
The key resistance level is $185–$189. A breakout of this range will open the way to targets of $200–206, possibly even $220 if the momentum continues.
Pattern formation: an upward reversal from the $160 zone (lower Bollinger band + Fibonacci) is recorded, which completes the ABC correction and launches a new wave impulse. Upside potential is towards $180.
Trend and on-chain indicators: a decrease in the balance on exchanges, an increase in TVL and growing institutional interest (ETF) create a solid base for moving higher.
SOL Volatility Period: Around August 18
Hello, traders!
Follow us to get the latest information quickly.
Have a great day!
-------------------------------------
(SOLUSDT 1M Chart)
If the price stays above the M-Signal indicator on the 1M chart, the uptrend is expected to continue.
If it falls below 126.36, you should stop trading and observe the movement.
Since the HA-High indicator is forming at 179.74, the key question is whether it can find support near this level and rise.
The start of a stepwise uptrend is likely to begin with a rise above 237.60, the DOM (60) indicator level.
Therefore, the key point to watch is whether it can find support in the 179.74-237.60 range.
The DOM (60) indicator indicates the end of a high, while the HA-High indicator indicates a decline from a high.
Therefore, the 179.74-237.60 range can be considered a high boundary zone.
When the DOM (60) or HA-High indicator first forms, a decline is likely.
If the decline is followed by a rise near the HA-High or DOM (60) indicator, the likelihood of an upward breakout increases.
Therefore, if support is found around 179.74 this time, it is highly likely to lead to an attempt to rise above 237.60.
-
(1W chart)
The key area to watch on the 1W chart is whether the price can break above the 202.45-222.61 level.
If the price breaks above the 202.45-222.61 level and maintains its upward momentum, a stepwise uptrend is likely to begin.
-
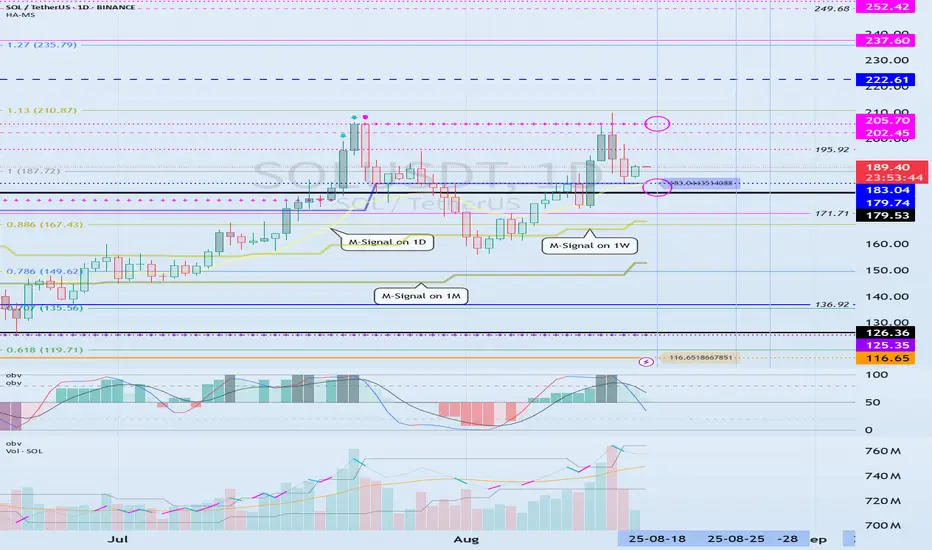
(1D chart)
The key area to watch on the 1D chart is whether the price can find support around 179.53-183.04 and rise above 205.70.
The 183.04 point is the HA-High indicator level, and the 205.70 point is the DOM (60) level.
If it falls below 183.04, it is expected to meet the M-Signal indicator on the 1W chart and re-establish the trend.
Ultimately, the price must remain above the M-Signal indicator on the 1M chart to maintain a strong uptrend.
Therefore, looking at the bigger picture, we need to determine whether the 126.36-179.53 range provides support and allows for an upward movement.
SOL's current volatility period is around August 18th (August 17th-19th).
At this time, we should look for a direction in which it deviates from the 183.04-205.70 range.
-------------------------------------------------
Only the concept of price moving averages, which I learned while studying chart analysis, is applied to the M-Signal indicator on the 1M, 1W, and 1D charts.
The rest of the explanation cannot be interpreted using existing chart analysis techniques.
This is because the HA-Low and HA-High indicators were developed for trading on Heikin-Ashi charts, while the DOM(60) and DOM(-60) indicators are a comprehensive evaluation of the DMI, OBV, and MOMENTUM indicators.
Therefore, to interpret my charts, you must apply the concepts of support and resistance points.
It's not that my chart explanations lack logic; they simply seem illogical because they can't be interpreted using existing interpretation methods.
Chart analysis should be as simple and concise as possible.
If you spend too much time analyzing charts or trying to apply complex theories, you will lack time to develop a trading strategy, increasing the likelihood of your trades going in the wrong direction.
To interpret my chart, all you need is a basic understanding of price moving averages and support and resistance.
Support and resistance points are determined by the horizontal lines of the DOM(60), HA-High, HA-Low, and DOM(-60) indicators.
The DOM(60) and HA-High indicators mark highs, while the HA-Low and DOM(-60) indicators mark lows.
Therefore, a basic trading strategy can be used: buy when the price rises from the DOM(-60) to HA-Low range, and sell when it reaches the HA-High to DOM(60) range.
However, if the price rises above the HA-High to DOM(60) range, a stepwise uptrend is likely, while if the price falls below the DOM(-60) to HA-Low range, a stepwise downtrend is likely.
Therefore, a segmented trading strategy should be adopted.
-
The basic chart for chart analysis is the 1D chart.
Therefore, it's best to trade in line with the trend of the 1D chart.
Therefore, the position that matches the trend of the 1D chart becomes the main position.
So, since the current trend of SOL's 1D chart is up, the LONG position becomes the main position.
To trade based on the trend of the 1D chart when trading futures, you need to set low leverage.
Therefore, when trading based on the timeframe chart you're viewing, increase your investment proportion when trading in line with the trend of the 1D chart. Conversely, when trading in the opposite direction, reduce your investment proportion and execute short, quick trades.
-
Thank you for reading to the end.
I wish you successful trading.
--------------------------------------------------
- This is an explanation of the big picture.
(3-year bull market, 1-year bear market pattern)
I will explain in more detail when the bear market begins.
------------------------------------------------------
SOLANA: THE ULTIMATE TECHNICAL CONVERGENCE..📊 THE TRADING PLAYBOOK
🛡️ CONSERVATIVE SUPPORT PLAY
Setup: Buy at Fibonacci support levels🚨
Entry: $158-$165 (0.618-0.5 zone) 🌟
Stop: $140 (Below all major support) ❌
Target:
Tp1 : $200(25% gain) 💰
Tp2 : $232 (40% gain) 💰
⚡ Position Size: 3-5% of portfolio ⚡
Time Horizon: 3-6 weeks 🎯
______ NOTE _______
DYOR ⚠️ Not financial advice. This analysis is for educational purposes only. Always do your own research and never risk more than you can afford to lose.
#SOLANA #SOL #SymmetricalTriangle #Fibonacci #Breakout #Crypto #TechnicalAnalysis #AltSeason #DeFi #MemeCoins #TradingSetup
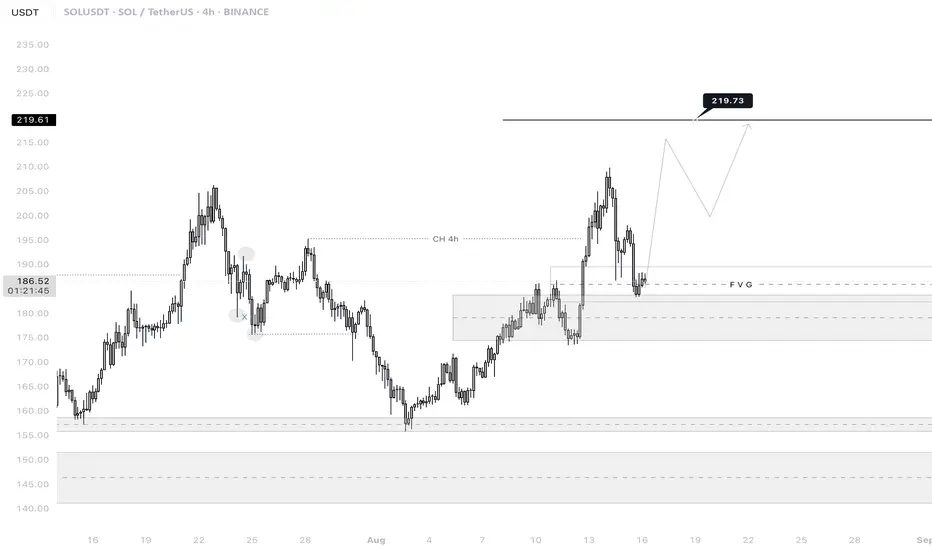
SOLUSDT 4H
🔎 Chart Context
• Pair: SOL/USDT
• Exchange: Binance
• Timeframe: 4H (240M)
• Date: 16 August 2025
This chart uses price action + liquidity concepts (CH, FVG, liquidity grabs, demand zones) for projection.
📊 Key Observations
1. Recent Highs & Lows
• Swing High: 209.86
• Previous High: 206.30
• Previous Lows: 173.43, 175.63, and 161.13
These levels represent liquidity points where orders are clustered.
2. Change of Character (CH 4H)
• Around 195.26, a CH (Change of Character) has been marked.
• This suggests that the bearish trend shifted into bullish momentum after reclaiming higher highs.
3. FVG (Fair Value Gap)
• The current price is retesting the FVG zone after rejecting from 209.86.
• FVG zones typically act as rebalancing levels where price either consolidates or launches into the next move.
4. Demand Zones
• 173.43 – 177.73: Strong demand area with previous accumulation.
• 155.83 – 157.23: Deeper demand zone that may act as a long-term support if the market drops sharply.
• Current reaction shows bulls protecting 173–177 zone.
5. Upside Target
• Next projected liquidity pool is at 219.73.
• This is above the 209.86 high, indicating liquidity sweep potential and continuation of bullish trend.
📈 Bullish Case (High Probability)
• Price held the FVG + demand block around 173–177.
• Higher High (209.86) confirmed a bullish structure.
• If momentum sustains, target = 219.73, where liquidity above old highs is likely to be taken.
• Expect potential retracement back to 195–197 before pushing up.
📉 Bearish Case (Low Probability but Possible)
• If SOL fails to hold 173–177 demand zone, we may see a deeper retracement toward 161–157 support zone.
• Losing that level would invalidate the bullish structure and turn the chart back into distribution mode.
⚡ Trading Plan
• Entry (Long): Accumulation around 173–177 (FVG/Demand zone).
• Target 1: 195–197 (partial take-profit).
• Target 2: 209.86 (previous high).
• Target 3 (final): 219.73 (liquidity sweep zone).
• Stop-loss: Below 173 (safe stop), or aggressive stop below 182.70 minor structure
BGB/USDT — Symmetrical Triangle: Breakout or Fakeout?Overview
BGB/USDT is consolidating within a symmetrical triangle pattern (descending resistance + slightly ascending support) as volatility narrows toward the apex. The price is currently around 4.58, after a rejection near the upper trendline — possibly a liquidity grab. This setup usually precedes a strong move once a valid breakout or breakdown occurs.
---
Pattern Explanation
Type: Symmetrical / contracting triangle
Key characteristics: Shrinking volatility, lower highs + higher lows, volume gradually decreasing.
Context: The structure formed after a strong correction from highs, which often implies a continuation bias unless a clear bullish breakout emerges.
---
Key Levels
Current price: 4.58
Near-term resistance: 5.03 → 5.60 → 5.99
Major resistance zones: 7.62 → 8.11 → 8.50 (ATH zone)
Support: Triangle base (dynamic support around 4.0–4.4), then 3.60 and 3.00 if breakdown continues.
---
Bullish Scenario (confirmation required)
Confirmation: Daily close above the upper trendline with strong volume and successful retest.
Entry idea: Conservative entry above 5.03 with retest confirmation.
Targets:
TP1: 5.60
TP2: 5.99
Aggressive: 7.62 → 8.11 → 8.50
Measured move projection: (8.50 − 3.60 = 4.90). Breakout from ~5.03 could project up to 9.93 (theoretical target).
Invalidation: Failure to hold above 5.03 or a rejection back inside the triangle.
Stop-loss: Below retest breakout (~4.40) or below triangle support.
---
Bearish Scenario (confirmation required)
Confirmation: Daily close below triangle support with above-average volume.
Entry idea: Short entry after breakdown + failed retest.
Targets:
TP1: 4.00
TP2: 3.60
TP3: 3.00 (if strong continuation).
Invalidation: Daily close above the upper trendline or reclaim above 5.03.
Stop-loss: Above failed breakout level or triangle resistance.
---
Things to Watch
Volume: Breakouts without volume are often fakeouts.
Retest: Strong confirmation if old resistance turns into new support (bullish) or old support flips into resistance (bearish).
Daily candle close: Wick alone is not reliable; wait for candle close.
Market correlation: BTC and ETH trends may influence BGB’s breakout direction.
---
Risk Management Notes
Limit risk per trade (1–2% capital).
Use scaling entries if breakout is sharp.
Always set stop-loss and take-profit in advance.
Be cautious of false breakouts — triangles often fake one side before moving in the opposite direction.
---
Conclusion:
BGB/USDT is consolidating in a symmetrical triangle, signaling a potential big move ahead. For bulls, watch for a close above 5.03 with volume. For bears, confirmation comes with a close below triangle support. Until then, the setup remains neutral.
> Disclaimer: This is not financial advice. Do your own research and manage risk accordingly.
#BGBUSDT #CryptoAnalysis #TechnicalAnalysis #SymmetricalTriangle #Breakout #SupportResistance #SwingTrade

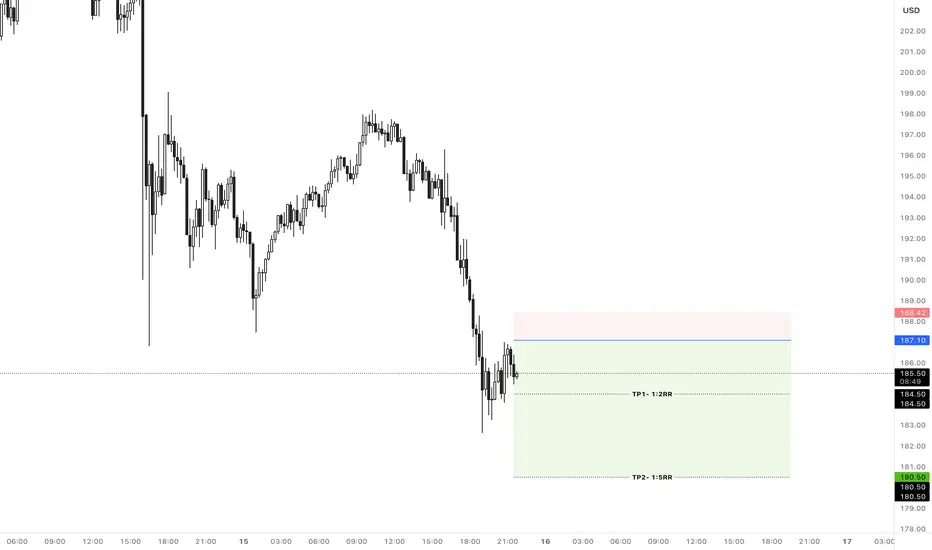
Solana Short SetupHi everyone.
I think we can set an order in this area to go short.
As we're in daily Order Block and getting close to the demand zone, so I'll post a buy setup after this one.
Let's see how does the market reacts.
Dear traders, please support my ideas with your likes and comments to motivate me to publish more signals and analysis for you.
Best Regards
Navid Nazarian
SPARKUSDT +3000% in a week🚀 SPARKUSDT +3000% in a week
🙉 The SPARKUSDT token has grown by more than 3000% in less than 7 days.
It's simply mind-blowing.
At the time of launch, the Solfun indicator showed 63.8% reliability — an excellent indicator for a new token.
Who else uses these metrics and indicators?

WALUSDT — Breakout or Breakdown? Golden Pocket the Key!Quick Context: Since May, price has formed a series of lower highs connected by a descending trendline (yellow). Beneath it lies a strong demand zone at 0.406–0.420, aligning with Fibonacci 0.5 (0.419) and 0.618 (0.407) — the golden pocket. Current price is around 0.435, pressing against the trendline and approaching the apex of the pattern.
Pattern & Key Levels
Main Pattern: Descending Triangle (downward-sloping top, relatively flat base/zone). Theoretically slightly bearish, but since it sits right on the golden pocket with compression, the probability of an impulsive breakout in either direction is high.
Major Demand / Support: 0.406–0.420 (golden pocket + base).
Immediate Resistance: descending trendline + 0.44–0.46 area.
Next resistance targets (yellow dashed lines): 0.484 → 0.542 → 0.674 → 0.732.
Downside supports if broken: 0.380 → 0.350 → 0.296.
Bullish Scenario
1. Confirmation: Daily close above the trendline and ideally > 0.460 (clear breakout confirmation).
2. Healthy Retest: Pullback to 0.44–0.46 / trendline, now acting as support.
3. Step Targets:
T1: 0.484
T2: 0.542
T3: 0.674
T4: 0.732
4. Bullish Invalidation: Daily close back below 0.420; strong invalidation if < 0.406 (loss of golden pocket).
Bearish Scenario
1. Rejection: Fails to break 0.44–0.46 / trendline and turns down.
2. Weakness Confirmation: Daily close below 0.406 (loss of base + golden pocket).
3. Downside Targets:
S1: 0.380
S2: 0.350
S3: 0.296
4. Bearish Invalidation: Daily close above 0.460 with a successful retest flips bias to bullish.
Execution Notes
Apex Break: The closer price gets to the apex, the higher the risk of false breaks — always wait for a daily close to confirm.
Volume: A valid breakout should be accompanied by increasing volume.
Risk Management: Place stops beyond the invalidation zones of your chosen scenario (below 0.406 for breakout longs; above 0.460 for rejection shorts).
> Summary: WALUSDT is being squeezed between the descending trendline and golden pocket 0.406–0.420. A daily close above 0.460 could open the path to 0.484/0.542, while a breakdown below 0.406 may trigger a drop towards 0.380–0.350.
Not financial advice; purely for educational and technical reference.
#WALUSDT #Walrus #CryptoTA #PriceAction #DescendingTriangle #Fibonacci #SupportResistance #Breakout #RiskManagement

SOLUSDT ling term"🌟 Welcome to Golden Candle! 🌟
We're a team of 📈 passionate traders 📉 who love sharing our 🔍 technical analysis insights 🔎 with the TradingView community. 🌎
Our goal is to provide 💡 valuable perspectives 💡 on market trends and patterns, but 🚫 please note that our analyses are not intended as buy or sell recommendations. 🚫
Instead, they reflect our own 💭 personal attitudes and thoughts. 💭
Follow along and 📚 learn 📚 from our analyses! 📊💡"

Sol/usdt - shortShort SOL/USDT for a 20–25% drop into September, then flip long to target the weekly gap at $215–$225 and aim for a new all-time high.
Solana Buy SetupHi everyone.
Right now we're in a pullback and I think this area has its potential to set an order.
Please consider the risk management.
Dear traders, please support my ideas with your likes and comments to motivate me to publish more signals and analysis for you.
Best Regards
Navid Nazarian

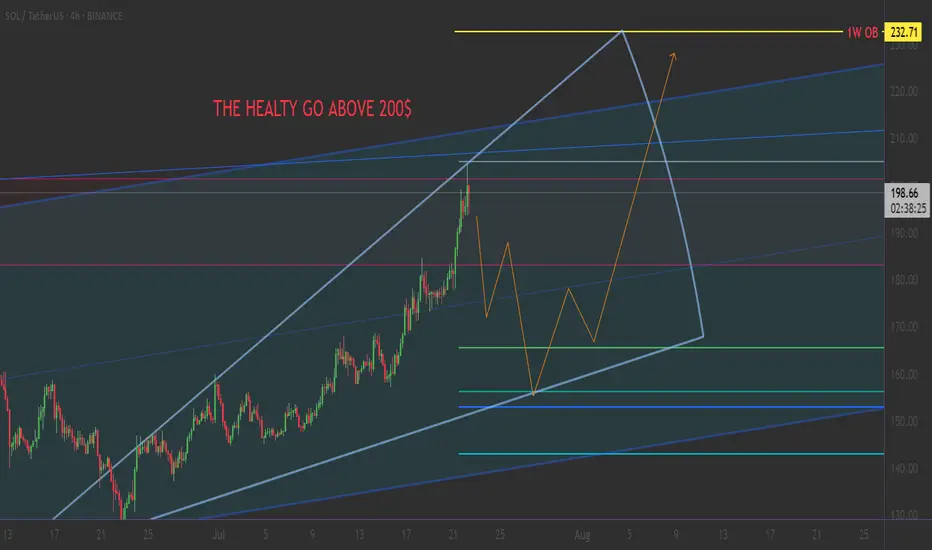
Solana off to the races??? Is Solana unstoppable?
The fibbs from the bottom to the ATH showed clearly, Solana hit the 0.702 once, then again the 0.618 and then bounced off the 0.5 around USD153.
It is currently blasting through 200USD, was that the point of no return?
Whats your target in Solana? Comment.

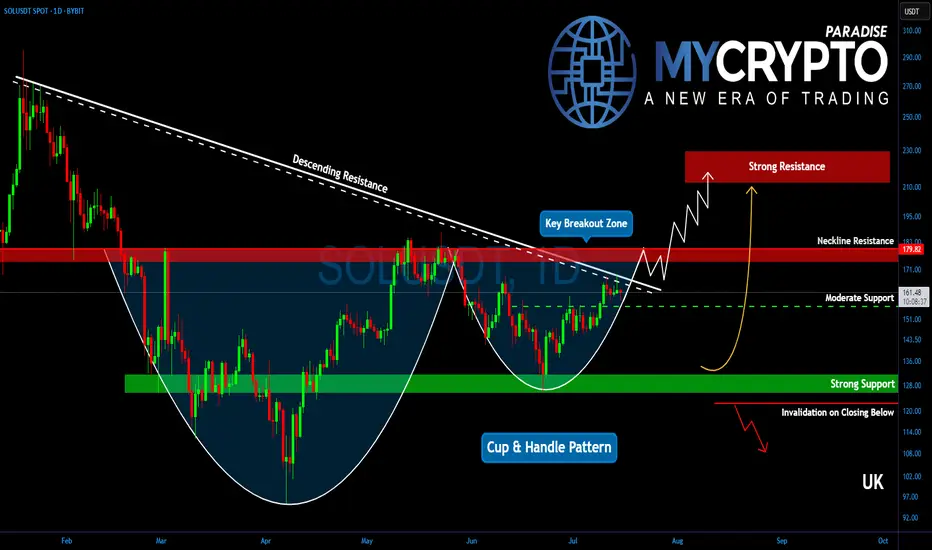
Will Solana Explode? This Important Zone Could Trigger a MoveYello, Paradisers! Is #Solana about to break free into a new bullish wave? After months of struggling under key resistance, the bulls are finally making a serious push… but only one zone stands between SOL and a potential explosion.
💎After peaking in January, Solana has remained suppressed under a descending trendline. But now, that trendline is being challenged aggressively, and the price structure is starting to form a reversal pattern that demands attention.
💎Right now, the most important level on the chart is the descending channel resistance at $167. Bulls are actively testing this zone, and if they manage to flip it into support, it could trigger a significant shift in momentum. But just above, at $180, sits an even more critical barrier, the neckline of the current reversal pattern. This entire region between $167 and $180 is the true battleground.
💎#SOLUSDT's confirmed breakout above $180 would be a major technical signal. It would likely send Solana toward the $210 to $225 zone, which marks a significant resistance area. This isn’t just psychological; it also aligns with the 61.8% Fibonacci retracement, a level where institutional players often begin offloading positions
💎As for the downside, support remains solid between $155 and $160. This region is protected by both horizontal demand and dynamic support from key moving averages, offering bulls a stable base to defend. Adding to the bullish case is a potential golden cross formation between the EMA-50 and EMA-200, a signal that, if confirmed, could inject even more confidence into Solana’s price action.
Paradisers, strive for consistency, not quick profits. Treat the market as a businessman, not as a gambler.
MyCryptoParadise
iFeel the success🌴
Solana Summer Kick-Start Lunar MissionCRYPTOCAP:SOL IS REPRICING.
Gimme a Weekly Close above this POI and it’s gonna rip your mother’s face off.
Bullish Engulfing Candle kicked off the 3D run with a close above the 50% Gann.
Riding well above the DMA9.
RSI has plenty of gas left in the tank.
You've been warned.

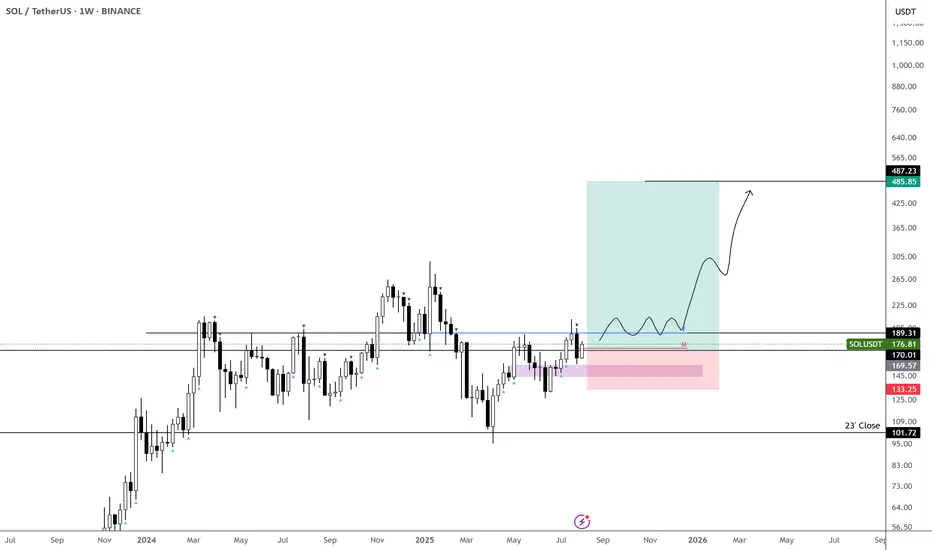
Solana Trades Above $200: New ATH Revealed, Next Target & MoreSolana has been consolidating within a very wide range since February 2024. Solana ended its bear market December 2022. The market bottom was followed by a quick bounce and accumulation phase at low prices.
A 280 days long consolidation (Dec 2022 - Oct 2023) produced a rise from $20 to $210 ending March 2024. From this point forward we have a new long consolidation period but this time instead of 280 days SOLUSDT has been ranging for 525 days. Imagine how strong the next advance will be.
280 days of consolidation was enough to produce 10X growth.
Solana produced a low recently in April and has been recovering since. Prices from late February 2024 through present day form part of a sideways consolidation channel. This period is reaching its end.
The last low marked the end of this period and the start of the next bullish wave. This bullish wave is ongoing now and soon Solana will break local resistance and hit a new all-time high.
Right after the all-time high the first resistance zone of importance is $415 ($420 in some cases). Next we have $667 ($620 in some cases) and these are the levels to watch.
Current market conditions support a rise on SOLUSDT reaching $900 - $1,100.
Soon we will know if the market can continue even higher. For now these are the targets for this 2025 bull market. We are only weeks away from a major frenzy.
Namaste.

SOLANA Potential Bullish Breakout OpportunitySolana seems to exhibit signs of a potential Bullish Breakout on the Shorter timeframes as the price action may form a credible Higher High with multiple confluences through key Fibonacci and Support levels which presents us with a potential long opportunity.
Trade Plan:
Entry : CMP
Stop Loss : 172
TP 1: 202.5

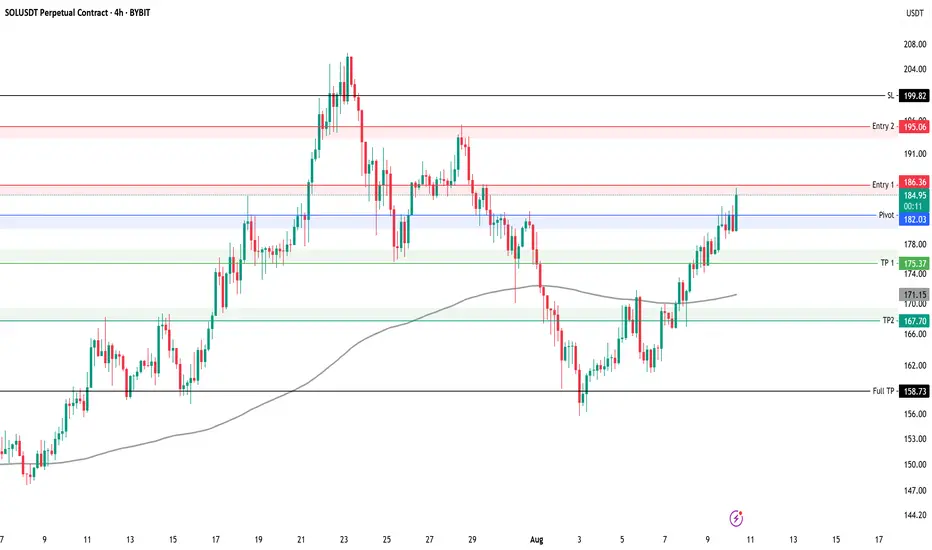
SOLUSDT Short Key levels to watch for SOLUSDT 4H
We have taken first entry on this setup using 0.5% risk
Risk per entry 0.5%
Entry 1: 186
Entry 2: 195
TP 1: 175
TP 2: 167
Full TP: 158
SL: 199
Always manage your own risk. None of the above is financial advice.
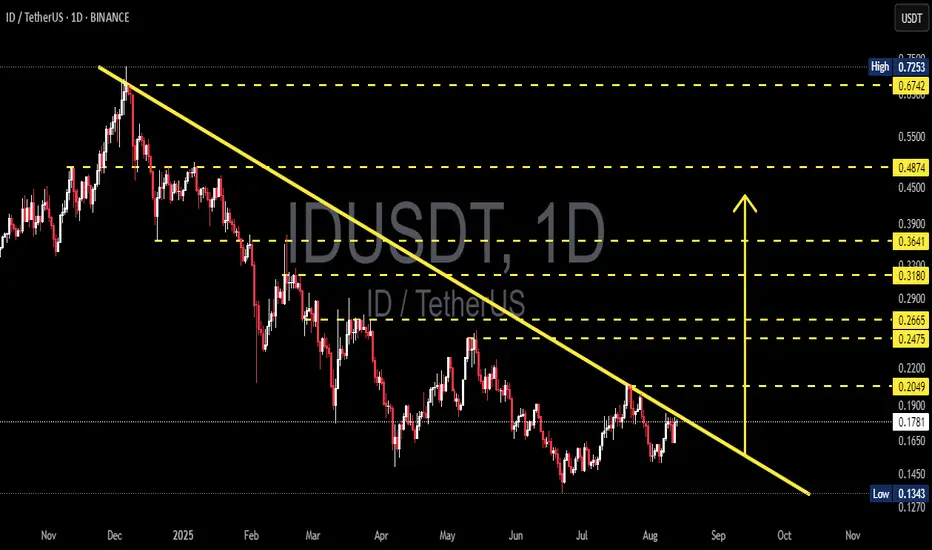
ID/USDT — Final Battle at the Multi-Month Downtrend Line!📌 Market Structure Overview
Since peaking in late 2024, ID/USDT has been trapped under a relentless multi-month downtrend line lasting almost 10 months. Every rally attempt has been shut down at this descending wall.
Now, the market is at a critical inflection point — price is pressing right against the trendline and sitting in the decision zone between 0.190–0.205.
A breakout here would not only be a technical victory for the bulls but could also trigger a shift in market psychology from seller dominance to buyer control.
---
📊 Key Levels to Watch
Major Resistances: 0.2049 → 0.2475 → 0.2665 → 0.3180 → 0.3641 → 0.4874 → 0.6742
Supports: 0.177–0.180 → 0.165 → 0.134–0.145 (major demand zone)
---
📐 Pattern & Sentiment Analysis
The dominant structure is a classic Descending Trendline Resistance, showing consistent lower highs under seller pressure.
However, there’s an early sign of sentiment shift — a higher low compared to the July bottom, suggesting that buyers are stepping in earlier and absorbing supply.
If price can close a daily candle above the trendline and 0.2049, we could see the start of a trend reversal rally toward higher resistance levels.
---
🚀 Bullish Scenario
1. Trigger: Daily close above the trendline + 0.2049.
2. Confirmation: Retest of 0.19–0.205 holds as new support.
3. Upside Targets:
Initial: 0.2475
Mid-term: 0.2665 → 0.3180
Extended: 0.3641 (psychological zone)
4. Invalidation: Closing back below 0.190 or losing 0.177–0.180.
---
📉 Bearish Scenario
1. Trigger: Sharp rejection from the trendline/0.19–0.205 zone.
2. Downside Targets:
First: 0.177–0.180
Next: 0.165
Extreme: 0.134–0.145 (historical low)
3. Invalidation: Sustained breakout above 0.205 with strong volume.
---
⚖️ Perspective & Risk Management
This is a “make or break” moment for ID/USDT.
Don’t rely solely on intraday spikes — wait for a confirmed daily close to avoid fakeouts.
Use the above S/R levels as tiered take-profit zones and for placing protective stops.
#IDUSDT #ID #Crypto #PriceAction #TechnicalAnalysis #DowntrendBreak #Breakout #SupportResistance #CryptoTrading
It’s Been a While... $SOL is back!
CRYPTOCAP:SOL has been stuck in a 100–200 range for a while now, with anything outside acting as a liquidity grab before reversing.
Back in March, the market was trying to print a bearish signal (obviously failed), so I didn’t have a clear picture then. Now, it’s back on track.
The monthly isn’t as satisfying as other charts—candle lacks strength and closed below the yearly open. That said, price just tapped the $100 range low, so naturally the next big expectation is a break above $200 with conviction and new highs.
I don’t think CRYPTOCAP:SOL will be the highlight of crypto this cycle, but there’s still a potential 2x from here worth taking advantage of.
Solana Long SetupHello everyone.
As we've met the daily FVG, it's possible that the price come down to touch this level and then go up again...
Please always consider the risk management.
Dear traders, please support my ideas with your likes and comments to motivate me to publish more signals and analysis for you.
Best Regards
Navid Nazarian

$200 soon - SOL weekly update August 12 - 18thFrom an Elliott Wave perspective, the scenario for Solana has been slightly adjusted from previous counts. Current price action suggests that SOL is already in an impulsive upward move, which aligns well with the broader correlation observed across the altcoin market. As with many other altcoins, the structure shows a completed 1–2 sequence at the Primary degree and another 1–2 sequence at the Intermediate degree. At the Minor degree, price is in the final stages of Wave 1, specifically in Minute Wave 5.
An alternative scenario — less likely but still possible — is that the move is actually a corrective structure, with the Minor degree currently forming Wave C. This would become more probable if price extends significantly beyond the 1.618 Fibonacci extension, as such behaviour would be atypical for a standard fifth wave.
From a liquidity standpoint, short- to medium-term bias points upward. The liquidity heatmap shows a large concentration of liquidity at the local high of Wave 3, as well as significant order clusters near the 1.0 extension target for the current Wave 5. However, substantial liquidity is also accumulating below current price, which will likely be targeted during the subsequent Wave 2 retracement.
Funding rates have shifted from slightly negative toward positive territory, and open interest is climbing — both signs of a stable and sustained upward move.
Macro conditions also support the current market tone. The latest CPI data came in at 2.7%, better than expected, boosting sentiment. As the FOMC meeting approaches, retail traders are increasingly positioning for a potential “altseason” — a dynamic that raises the probability of a sell-the-news event if expectations are overextended.
Given the current wave structure, liquidity positioning, and macro backdrop, the 1.0 Fibonacci extension level has been set as the primary target for the completion of this Minor Wave 5. This area aligns with heavy order clustering and fits the typical profile for a fifth wave termination before a corrective phase.
Do your own research — and trade safe.
