Solana Testing the June Breakdown Level — Decision TimeAfter weeks of slow grind, SOL is now pressing into a level that triggered a major selloff in June. A clean breakout here could flip momentum hard — but if buyers stall again, a short-term double top could catch late longs off guard. Watching $185 closely.
Solana

SOL/USDT Technical Outlook – Breakout Holding, Eyes on 175+Solana has successfully broken above the key resistance zone at $155–157 and is currently testing it as new support. If the level holds, this breakout could extend toward the next major target around $175–178.
📌 Key Insights:
Clean breakout followed by a potential SR flip
Watch for confirmation of support before continuation
Target aligns with previous swing high
Invalidated on breakdown below reclaimed level
🟢 Bias remains bullish as long as price holds above the breakout zone. A confirmed retest could provide a high-probability long setup.
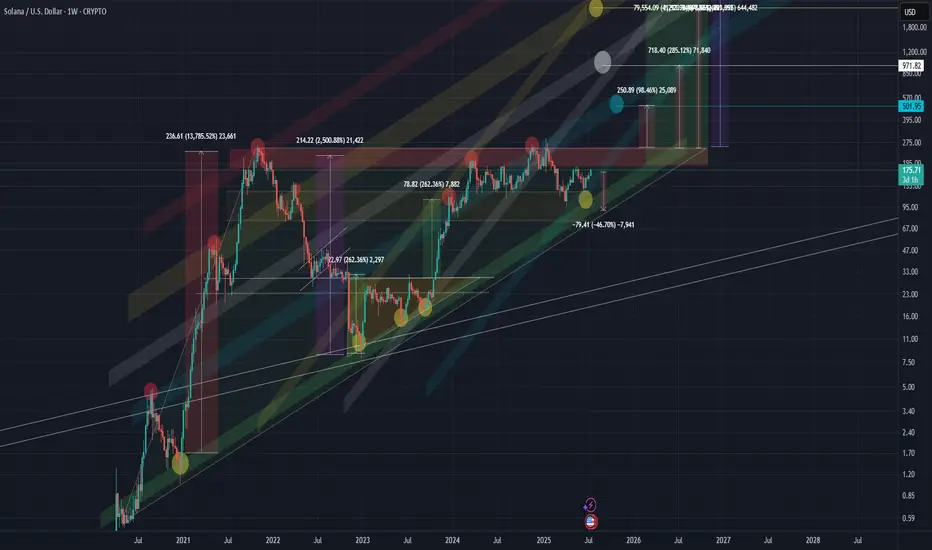
SOLANA SOL 1WThis coin is showing very interesting development, and the market maker seems to be painting clear structural patterns.
🔷 Macro Structure: Rising Triangle
On the higher timeframes, we can clearly see a rising triangle formation taking shape. If this pattern breaks out to the upside, the potential measured move suggests a target of up to ~2,500% from current levels.
📊 Chart Overview
Wide zones = key support and resistance
Former resistance often becomes support after a breakout
All target levels and zones are clearly marked on the chart
⚠️ Risk Warning & Realistic Scenario
Be mindful of market behavior:
Often before a bullish breakout, we see a fake breakdown — a trap to liquidate early longs — followed by a return into the triangle and a strong move upward. Don’t rush. Let the pattern confirm itself.
💡 Plan Accordingly
If you're already in, consider protecting your position with a stop-loss
Don’t overleverage, and take profit partially on strong levels
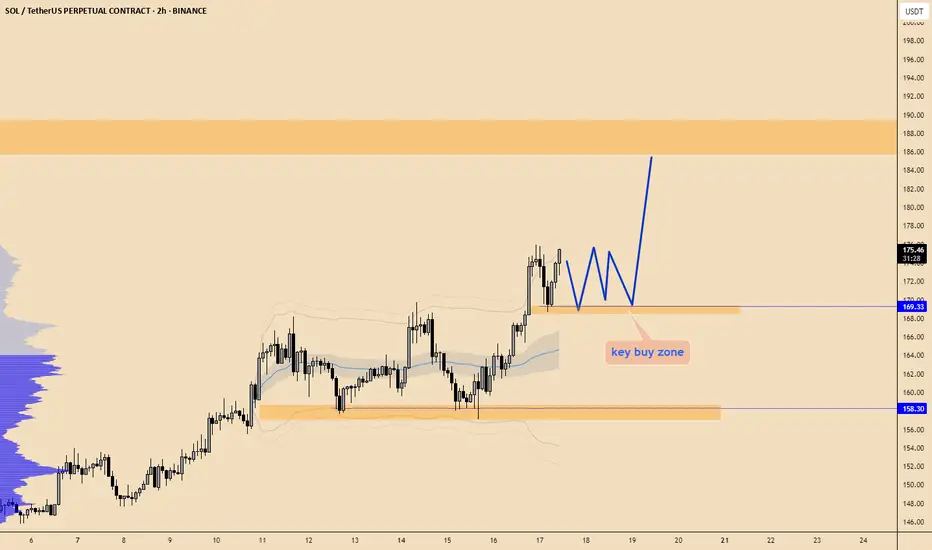
#SOL Update #5 – July 18, 2025#SOL Update #5 – July 18, 2025
Solana has returned to the region where its last impulsive move was formed. It appears to be attempting another bounce, but when we look at the SOL/BTC pair, it is currently facing a strong resistance zone.
There isn't much room between this resistance and the 200 MA band, which makes this a critical decision zone. At the moment, I do not recommend entering either a Long or Short position — it’s best to wait and observe.
If Solana breaks out to the upside, the next target will likely be $179.

Solana - The Cup is Almost FullSolana is printing a textbook cup & handle formation on the daily, and price is now pressing against the neckline resistance near $185, just below the psychological $200 zone.
This structure reflects months of accumulation and rising momentum. A confirmed breakout above the $185–$199 resistance would likely trigger the next upward leg.
This setup signals trend reversal continuation, and if SOL closes above $199 on high volume, momentum traders may pile in quickly.
📌 Invalidation below $150 = pattern risk-off.

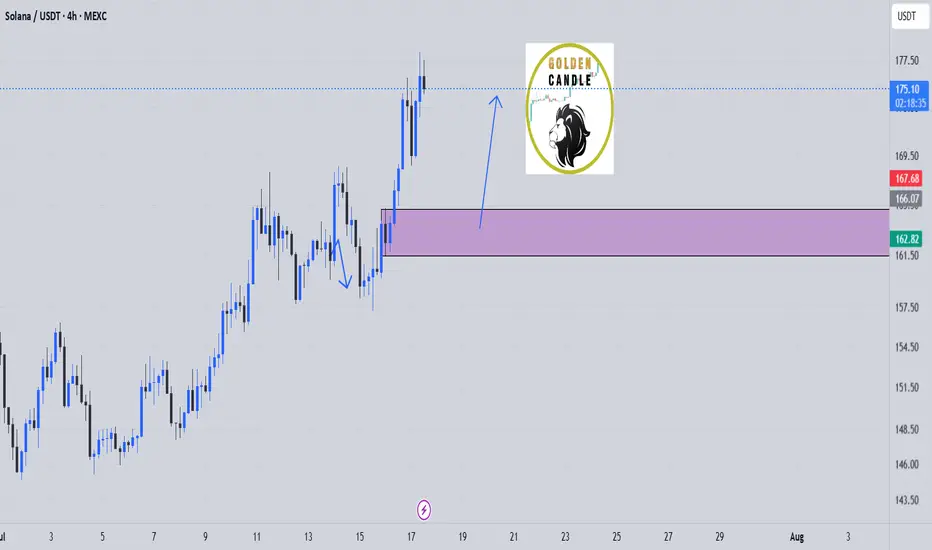
sol buy midterm"🌟 Welcome to Golden Candle! 🌟
We're a team of 📈 passionate traders 📉 who love sharing our 🔍 technical analysis insights 🔎 with the TradingView community. 🌎
Our goal is to provide 💡 valuable perspectives 💡 on market trends and patterns, but 🚫 please note that our analyses are not intended as buy or sell recommendations. 🚫
Instead, they reflect our own 💭 personal attitudes and thoughts. 💭
Follow along and 📚 learn 📚 from our analyses! 📊💡"
SOL/USDT : SOL Rebounds Strong – Is a 25% Rally Just Beginning?By analyzing the Solana (SOL) chart on the daily timeframe, we can see that after dropping to the $147.75 zone, the price experienced renewed buying pressure and has since rallied to around $159, delivering over 6% return so far.
This cryptocurrency shows strong bullish potential, with short-term gains possibly exceeding 25%.
The next upside targets are $168.5, $187, $220, and $263.
Please support me with your likes and comments to motivate me to share more analysis with you and share your opinion about the possible trend of this chart with me !
Best Regards , Arman Shaban

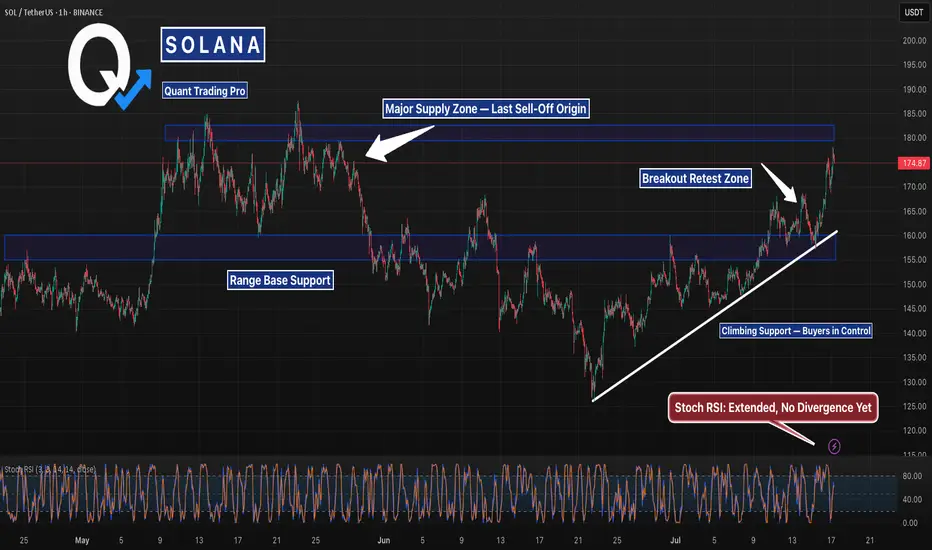
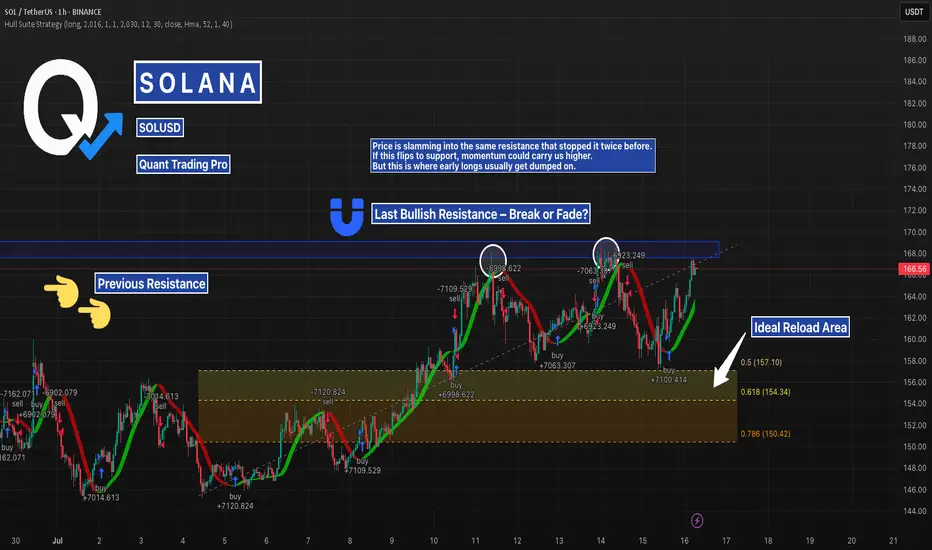
SOL Back at the Same Level It Dumped From — But with BackupSOL is right back where the last major dump started — but the structure this time is way cleaner. Higher lows, trendline support, and strong momentum behind the push.
If it clears this zone, we could see fireworks. But don’t fade resistance this thick without confirmation.
#Solana #SOLUSD #CryptoCharts #BreakoutWatch #ChartAnalysis #TrendlineSupport #CryptoTraders #QuantTradingPro #TradingView
Solana Update: Miss This Analysis, Miss the Next Leg!Hey, I’m Skeptic! 🩵 Solana’s recently kicked off a strong uptrend momentum , and there are solid triggers waiting to activate that could bring good profits. In this analysis, I dove into Solana on weekly, daily, and 4-hour timeframes, and checked SOLBTC and BTC.D too, to get a grip on the current liquidity flow.
💬What’s your trigger on Solana? Drop it in the comments, and if you want an analysis on a coin, write it for me so I can check it out.

SOLUSDTThis chart BINANCE:SOLUSDT say to me that change of character. But we need to best confirmations for buy for example: pollback to 143 - 147 $ and higher high next pollback to level.
Support: 147 - 143 - 131.50
Resistance: 158 - 170 - 177 - 183
⚠️Please Control Risk Management in trades.

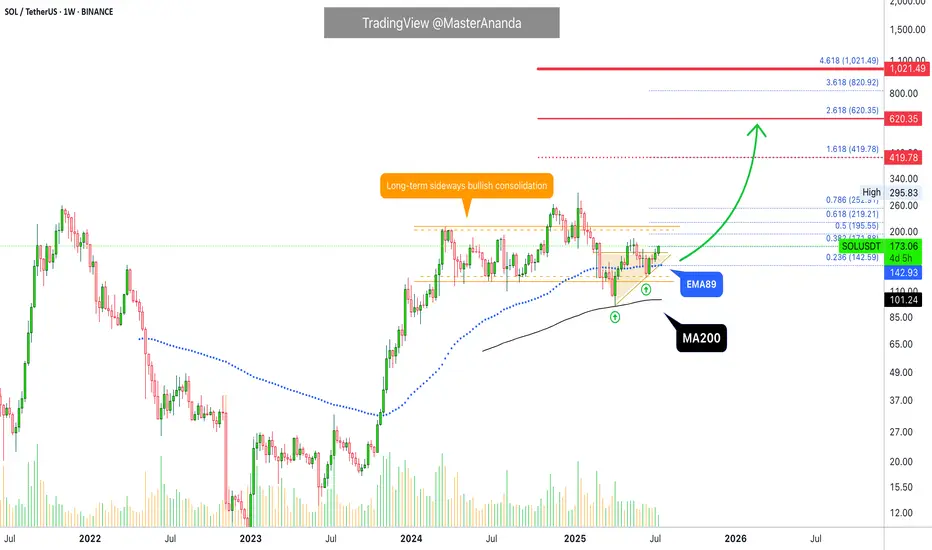
Solana Ultra-Bullish Above MA200 & EMA89 · $1,000 ExplainedOne guy was saying Solana was set to move lower because it already produced a "3,000% bullish wave." What nonsense... Solana is ultra-bullish. We don't do an analysis based on some unintelligent assumption rather, we focus on the data, the signals, the indicators, the chart.
Solana corrected and found support perfectly, exactly at MA200 in April 2025. Boom! It never went below so it was never bearish to start. A true long-term bull market a la Bitcoin.
And more recently, on the 16/23-June weeks, it traded briefly below EMA89 just to recover and later start rising. This is a strong bullish signal on its own. The fact that bears tried to push prices lower and failed; bullish. The fact that there is a strong higher low between the test of MA200 and EMA89. The fact that we can make mistakes with our interpretations but the chart is never wrong.
The fact is that Solana is going up with the next easy but strong target being $420. It can reach, later down the road, $620 and even higher to peak at $1,000+. Can you see what I see? Crypto is going up.
Bitcoin is going up. Solana is going up. Ethereum is going up. Cardano is going up. XRP is going up. Dogecoin is going up. We are going up. The new financial market is growing. It is not just these projects but Cryptocurrency will replace the old financial system, this is another fact. The older system will be left behind because Crypto's market cap. will grow so strong and so fast, maybe a 10 years long bull market will do the trick, we will start with four.
If you want to be high more forever rich, buy Crypto. Solana is a good choice.
Thanks a lot for your continued support.
Namaste.
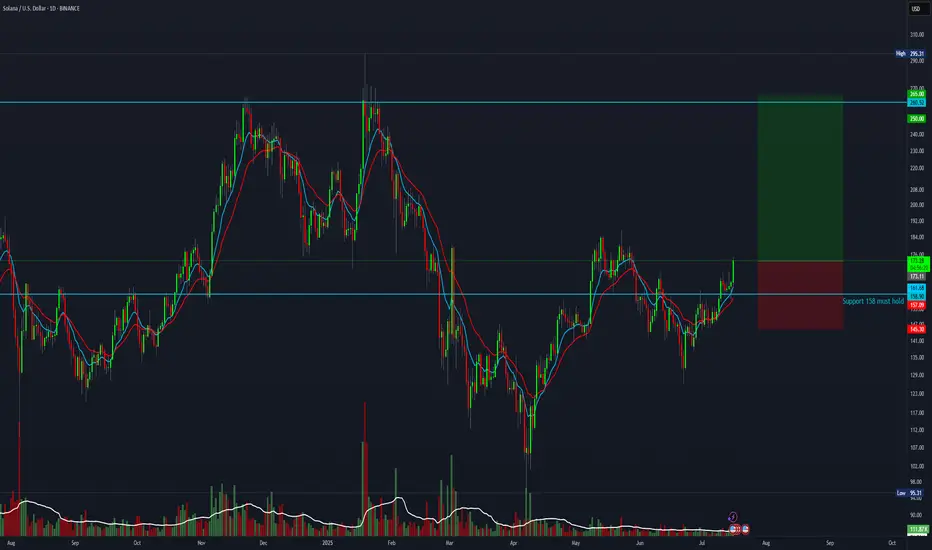
SOL trade setup with a 3.3:1 risk-to-reward ratioThis trade setup offers a 3.3:1 R:R
Entry: 174
Stop Loss: 145
Target: 265
SOLUSD – Big Test at Local Resistance | Fib Reload if RejectedSolana just tapped into prior resistance from July 13–14, a level that previously rejected price.
With fib confluence between $157–$150 below, this is a textbook setup: breakout or rejection → smart money looks for the reload.
Watching closely for structure shift before taking position.
#SOLUSD #Solana #Crypto #Breakout #SupportResistance #QuantTradingPro #TradingView
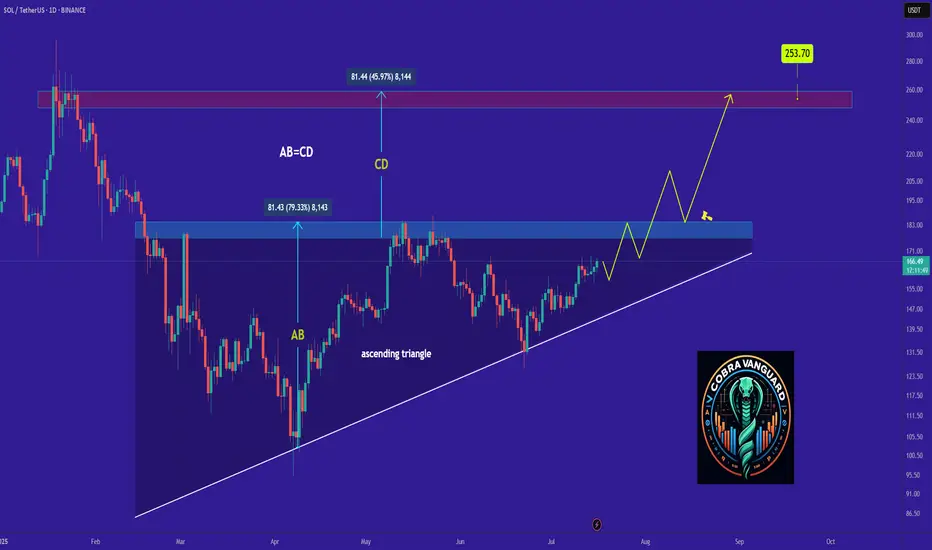
SOLANA's Situation, A Comprehensive Analysis !!!The price on the DAILY timeframe is within an ascending triangle, which can be promising. If the price breaks this pattern with bullish candles, it could easily rise by the distance of AB=CD .
Best regards CobraVanguard.💚
SOL / ETH at Critical Inflection PointSOL / ETH loses the 50WMA.
Has been trading below it for the past 7 weeks, something we haven't seen since 2021.
Has also broken down from the 8 month bull flag / parallel channel. Retesting the key POI I've been eyeing.
HOPIUM: We've seen great rallies after CRYPTOCAP:SOL goes down ~40% vs CRYPTOCAP:ETH , which it is at now. We SHOULD see a turnaround here soon.
And I still believe SOL will greatly outperform ETH this cycle, especially when the ETF launches and Alt Season kickstarts.
Right now we're seeing a typical market cycle BTC > ETH > Large Caps > Mid Caps > Micro Caps

Solana:Daily free signalhello friends👋
As you can see, after the drop that we had, insider buyers showed and were able to support the price well.
But it was not enough, and as you can see, a noisy pattern has formed, which can indicate a further decrease in the price.
Now we can take advantage of this opportunity and make step-by-step purchases with risk and capital management in the support areas that we have obtained for you and move to the specified goals.
🔥Follow us for more signals🔥
*Trade safely with us*

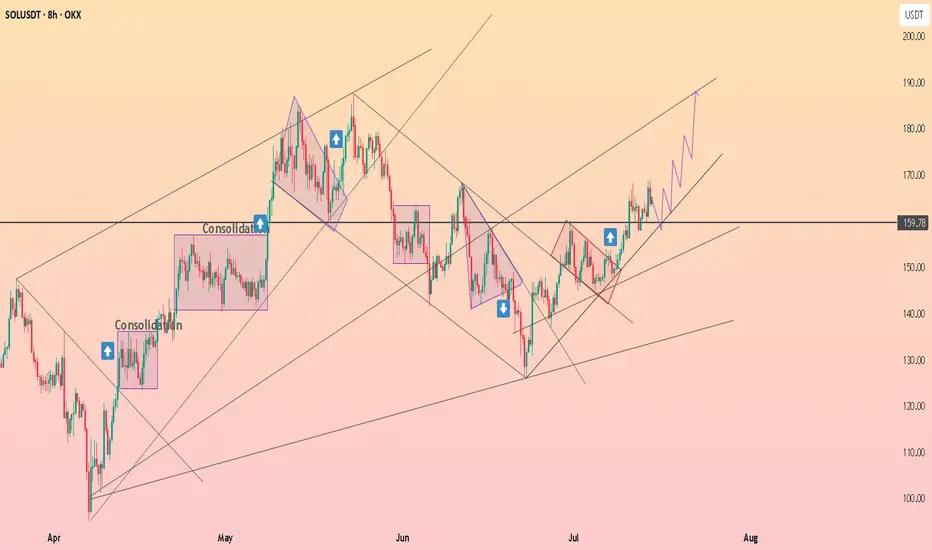
HolderStat┆SOLUSD above the $160 levelBINANCE:SOLUSDT has cleared key resistance at $159.78 after a series of consolidation patterns. The breakout has followed through into an ascending channel aiming at $185. Price remains structurally bullish with higher lows and strong recovery setups.
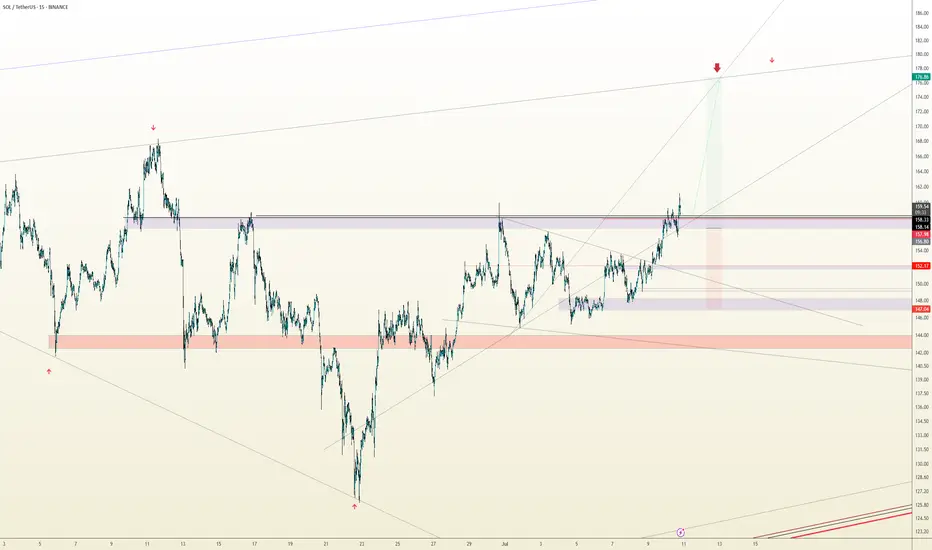
#SOL Update #4 – July 15, 2025#SOL Update #4 – July 15, 2025
Solana’s latest impulsive move failed to close significantly higher than the previous one. In fact, they closed at nearly the same level, which raises the risk of a potential double top pattern.
Looking at the current 4-hour chart, Solana seems to be nearing the end of this move. If the $157 support level breaks, it would likely indicate a transition from a bullish to a bearish structure on the 4H timeframe. The first target in such a breakdown would be around $154. If the $154 support fails to hold, the second target would be near $149.
Volume currently appears quite low, and the presence of long upper wicks adds further risk. Given the current conditions, Solana looks quite risky, and I do not recommend any trading positions—either buy or sell—at this time.

TradeCityPro | SOL Holds PRZ as Bulls Eye Range Breakout👋 Welcome to TradeCity Pro!
In this analysis, I want to review the SOL coin for you. This is one of the popular Layer1 projects, nicknamed the “Ethereum killer,” with a market cap of $85 billion, currently ranked 6 on CoinMarketCap.
📅 Weekly timeframe
In the weekly timeframe, after the bankruptcy news related to FTX, this coin had a very sharp bearish move and even dropped to as low as 9.84, but it managed to recover afterward.
⭐ From the key top at 27.62, a very strong bullish move started, reaching up to 255.96 and retesting its previous ATH.
📊 Currently, a range box has formed between the 128.66 and 255.96 levels, where the bottom of this box is a very strong PRZ, created from the overlap of a major support zone and the area between the 0.236 and 0.382 Fibonacci levels.
🔍 Also, the price is being supported by the SMA99, which has supported the price twice so far and has prevented the box from breaking to the downside.
⚡️ If you have already bought SOL, you can set your stop-loss if the price closes below this area. A confirmed breakdown could lead to deep corrections toward lower Fibonacci levels.
🛒 For buying this coin, the first trigger is the break of 178.22, which is a bit riskier but offers a good price entry. On the other hand, if the price revisits 128.66 and gives confirmation, we can enter from there.
📈 However, the main trigger for spot entry is the breakout of the 255.96 top. Breaking this level can unlock some very ambitious targets. If that happens, I’ll definitely update the analysis and provide those targets.
📅 Daily timeframe
In this timeframe, we can see the price action in more detail. A small range box has formed between 144.11 and 164.74, and the price is currently stuck below the top of the box and reacting to it.
✨ If 164.74 breaks, we can enter a long position. The next major resistance is 183.54. A breakout above that will serve as the main confirmation for a long position targeting 255.96, which can also be used as a spot trigger.
💥 The RSI oscillator is now above the 50 zone, and if it enters the Overbuy area, it will serve as strong momentum confirmation for this position.
✅ If the price gets rejected from the top, we can also open short positions on lower timeframes. A break below 144.11 will be the main short trigger.
📝 Final Thoughts
This analysis reflects our opinions and is not financial advice.
Share your thoughts in the comments, and don’t forget to share this analysis with your friends! ❤️

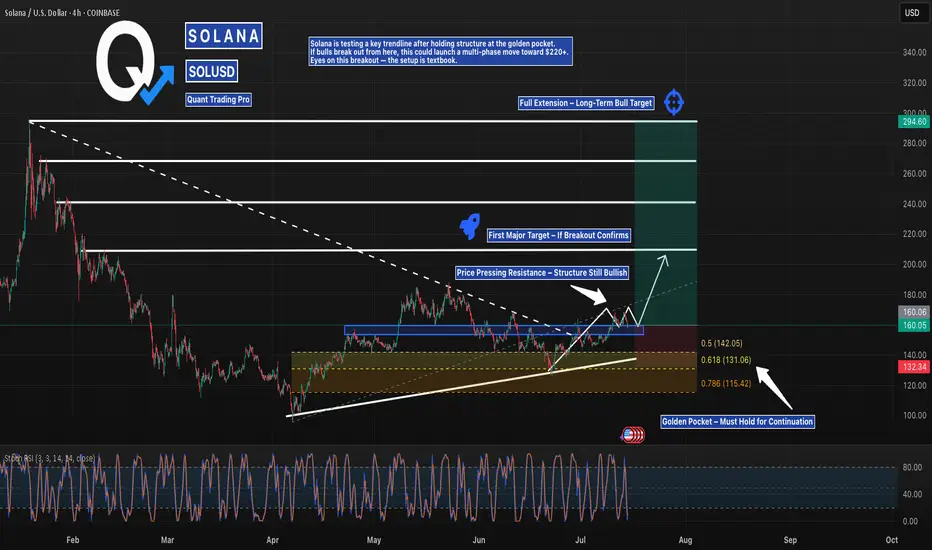
Solana’s Breakout Setup is Loaded — Bullish Structure IntactSolana is pressing into key resistance after holding its higher low structure and climbing out of the golden pocket. With a breakout forming just under the descending trendline, bulls are watching for confirmation to ignite a move toward $220 — and potentially $290+.
Momentum is coiled, and the chart is clean. If price holds above $142, this could be the beginning of a multi-leg run.
#SOLUSD #SolanaBreakout #CryptoTrading #QuantTradingPro #BacktestYourEdge #TradingView #AltcoinSetup
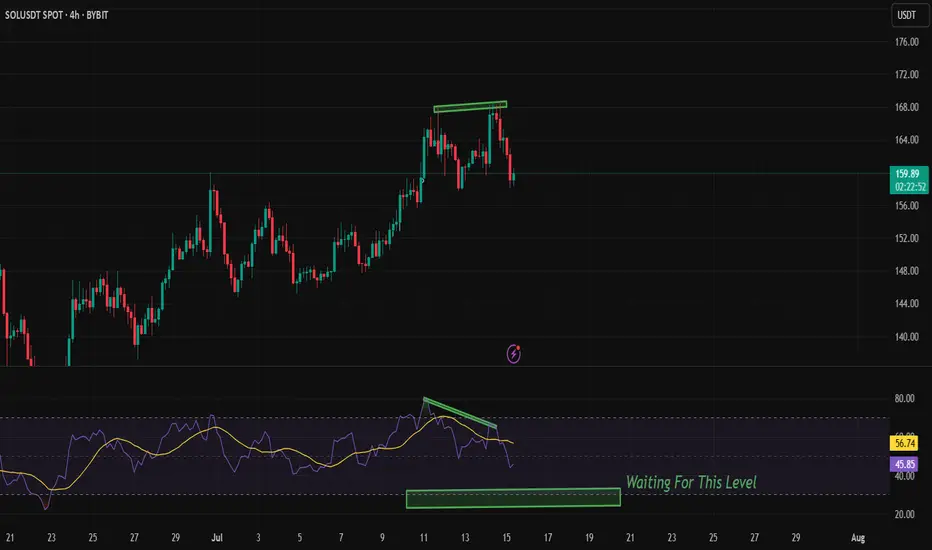
Bearish RSI Divergence on SOLUSDT (4H) – Patience Over FOMO!
🚨 Observing a clear Bearish RSI Divergence on the 4H chart for $BYBIT:SOLUSDT.
While the price made a higher high, the RSI showed a lower high, indicating weakening bullish momentum.
🟣 RSI is now trending down and currently around 46.
💡 I'm waiting for RSI to approach the 30 level (oversold zone) before considering a long entry.
🎯 No rush to buy — I prefer to wait for confirmation and a better risk-reward zone.
📅 Timeframe: 4H
📍 Plan: Waiting for RSI near 30
✅ Staying disciplined and avoiding emotional entries.
🧠 Let the setup come to you. Don’t chase the market.
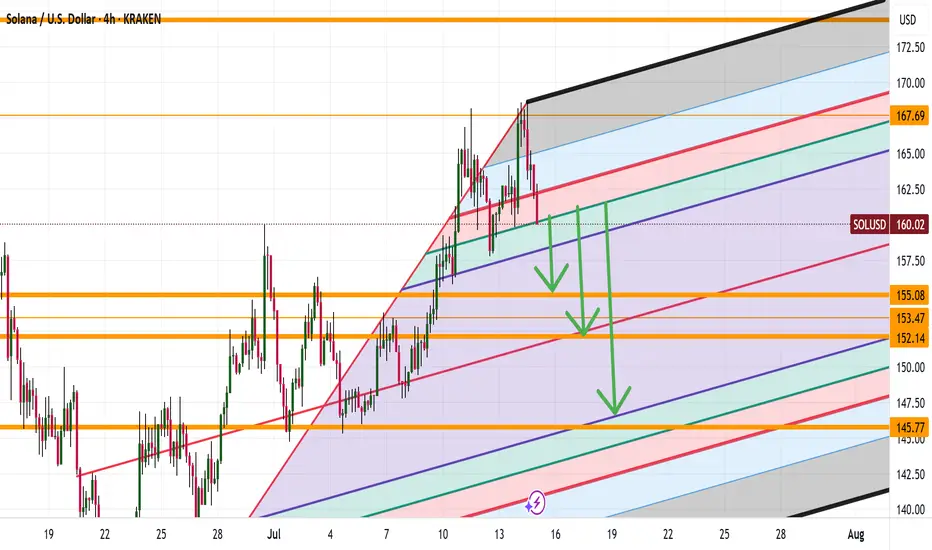
SOL DOWN TO 146 ? Is this possible? Good evening trading family
Based on what we are seeing here is a typical correcting of any good bull mark needed to sustain our movement upwards. Currently we have spotted 3 levels down to the 146 marker with a these of a bullish move upwards if they hold.
Happy trading folks
Kris/ Mindbloome Exchange