BTC/USDT | Bitcoin Going Towards $94K or Will It Fall From Here?By analyzing the CRYPTOCAP:BTC chart on the daily timeframe, we can see that CRYPTOCAP:BTC followed our previous plan perfectly and after holding above the 81K demand zone it climbed back into the 91K area. The bullish structure remains fully intact and momentum is still on the buyers’ side. As long as BTC stays above the 81K to 85K support range I expect the next upside wave to target 94K first and then 97K and 102K in continuation.
Please support me with your likes and comments to motivate me to share more analysis with you and share your opinion about the possible trend of this chart with me !
Best Regards , Arman Shaban
Solana

ETH/USDT | Ethereum Breaks 3000 and Momentum Still Points HigherCRYPTOCAP:ETH pushed all the way to 3000 and the bullish view is still fully intact. From the 2600 rebound to here the move has delivered more than 17 percent already and the structure still supports continuation. As long as ETH holds above the 2500 to 2700 demand zone the upside targets remain 3200, 3500, and 4000 in the next major leg. On the supply side the important zones sit at 3200 to 3300 and then 3500 to 3600 where price may slow down before the next breakout. For now momentum belongs to buyers.
Please support me with your likes and comments to motivate me to share more analysis with you and share your opinion about the possible trend of this chart with me !
Best Regards , Arman Shaban

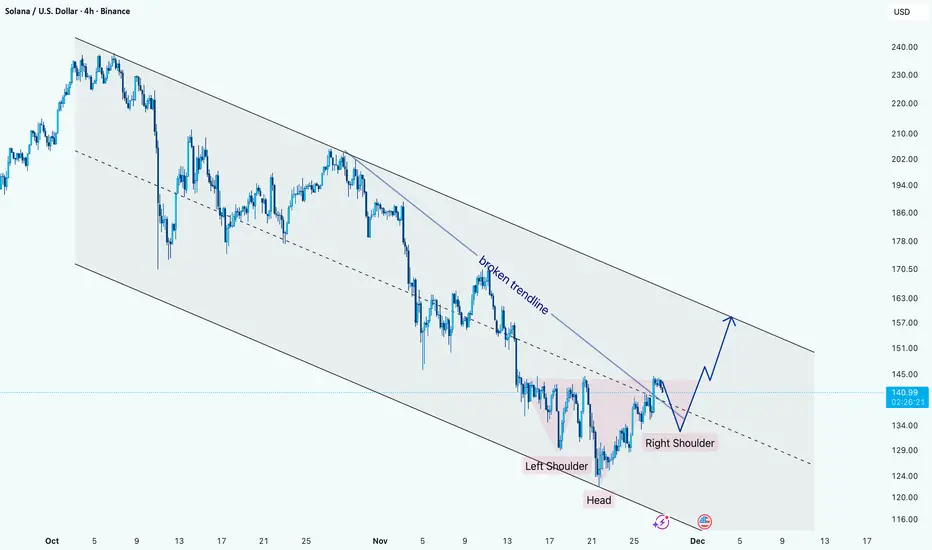
SOL Reversal Structure Forming Inside Downtrend ChannelHi!
Solana is trading inside a well-defined descending channel, but momentum is shifting. Price has broken the inner descending trendline and is now forming a clear inverse Head & Shoulders at the bottom of the structure.
The neckline zone has been tested multiple times, showing growing buyer strength. As long as price holds above the right-shoulder support, the structure favors a bullish continuation.
A breakout above the neckline opens the way toward the upper boundary of the main descending channel, with the next key reaction zone near $155–160. Failure to hold the right shoulder would delay the reversal and pull the price back toward mid-channel support.
Sol continues to hold up strongCRYPTOCAP:SOL is holding up well with only a shallow retracement to the 0.382 for wave (4)- the weekly 200EMA.
Price is above the weekly 200EMA, which is bullish, but lost the pivot, which is bearish, giving the overall pattern ambiguity. Wave C is underway, but looks near completion at wave 4’s expected Fib targets.
🎯 Terminal target for the business cycle could see prices as high as $660 based on weekly pivots
📈 Weekly RSI is bearish with room to fall, but doesn’t often reach oversold.
👉 Analysis is invalidated if we close back below $50, as wave 4 can not go below the 0.5 Fib.
Safe trading

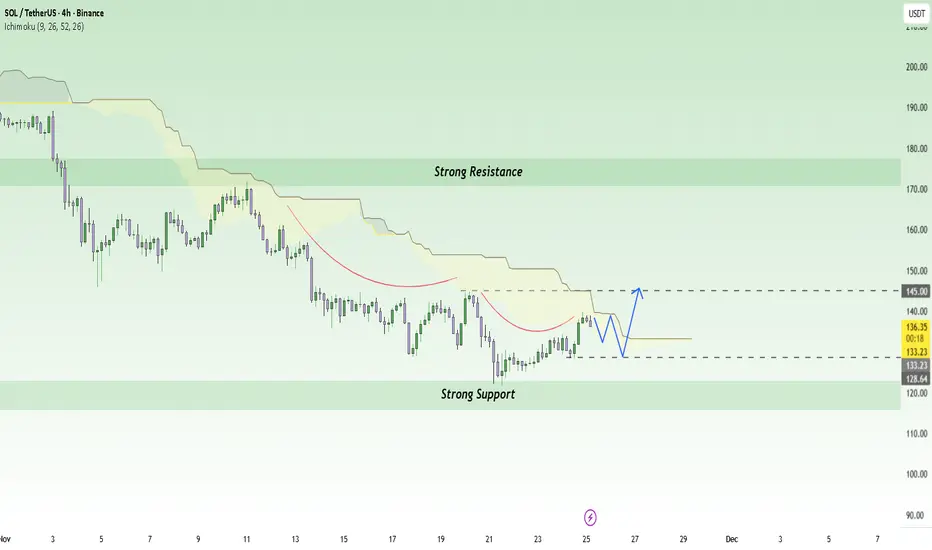
SOL/USDT: Growth Fueled by Inflows and Network ExpansionNews: The Solana spot ETF in the U.S. has seen a significant inflow of capital , with over $476 million USD coming in over 17 consecutive days. At the same time, the Solana network has reported strong revenue growth , reaching around $2.85 billion USD . These factors have bolstered investor confidence in Solana, creating a favorable environment for the upward trend of SOL/USDT.
Chart: On the H4 chart, SOL/USDT is currently trading within a strong uptrend channel , supported by the Ichimoku cloud at 133.23 USD. The price is in the support zone around 128 USD, and there is potential for a strong rebound if it continues to hold above this level. If SOL/USDT maintains this trend, the next target could be 145 USD, where there is strong resistance in the short term.
Outlook: With positive macro factors and a clear technical structure , SOL/USDT could continue its strong uptrend, aiming for the 145 USD resistance level in the near future, as long as the price stays above 128 USD.
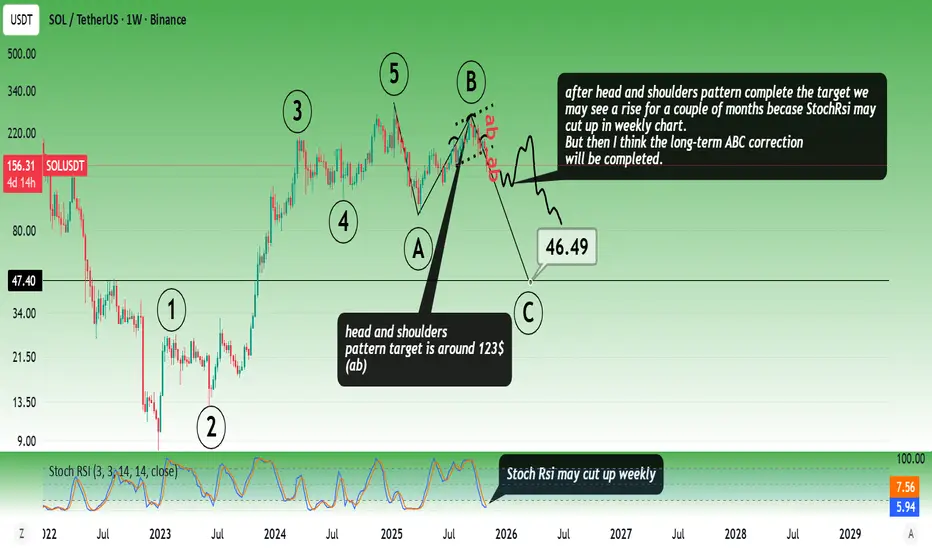
Solana RoadmapAfter the head and shoulders pattern complete the target we
may see a rise for a couple of months becase StochRsi may cut up in weekly chart.
But then I think the long-term ABC correction will be completed.
* The purpose of my graphic drawings is purely educational.
* What i write here is not an investment advice. Please do your own research before investing in any asset.
* Never take my personal opinions as investment advice, you may lose your money.
Solana hitting range lows. SOL price has pulled back into a major high-volume demand zone that supported every major rally in 2023–2024. The bearish divergence at the top played out cleanly, and now SOL is sitting on the first real test of this macro block.
Momentum indicators are resetting at historical reversal levels and showing early signs of a shift. As long as SOL holds the upper side of this demand zone, this remains an accumulation area, not a breakdown.
A bounce here sets up a mid-range reversal. A break below the liquidity shelf opens the door to the deeper demand block.
Watching for:
Higher low + momentum flip = bullish confirmation.

Is it in a bear market?Its hard to buy for a long term in this condition. Short term, it may bounce towards 100k. If it fails to cross 100k and falls back, then the next stop is 50-55k. May buy then !!
happy trading !! not financial advice.

SOL to Bottom Out Around $103-104SOLANA – Eyes on the Final Flush? 🔥 Key Confluence at $103–$104
Solana is approaching what might be the most important support zone of this entire macro structure. Several major technical factors are all pointing to the same potential bottom area:
🟢 1. Head & Shoulders Breakdown Target
The measured move from the H&S pattern puts the projected downside right into the $103–$104 zone, creating a textbook target alignment.
🟠 2. Long-Term Trendline Support (Orange)
Price is now dropping toward a multi-year rising trendline that has held since early 2024.
This line has acted as major dynamic support across multiple cycles, and SOL is now coming back to retest it.
🟣 3. Fibonacci 0.886 Retracement
The 0.886 retrace of the full macro move lands perfectly in the same area.
This fib level is often where deep retracements reverse during strong bullish expansions.
📉 Current Structure
– Breakdown from right shoulder confirmed
– Momentum still down, but seller exhaustion showing up
– Volume declining on the drop → typical late-stage correction behavior
📌 Key Zone to Watch
$103–$104 (Green Box)
This is my “high-probability reaction zone” where I expect Solana to bottom or at least produce a significant bounce.

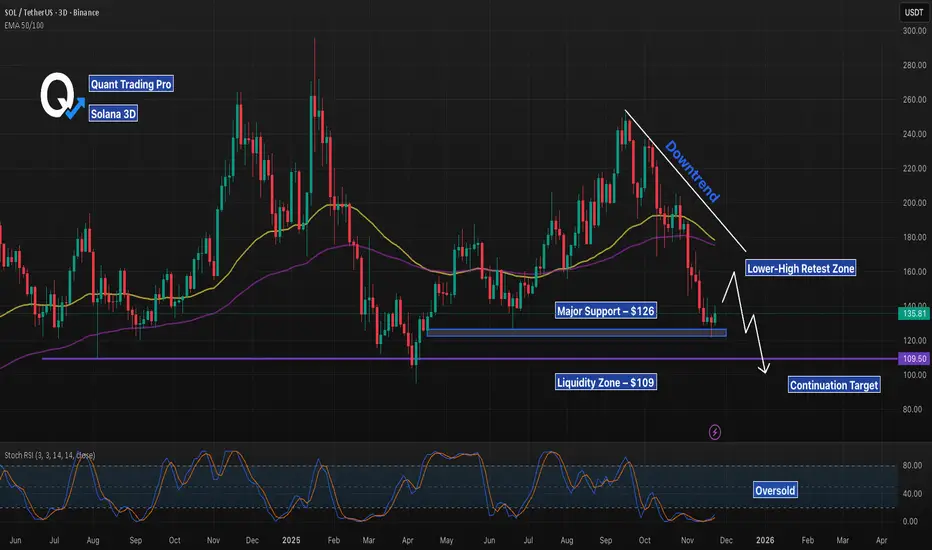
SOL 3D – Retesting Trendline, But Will Support Break Next?SOL remains in a clear daily downtrend, with price consistently setting lower highs beneath the descending trendline. Price is now pulling back into a potential lower-high retest zone, directly aligned with the confluence of the 50/100 EMAs overhead. Unless SOL can reclaim this trendline with a strong daily close, this setup favors continuation lower.
The first major area of interest is the $126 support, which has acted as a key reaction level across multiple months. A clean break of this level opens the door toward the lower $109 liquidity zone, which historically attracts deep wicks and stop-hunts before reversal attempts.
Stoch RSI remains in the oversold region, but without a confirmed bullish cross or momentum shift. Trend structure takes priority unless buyers reclaim the trendline and break the sequence of lower highs.
Watching for:
• Reaction at the trendline retest
• Daily close above or below $126
• Liquidity sweep toward $109 for potential reversal setups
Retrace in Solana UnderwayWe're getting very close to confirming a minor wave bottom that should get price into the target box. Afterwards, I look for a new local low in 2026 towards the $70 level. That should be bought like Crypto is going out of style.

SOL Short 1D Rebalancing the bearish inefficiency is likely to lead to further development of the downward movement.

SOL long-term TASolana is in heavy distribution, currently the weekly downtrend is engaged, it needs more time to bottom out, there's a good support at this area of $130ish and if it's broken we can see the lows of $100ish again.

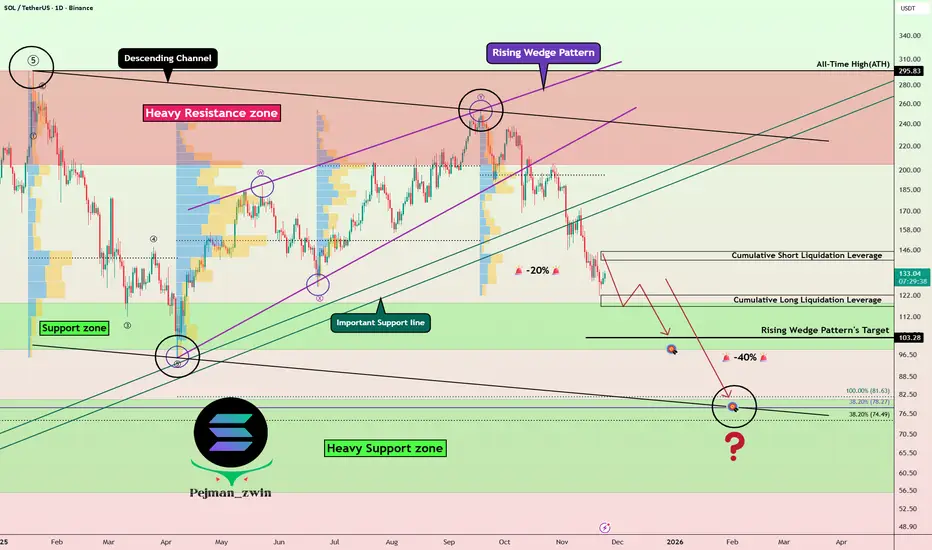
Solana Breakdown Roadmap—Is the Correction Just Getting Started?Today, I analyze the Solana( BINANCE:SOLUSDT ) project and explore its roadmap for the coming days and weeks, so stay tuned!
Solana, with the help of the Rising Wedge Pattern, has successfully broken through its important support lines and is currently moving near the Support zone($118-$98).
From an Elliott Wave perspective, it seems that Solana has completed its five main waves and is now in a corrective phase.
Given the current cryptocurrency market conditions, I expect Solana to break through the Support zone($118-$98) and at least reach the target of the rising wedge pattern, potentially dropping down to $80.
Additionally, it’s worth noting that the SOLBTC( BINANCE:SOLBTC ) pair is also showing a bearish trend, which means that if the broader crypto market declines, Solana could face even greater losses.
First Target: $107
Second Target: $83
Stop Los(SL): $174
Cumulative Long Liquidation Leverage: $122-$119
Cumulative Short Liquidation Leverage: $150-$145
💡 Please respect each other's opinions and express agreement or disagreement politely.
📌Solana Analyze (SOLUSDT), Daily time frame.
🛑 Always set a Stop Loss(SL) for every position you open.
✅ This is just my idea; I’d love to see your thoughts too!
🔥 If you find it helpful, please BOOST this post and share it with your friends.
SOL looks weak, lower in wave C?Price continues lower, a textbook ABC correction so far.
Wave B ended shy of all-time high. Price lost the daily 200EMA and is testing the major High Volume Node support. The probability is a continuation to the downside.
📈 Daily RSI reached oversold with no divergence
👉 Continued downside brings up the $112 target
Safe trading

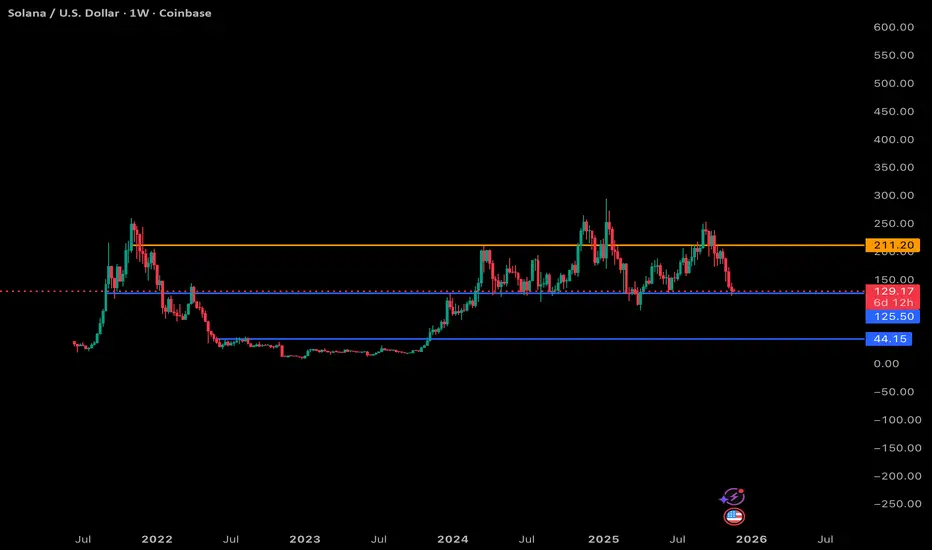
SOL 1W Breakdown: Key Levels, What I’m Watching Next Nov 24 2025Here’s my read on Solana’s weekly chart using the same structure as the BTC and ETH analyses.
Blue = support, orange = resistance, and the dotted mid-range is acting like a pivot zone.
Support Levels (Blue)
$125.50: This is the line SOL is sitting right on top of right now. It’s been a key mid-range level for almost two years. Losing this on the weekly would be a clear bearish signal because there isn’t much structural support underneath until the next major zone.
$44.15: This is the big, deep support from the 2022–2023 accumulation base. I’m not calling for this immediately, but structurally there’s a lot of empty space between $125 and $44. If the macro rolls over and SOL can’t defend the mid-range, we could see a slow bleed or capitulation wick toward this zone.
Resistance (Orange)
$211: This is the major weekly resistance for SOL and has been the top of every rally since 2022. Until SOL can close above this level and hold it, any upside is still just range movement.
My Current Thoughts
SOL is in a tricky spot. We’re sitting right on that $125ish support, and this is basically the “bounce here or things get uncomfortable fast” level.
If we don’t get a bounce:
The chart opens up a pretty big air pocket down to the next structural support.
Weekly structure turns decisively bearish.
SOL likely enters a multi-month corrective phase similar to what it did in 2022/2023 (but obviously not the same magnitude).
If we do bounce:
SOL can chop around this mid-range again, possibly retesting $150–175.
But it still needs a clean reclaim of $211 to resume a real macro uptrend.
Overall View
SOL’s weekly chart is way less forgiving than BTC or ETH right now. The range is clear, but we’re testing the bottom of it, and losing this level puts a lot of downside in play. From a structural standpoint, this is the most important support SOL has tested in a long time. If it holds, cool, if it breaks, we probably enter a much deeper reset.
Slow grind or big drop, the next weekly close is going to be telling.
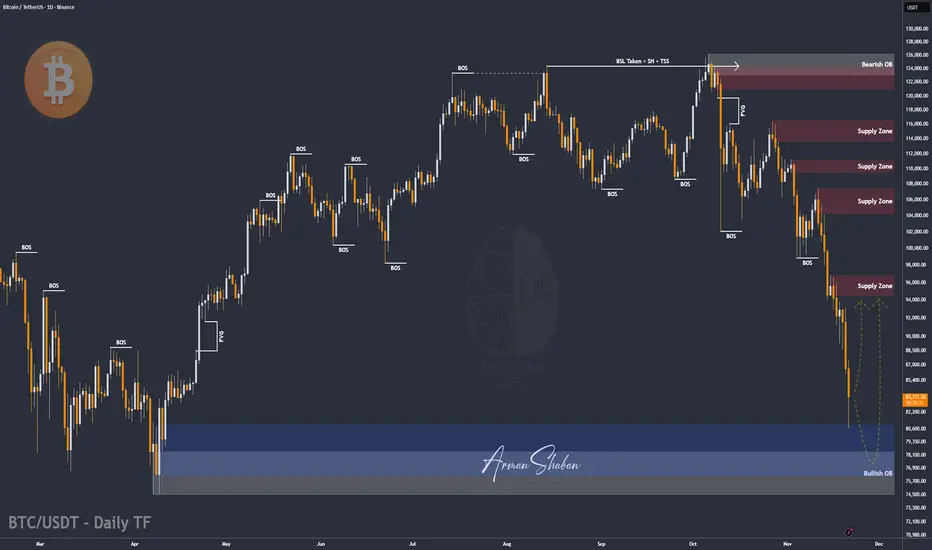
BTC/USDT | Bitcoin Hit Major Demand, What’s Next?By analyzing the #Bitcoin chart on the daily timeframe, we can see that the price dropped exactly as expected and fell sharply to $80,500. Once it reached this major demand zone, buyers stepped in and Bitcoin bounced back to around $83,900.
As long as BTC can hold above the large demand zone between $74,000 and $81,000, we can expect the next bullish wave to start.
From my perspective, the trend is not bearish! this is still a healthy correction.
From the ATH at $126,200, Bitcoin has corrected 36%, which is completely normal in strong uptrends. Now it’s time to watch for decreasing selling pressure and the beginning of a stronger upside move. This analysis will be updated soon.
Please support me with your likes and comments to motivate me to share more analysis with you and share your opinion about the possible trend of this chart with me !
Best Regards , Arman Shaban
Solana is forming a bullish flagSOL has formed a bullish flag, with movement in a local uptrend being established. The high in the purple areas is highly likely to be broken
Two 4H imbalances are located above. This is where sellers are most likely to react

SOLUSDT: Liquidity Tightens – Every Pullback Drops Even Deeper!When talking about Solana right now, the clearest feeling is that the market is losing strength day by day . Recent news shows that SOL has dropped sharply in November, and large capital keeps exiting the market — turning every bounce into an excuse for holders to sell rather than a sign of reversal.
On the H4 chart, SOL is trapped inside a descending wedge , repeatedly rejected by the Ichimoku cloud — an area that has consistently blocked every recovery attempt. Each previous bounce has only led to an even stronger downward leg.
The $130 level is the nearest immediate resistance and also aligns with the descending trendline. If price pulls back to this zone, there is a high probability of fresh selling pressure emerging. When that happens, SOL could continue dropping toward the psychological support at $100 — the key target in the current bearish outlook.
In summary, with both negative news and a weak technical structure, the most reasonable strategy now is to follow the downtrend , wait for price to pull back into resistance to find cleaner entries, and avoid catching bottoms when the market shows no clear reversal signals.

Solana: Room for moreSOL recently dipped further into the now green Target Zone between $155.80 and $113.20. Within this area, we expect the low of wave ii in orange to be established imminently. Afterward, we anticipate a strong wave iii rally, which should peak above resistance at $295.31.

Solana (CRYPTO: $SOL) ETFs Surge as Price Tests Major SupportSolana (CRYPTO: CRYPTOCAP:SOL ) trades at $127.45 after a sharp 31% decline over the past month, but institutional activity is telling a different story. While retail sentiment weakens, capital continues flowing into newly launched Solana ETFs—creating one of the clearest divergences in the crypto market heading into late 2025.
Six U.S. spot Solana ETFs are now live, with issuers including 21Shares, Fidelity, VanEck, Canary Capital, Bitwise, and Grayscale. Fidelity’s FSOL on NYSE Arca quickly captured attention thanks to its staking component, making it the largest traditional asset manager offering staked SOL exposure. 21Shares also added competitive pressure by launching its ETF with a 0.21% fee after securing Cboe approval.
Combined ETF holdings now exceed $2 billion, and the inflows haven’t slowed—Solana ETFs recorded $26.2 million in net inflows on November 18, marking the 15th consecutive positive day. Remarkably, these inflows outpaced those of Bitcoin and Ethereum for the week. When institutions accumulate during market selloffs, it often reflects long-term conviction in underlying fundamentals such as Solana’s high throughput, low transaction costs, and increasingly mature ecosystem.
Technicals
Despite the correction, SOL is testing a major ascending-trendline support that has been respected several times. Price recently dipped into liquidity near $127, a level that has previously marked swing turns.
If support holds, the bullish continuation scenario comes into focus. The first target stands at $253, followed by $295. A breakout above both levels would strongly support new all-time highs heading into 2026.
If support fails decisively, the next demand zone lies between $110 and $100. A breakdown of that zone increases the probability of a deeper move toward $80. For now, buyers continue defending trend support, keeping the broader structure intact.

SOL - Time for a pullback SOL - Time for a pullback
Before we take a new short we need a pullback and range
only after we can take a new short trade
Key resistance 171

SOLUSD; Heikin Ashi Trade Idea📈 Hey Traders!
Here’s a fresh outlook from my trading desk. If you’ve been following me for a while, you already know my approach:
🧩 I trade Supply & Demand zones using Heikin Ashi chart on the 4H timeframe.
🧠 I keep it mechanical and clean — no messy charts, no guessing games.
❌ No trendlines, no fixed sessions, no patterns, no indicator overload.
❌ No overanalyzing market structure or imbalances.
❌ No scalping, and no need to be glued to the screen.
✅ I trade exclusively with limit orders, so it’s more of a set-and-forget style.
✅ This means more freedom, less screen time, and a focus on quality setups.
✅ Just a simplified, structured plan and a calm mindset.
💬 Let’s Talk:
💡Do you trade supply & demand too ?
💡What’s your go-to timeframe ?
💡Ever tried Heikin Ashi ?
📩 Got questions about my strategy or setup? Drop them below — ask me anything, I’m here to share.
Let’s grow together and keep it simple. 👊
