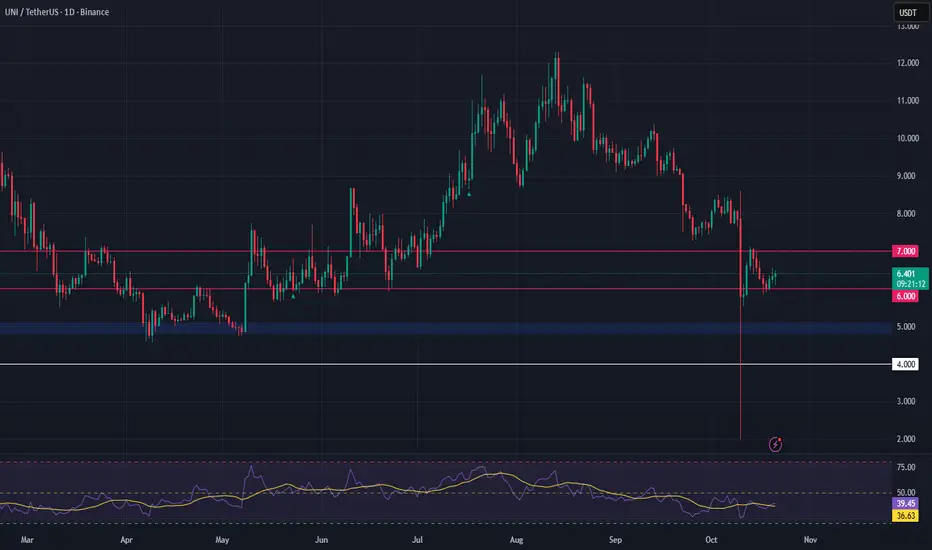
UNI/USDT – Bullish Setup as Uniswap Expands Cross-Chain AccessUniswap just integrated Solana into its Web App, enabling swaps across Ethereum and 13+ other networks. This move significantly expands Uniswap’s ecosystem and could drive a surge in DEX volumes, adding fundamental strength to UNI.
Technically, UNI is trading near a key accumulation zone between $4.80–$5.10. A sustained hold within this range offers a potential long opportunity, especially as momentum picks up with this major protocol update.
🔹 Entry Zone: $4.80–$5.10
🔹 Targets: $6.00, $7.09
🔹 Stop Loss: Below $4.00
Solana
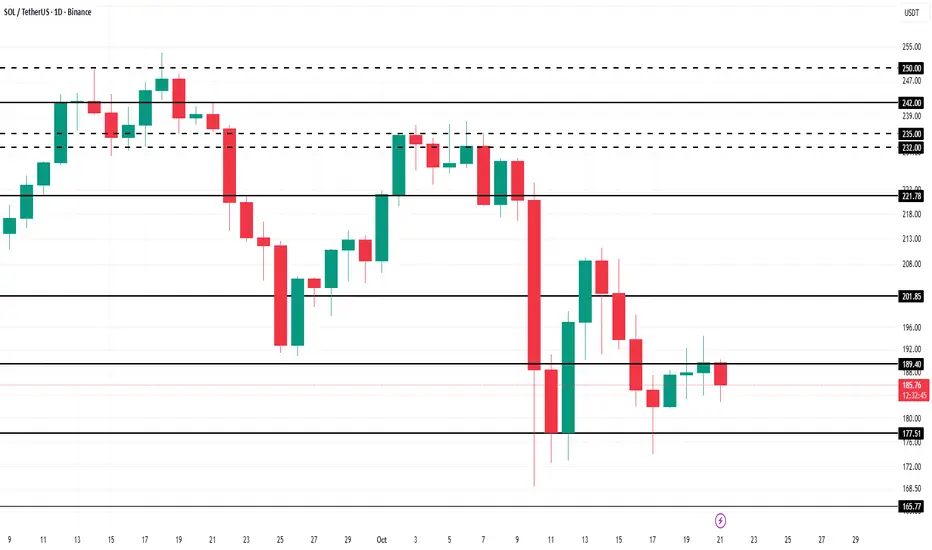
Solana Price May Have A Shot At $250, But Caution AdvisedAt the time of writing, Solana’s price stands at $184, holding above the crucial $183 support. The altcoin appears to be forming a flag pattern, a technical setup often associated with bullish breakouts. However, confirmation will depend on volume strength and investor conviction.
Following the recent crash, SOL briefly dropped out of this pattern before testing and validating it again. For a clear breakout, Solana needs to bounce off the lower trendline or move past $192. Failure to sustain buying pressure could drive the token below $175, potentially falling to $163, invalidating the bullish pattern.
Conversely, if Solana breaches $192, it could surpass $200, a key psychological barrier. Breaking out from the pattern could ignite renewed momentum, setting the stage for a potential surge toward $250. Nevertheless, investors and traders should proceed with caution given the current market fragility.
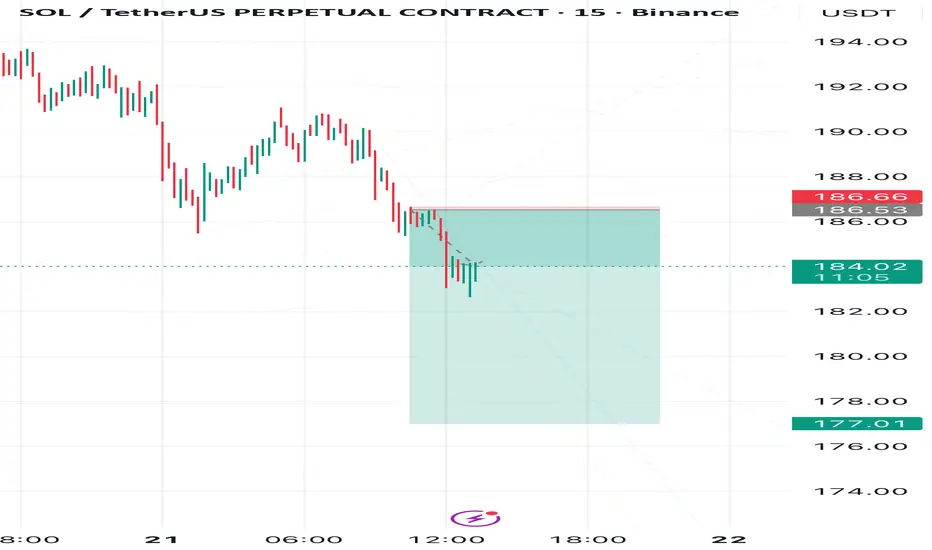
Solana Drop DramaSolana has started its decline as expected. I am now targeting a drop to 177
On the chart, I marked the plan cancellation zone—if price breaks this area, the scenario becomes invalid.
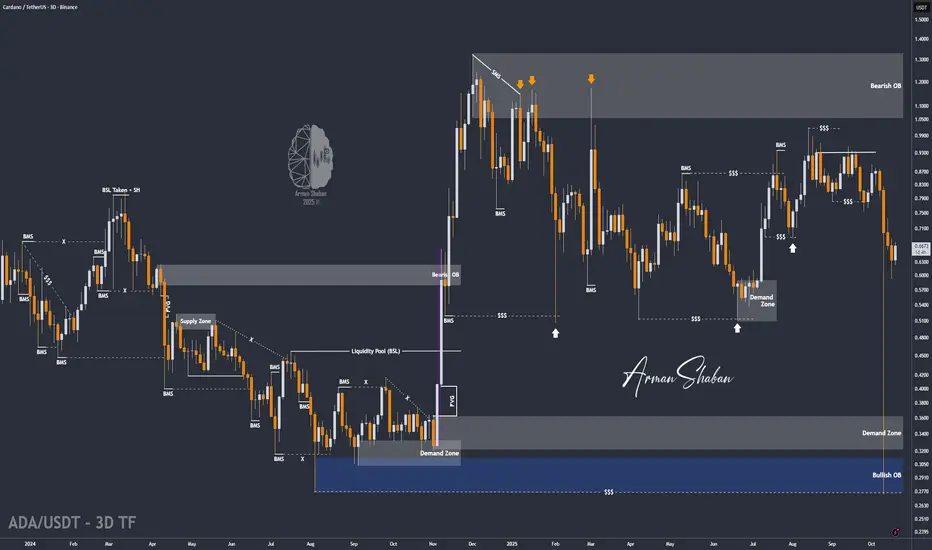
ADA/USDT | Demand Zone Holds, Bulls Gaining MomentumBy analyzing the #Cardano chart on the 3-day timeframe, we can see that after dropping to around $0.59 , ADA once again reacted strongly to demand, rebounding to the $0.66 area. This confirms that buyers are still defending lower levels and that the $0.58–$0.63 zone remains a key support range.
The overall structure is still bullish within accumulation, and this latest bounce could mark the beginning of a gradual recovery phase. As long as ADA holds above $0.63 , the next upside targets remain $0.75, $0.85, and $1.00 — with momentum likely to build if Bitcoin maintains stability above $112K .
This recovery reinforces the idea that ADA is quietly preparing for its next major move upward after weeks of consolidation.
Please support me with your likes and comments to motivate me to share more analysis with you and share your opinion about the possible trend of this chart with me !
Best Regards , Arman Shaban
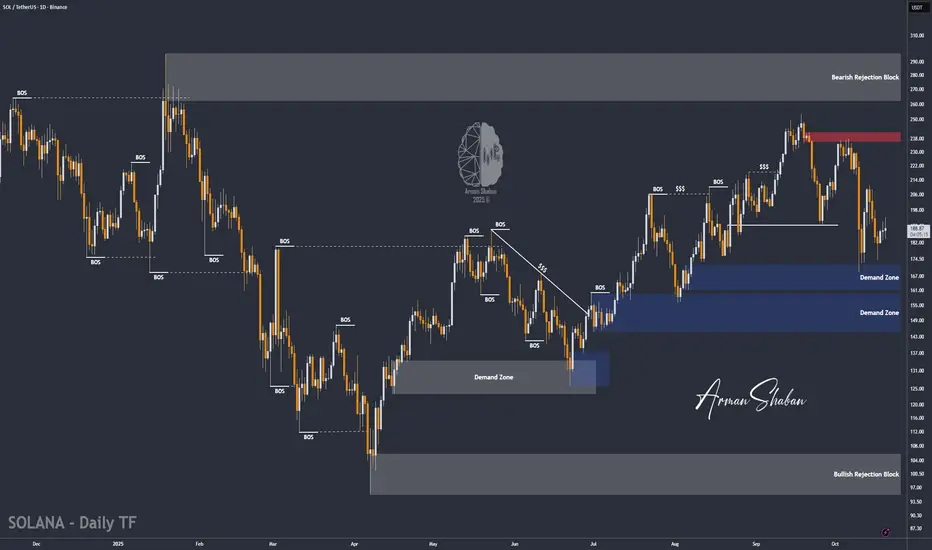
SOL/USDT | SOL Update – Recovering After Volatile Swings!By analyzing the #Solana (SOL) chart on the daily timeframe, we can see that after a sharp drop to around $169, SOL quickly rebounded to $211, then faced another correction back to $174. Since holding steady above $170, the price has regained momentum and is now trading near $190, showing signs of renewed strength.
If SOL manages to maintain stability above the $170–$175 zone, the bullish structure remains intact. The next upside targets are $211, $216, $238, and $254 , where short-term reactions may occur before further continuation.
The overall outlook remains bullish , but you should watch closely to see if SOL can sustain its momentum above current levels — this could be the start of a new leg higher.
Please support me with your likes and comments to motivate me to share more analysis with you and share your opinion about the possible trend of this chart with me !
Best Regards , Arman Shaban
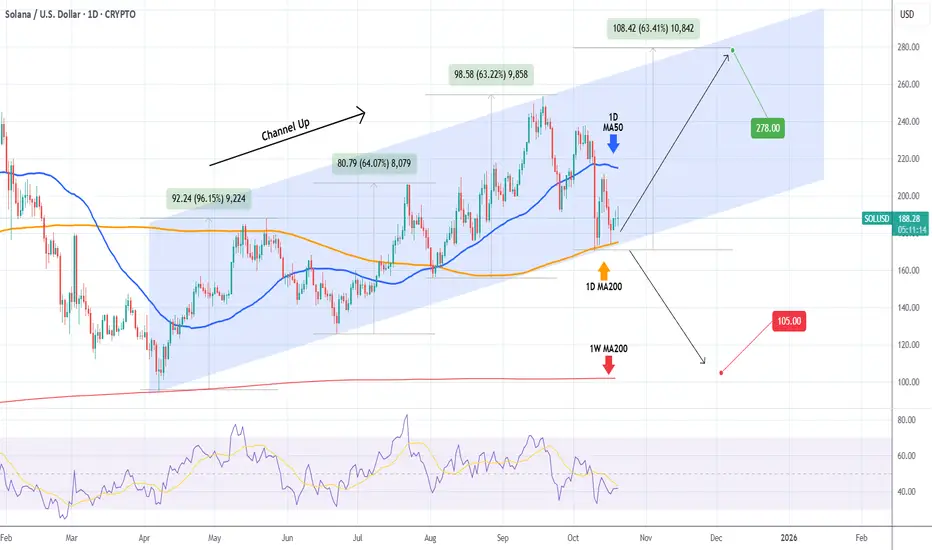
SOLANA 1D MA200 is the only level holding it from falling apart.Solana (SOLUSD) has been trading within a very structured Channel Up pattern since the April 07 bottom, which was priced exactly on its 1W MA200 (red trend-line). The recent pull-back though (Bearish Leg) has got the market testing another key Support level, the 1D MA200 (orange trend-line).
So far this has held on 4 successive tests, technically pricing a new Higher Low on the bottom of the Channel Up. This is what separates the start of the new Bullish Leg towards at least $278.00 (representing a +63.00% rise, the minimum rally so far inside this pattern) from a complete collapse to $105.00 and the 1W MA200. SOL needs to keep closing its 1D candles above the 1D MA200 to maintain the bullish trend.
-------------------------------------------------------------------------------
** Please LIKE 👍, FOLLOW ✅, SHARE 🙌 and COMMENT ✍ if you enjoy this idea! Also share your ideas and charts in the comments section below! This is best way to keep it relevant, support us, keep the content here free and allow the idea to reach as many people as possible. **
-------------------------------------------------------------------------------
💸💸💸💸💸💸
👇 👇 👇 👇 👇 👇
Solana’s Next Move Depends on $160 Support ZoneHello guys!
Solana is currently stuck between the Decision Point (DP) zone and the Weekly Support area, showing hesitation in market direction.
However, the recent breakdown of the ascending trendline signals a potential shift in momentum from bullish to bearish. The price now appears to be heading toward the purple demand zone around $172–$160, which acts as an important short-term support area.
If the $160 level fails to hold and we see a confirmed breakdown below it, Solana could continue its decline toward the weekly support zone near $120–$130. On the other hand, if buyers defend the purple area strongly, we might see a temporary rebound before any further downside move.

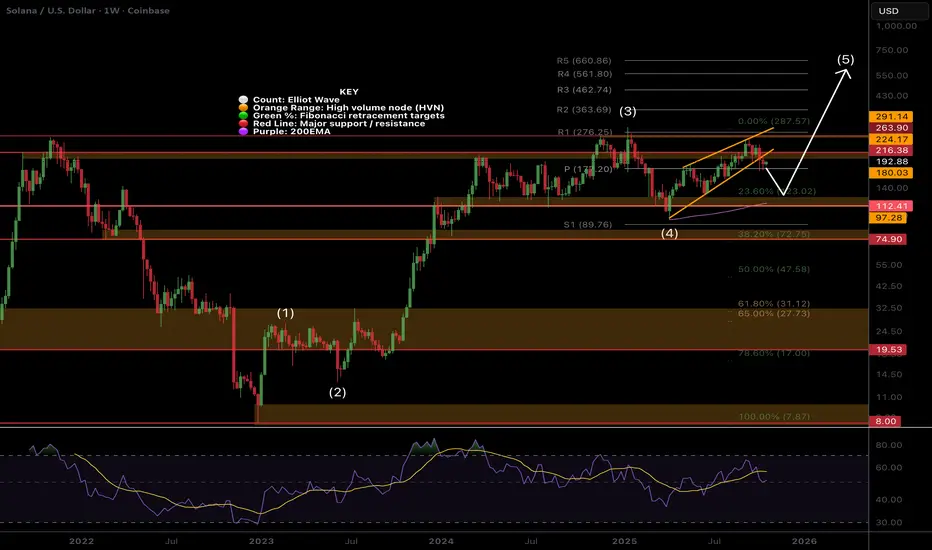
SOL Waiting at the weekly pivot...CRYPTOCAP:SOL has fallen out of the wedge, an interior wave 5 completion structure, which suggests we should see a broader sell off to the next High Volume Node in interior wave 2, $120. It is concerning no new high was made and backs up a deeper correction. This would also meet the ascending the weekly 200EMA.
Weekly RSi is crossed bearish but price remains above the weekly pivot and EMA which is bullish. Direction is ambiguous for now. A push back into the wedge would flip the outlook bullish.
Wave 5 target remains $600 at the R5 weekly pivot.
Safe trading
Be careful with SOLANA !!!It can be said that the price has broken out of this triangle and may experience a solid upward move. However, before the rally, it will likely liquidate long positions once.

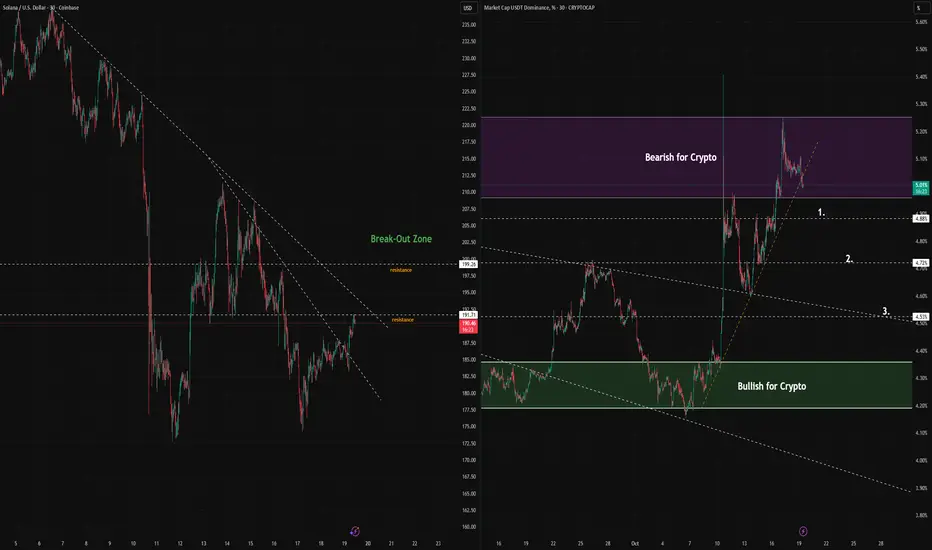
Solana: Key Levels to WatchSolana has been in a downward trend since October 6th, but we are seeing some hints at a reversal. This is not yet confirmed, and weekend price action tends to be a poor indicator of the week ahead. This chart tries to plot the key levels that SOL/USD needs to break through in order to show strong bullish momentum going into the end of October.
The levels to watch are $192, as the first resistance. And if Solana can break above that, it needs to smash through the $200 level. If that were to play out, keep in mind that $205 has frequently been a key support/resistance level as well. A break above $200 may stall at the $205 level for a while, and bulls will need to see it stay above $200.
The USDT.D chart is an important indicator of the allocation of capital into, or out of crypto. Traders should watch for a drop in USDT dominance to confirm that there is ample liquidity to maintain a Solana rally. The key levels to watch for is a USDT.D break below 4.88% (1), 4.72% (2), and 4.53% (3). With each break of these support levels, we should see bullish momentum in the broader crypto market, which could translate into a Solana rally.
Keep in mind that Solana, while hinting at a run for $192 this morning, could find strong resistance there. Whatever plays out today, its still a weekend, which means you should look for further confirmation into the trading week ahead. Aggressive traders may want to take positions here before SOL breaks these key levels, but this carries considerable risk that the downward trend line continues to be resistance. If that proves to be the case, watch for the next support to be around $175.
$BONK: time to refill our bagsI believe we’re heading toward a new all-time high for Bitcoin (BTC).
Both CRYPTOCAP:OTHERS and CRYPTOCAP:TOTAL3 are showing strong bullish momentum, entering extremely oversold territory — a signal often preceding a major recovery.
November is also a historically bullish month for altcoins, which strengthens the case for an upcoming rally.
The probability of a +100% uptrend is very high.
The head and shoulders pattern was invalidated by the October 11th event, which completely shifted the market structure.
In my view, this is the perfect time to take positions and patiently wait for the market reset to play out.
🎯 Take-Profit Targets (based on Fibonacci levels):
TP1: $0.00001865
TP2: $0.00002145
TP3: $0.00002600
TP4: $0.00003220
Historically, when SEED_DONKEYDAN_MARKET_CAP:BONK starts pumping, it almost always reaches around $0.00003200 — and if that happens, we could see a parabolic move up to $0.00005000, marking the top of the altseason.
DYOR (Do Your Own Research).
#BTC #BONK #Altseason #CryptoMarket #Bullish #TradingSetup #Fibonacci #CryptoAnalysis #NovemberRally

ADA/USDT | ADA’s Epic Comeback: 130% Pump After Brutal Selloff!By analyzing the Cardano (ADA) chart on the 3-day timeframe, we can see that, like the rest of the market — or even more severely — ADA faced a massive dump of over 65%, dropping below $0.275.
After a liquidity grab under that level, strong buying pressure emerged, driving the price up by 130%, reaching around $0.63. However, ADA still needs to rise about 30% more just to return to the level where this drop originally began.
This cryptocurrency remains highly promising, and if Bitcoin stabilizes above $110,000, we could expect the next bullish wave to begin for Cardano.
Please support me with your likes and comments to motivate me to share more analysis with you and share your opinion about the possible trend of this chart with me !
Best Regards , Arman Shaban

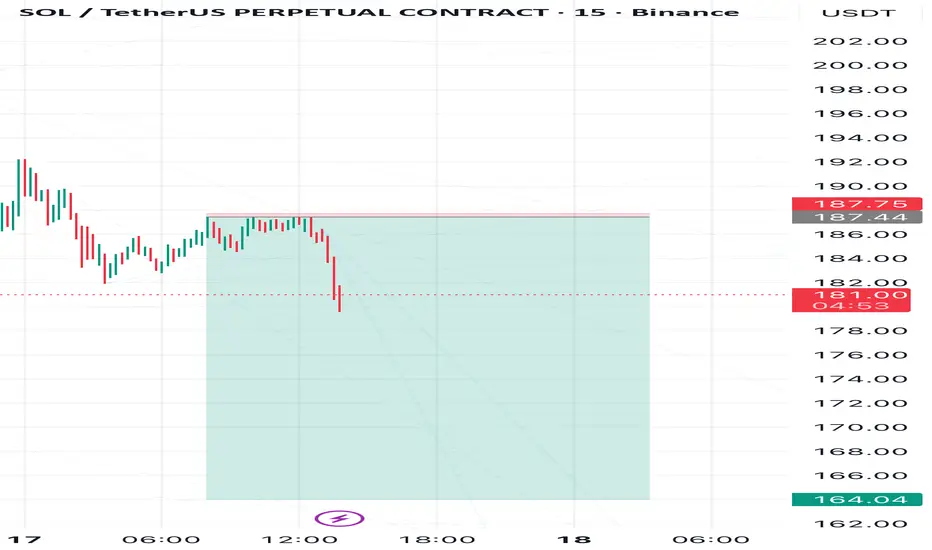
SOL Bears Still in Control — Eyes on 164Solana has repeatedly confirmed its plans to move lower toward the 164 level.
The 187.4 level is a particularly strong support, so a breakout above it would mean the plan is invalidated.
Follow me for consistent technical analysis on Solana
Solana Ready for Bullish ContinuationSolana demonstrates a constructive market posture with evidence of renewed accumulation following its recent corrective phase.Price activity indicates that buying momentum is gradually strengthening as liquidity continues to shift from weak hands into strategic positioning.The market structure shows improving stability,with compression patterns hinting at an impending expansion cycle.Sustained absorption near recent lows underscores growing institutional participation,reinforcing the probability of continued upward repricing.Trading volume remains consistent,reflecting controlled demand rather than speculative inflow.The overall market tone supports a constructive bias,with expectations aligning toward a progressive recovery phase and potential continuation of the broader bullish trajectory.

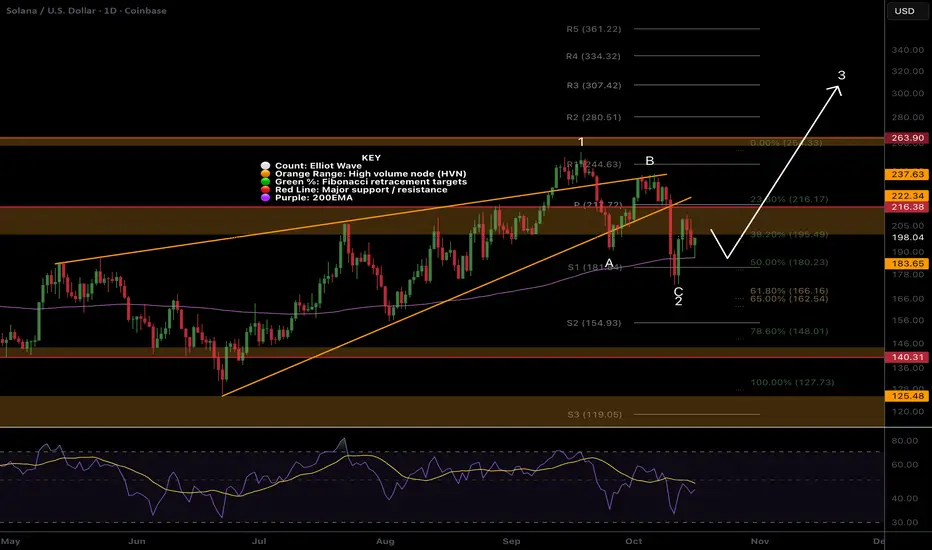
$SOL at major resistance, bottom is in?CRYPTOCAP:SOL bottom appears to have printed a text book ABC correction for wave 2 ending with a swing below the daily 200EMA and S1 pivot, front running the Fibonacci golden pocket.
However, Solana is at major resistance now and being rejected. RSI did not have bullish divergence or reach oversold so traders should be cautious.
Its holding up much better than most alt coins after Friday...
A bottom may be found at daily 200EMA and wave 3 may begin...
Safe trading
Solana Fails To Hold Above $200 Amid $500 Million SOL SellingSolana’s price currently stands at $192, holding just above a key support level at the same mark. The altcoin recently dipped after failing to secure a foothold above $200, but resilience at this level remains a positive sign.
Given the current on-chain dynamics, SOL may soon reverse its recent losses. A successful breakout above $200 and $205 could pave the way toward $213, signaling renewed bullish momentum.
However, if selling continues to dominate and confidence remains weak, Solana’s price could fall to $183. Such a decline would invalidate the bullish outlook and deepen the short-term downtrend.

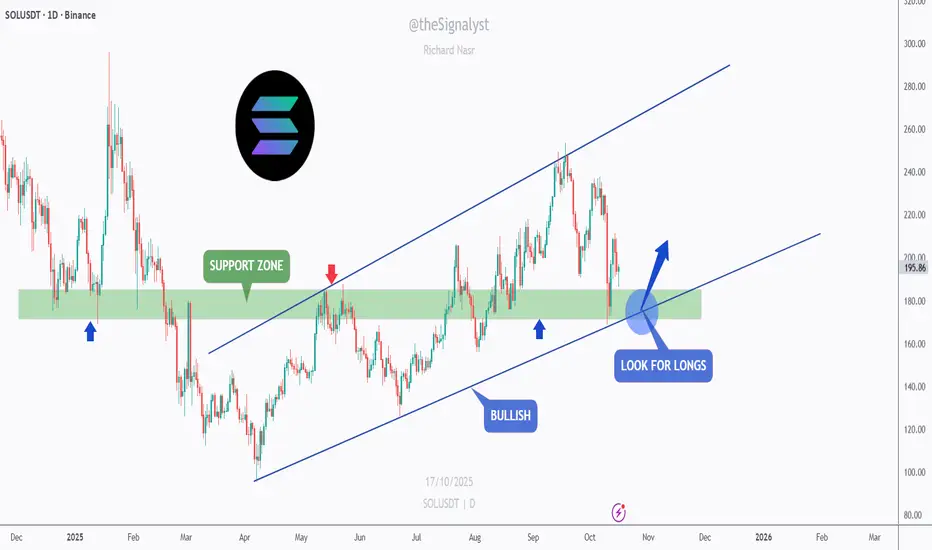
SOL - Buying the Retest Like a Sniper!SOL remains overall bullish , trading within a clean ascending channel and currently retesting the support zone that has acted as both resistance and support in the past.
This zone also aligns perfectly with the lower blue trendline, creating a strong area of confluence.
As long as this intersection holds, SOL is likely to rebound from here. I’ll be looking for bullish rejections or reversal patterns around the current zone to enter long positions, aiming for the next resistance levels near $230 and $260.
However, if the price breaks below the support zone, we could see a deeper correction before buyers regain control.
⚠️ Disclaimer: This is not financial advice. Always do your own research and manage risk properly.
📚 Stick to your trading plan regarding entries, risk, and management.
Good luck! 🍀
All Strategies Are Good; If Managed Properly!
~Richard Nasr
Where does the price find a bottom? I can see a few patterns in a weekly chart.
1) The price is moving inside the blue descending wedge pattern.
2) The price is moving inside the orange ascending wedge pattern.
3) Green descending support/resistance line is the line that completes a huge cup and handle pattern.
What do you think? I would like to know what others see.
Have a nice weekend.
Another Friday crush?? Price action is extremely bearish. I can see the same price action of the last Friday is unfolding in 1H chart.
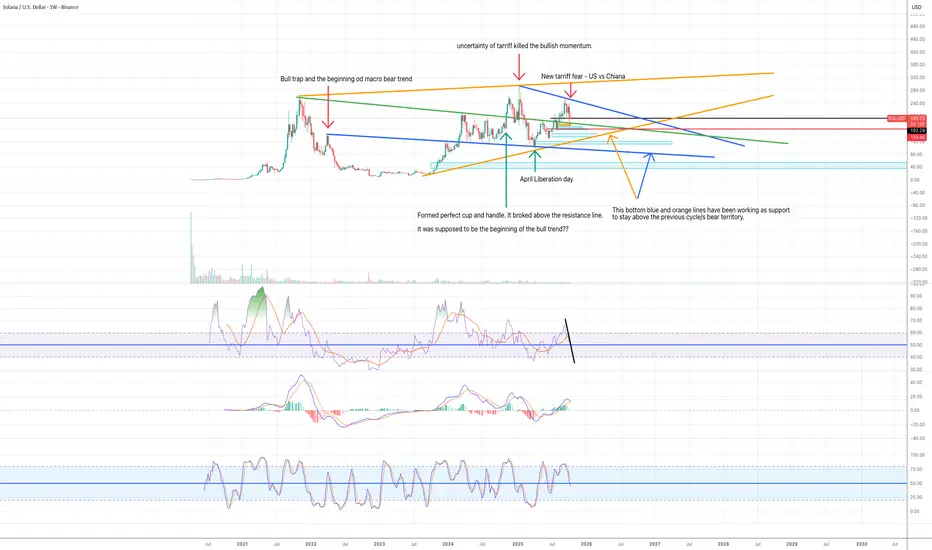
When I analyse a chart, I use trendl ines, Fib retracement, EMAs, and momentum indicators. But when the action is so volatile and I feel like I no longer know what the hell is going on, I remove all the indicators and look for clear liquidity zone in higher time frames: Where did the price move up too quickly and left unfilled buy orders, and when did the price drop too quickly and left unfilled well orders?
The problem of Solana is the price has moved down and moved up way to fast at the end of last bull cycle and in the beginning of this bull cycle.
Solana price fell from $250 to $82 in two months at the end of 2021. And after the bull trap in March 2023, the price again fell rapidly from $140 to $36 in two months. After the spectacular fall, Solana spent 16 months basing between 8 and 46 for 16 months. However, when it started to move up in October, it went up too quickly again. It moved from $22 to $200 in 6 months.
The past 18months, Solana spent most of the time in the range bound between $126 and $260, satisfying both buying and selling demands. The price can eventually go up, but I see lots of downwards pressures in every time frame:
Monthly:
Large unmitigated fair value gap between $45 and $80.
Price is trapped inside the descending wedge pattern. It is a bullish pattern. However, if the price does not break and close above the descending resistance line, the price is likely to move to the downside.
Momentum indicators are also in the bull zone. However, RSI and MACD are starting to move to the downside. It makes me think the price correction is happening. It is a monthly chart, so it won't resolve quickly.
Weekly:
I can see a diamond pattern. The price is trapped in the shape of the diamond. It is usually a bearish pattern.
The price was moving up strongly along the ascending support line (purple line). However, the last Friday's crush went down to sweep the liquidity (orange rectangular box) and I can see two more fair value gaps sitting below it.
All weekly momentum indicators are still in the bull zone, however, RSI lines and Stochastic lines are now crossed to the downside. MACD lines are very close to cross as well.
Daily:
The price is still above EMA 200 and also above the support line, however, EMA 55 is about to cross over EMA 12 and 21. Yesterday's candle retested EMA 12/21/55 and closed below it.
MACD are deeply in the bear zone and has no sign of recovery.
RSI and Stochastics are reset to move to the downside.
1H:
EMA12/21/55/200 are perfectly lined up for the bear move.
Before last Friday's crush, the price held above $217 for a few days, but it eventually capitulated. I can see the same set up unfolding. And it is Friday again.
There is an unmitigated fair value gap in the $212-218 zone (immediate one) , so the price can move up there to fake out and move down. I have no idea what the market will do. I can see in a daily chart the price is moving inside the descending parallel channel. So if the price can hold above the purple ascending trend line, it might recover from there.
It is a very difficult market. When you have a strong bias, you will always find what you want to see. I have to pay attention to what the price is doing and hopefully react to it correctly.
Good luck.

SOL — From Panic to PrecisionLast week, we witnessed a sharp, market-wide crash, a chain reaction of liquidations that flushed out overleveraged long positions. While many altcoins saw 60–90% drawdowns, the majors held relatively firm.
Among them, SOL stood out as one of the most technically precise. Price perfectly tapped the 1.1 trend-based Fib extension, in confluence with the yearly level, the 21 monthly SMA and the 0.666 retracement, providing a high probability long setup.
After that bounce, SOL revisited the lows, approaching the yearly level near $170, which remains the key structural support for maintaining bullish momentum. The support zone between $175–$170 aligns with the 21 EMA/SMA on the monthly timeframe, which currently spans $158–$170 → forming a strong macro confluence cluster that’s critical to hold.
From there, price unfolded into a clean 5-wave impulsive structure, topping within a dense resistance zone between $208–$212, reinforced by:
mOpen at $208.68
21 EMA/SMA (Daily TF) between $211–$212
0.618 Fibonacci retracement at $211.43
This area offered the perfect low-risk short entry.
Currently, SOL appears to be forming an ABC corrective pattern, likely targeting a move back into the $190–$185 range to fill imbalances and complete wave C. As another key element, the yearly open at $189.31 sits mid-range between resistance and support → a critical pivot level. That’s the region I’ll be monitoring for long setups.
🔍 Indicators used
DriftLine — Pivot Open Zones → For identifying key yearly/monthly/weekly/daily opens that act as major S/R reference points
Multi Timeframe 8x MA Support Resistance Zones → to identify support and resistance zones such as the monthly 21 EMA/SMA.
➡️ Available for free. You can find it on my profile under “Scripts” and apply it directly to your charts for extra confluence when planning your trades.
_________________________________
💬 If you found this helpful, drop a like and comment!

Long I opened a long position for a swing trade this morning.
A daily candle is still below EMA 12/21/55 and has not broken above the descending resistance line, however, I see a lot of bullish signs in the chart. I am cautiously optimistic, however, the bull is not in full control yet.
Daily:
Stochastic formed a clear positive divergence and is no in the bull zone.
RSI lines are trapped inside the descending triangle. The momentum is clearly building up and I am anticipating it to break to the upside given RSI line is starting to move to the upside and slow
MA (orange) line is also starting to tilt to the upside.
MACD lines are still in the bear zone, however, histogram shows the bearish momentum is weakening.
A daily candle is still below EMA 12/21/55, however, the price strongly held above the previous higher low at $190 (blue horizontal line) .
A daily candle is also above EMA200, two major support lines (purple and orange lines).
4H:
All three momentum indicators are in the bull zone now.
The price moved to the purple support line, moved up, retraced to retest Fib 0.382 level.
The price is above both EMA 12 and 21.
Trade plan:
Entry price: $202
S/L: $189
Target : $223

Another dip coming? Buy the strength, insteadThe current price action is very similar to that in May/June 2025 (see yellow rectangular box in the charts).
In May, the price started to finally recover from April's bottom. It started to move above the major support/resistance line (purple line in the chart) that was forming a massive cup and handle pattern, but it ende up to be a fake out and the price started to move to the downside again. The real recovery started after the price dropped to the unmitigated fair value gap (blue rectangular box). I am seeing a very similar set up in the current price action.
On last Friday, the price aggressively dropped to the same major support/resistance line (purple line) . The price held that level and spectacularly bounced up on weekend. It was the great buy the dip opportunity, but I had a feeling that there would be another deeper dip to follow.
The reason for that is that higher time momentum indicators were incredibly bearish and it didn't give me any sense of a V-shape recovery. Also a skeptical side of me makes me think that when there is such a clear bounce at the key area, it becomes so obvious where people place S/L (just under Friday's wick). If I were a market maker, I would definitely try to push the price down to take all the liquidity out.
What I am seeing in the charts:
Daily:
Both RSI and MACD are in the bear zone and pointing to the downside.
Stochastic indicator formed positive divergence, but Stochastic is more reactive and when the direction of the stochastic is contradicting RSI and MACD, it is almost always a corrective move.
EMA200 is cutting across three candles. When EMA200 is dead horizontal and sitting on the candles, EMA200 works like a magnet. The price tends to oscillate until strong momentum builds up to push the price to one direction.
4H:
When you see the price in the 4H chart, it bounced up to Fib 0.618 level and EMA 200 (proper pull back) and now it is starting to move to the downside.
But the most important thing is that there is a cluster of unmitigated fair value gap in the $135-$155 zone (orange rectangular block). It takes a lot for the price to move to that level, however, yesterday's daily candle in both SP500 and Nasdaq is trapped inside Friday's massive bear candle. If traditional market starts to break down, Solana will definitely fall further.
Stochastics formed negative divergence and started to roll to the downside.
MACD is still in the best zone and starting to lose bullish momentum.
RSI slow MA line is still in the bear zone and RSI line is already rolling to the downside.
Conclusions:
It is not a bad zone to nibble, but definitely not the time to open a leveraged position!!
It is better to miss the absolutely bottom and buy the strength.
Good luck !

Support around 212.91 is crucial
Hello, fellow traders.
By "Following," you'll always get the latest information quickly. Have a great day today.
-------------------------------------
(SOLUSDT 1W Chart)
The chart may look complicated due to the drawn lines, but the key is whether the price can rise above the boxed area.
In other words, whether the price can rise above the 179.53-237.60 range and maintain its upward momentum is crucial.
-
(1D Chart)
The HA-Low indicator on the 1D chart is showing signs of forming at the 212.91 level.
Therefore, if support is confirmed around 212.91, it would be a good time to buy.
However, the HA-High ~ DOM (60) range has formed in the 236.88-237.60 range, so we need to see if it can break above this range.
If the upward breakout fails, it's time for a partial sell-off.
-
To continue the uptrend by breaking above a key zone or point,
1. The StochRSI indicator must be trending upward. If possible, it should be below the overbought level.
2. The On-By-Value (OBV) indicator must be trending upward. If possible, it should remain above the High Line.
3. The TC (Trend Check) indicator must be trending upward. If possible, it should remain above the 0 level.
If the above conditions are met, the uptrend is likely to continue.
-
Thank you for reading to the end.
I wish you successful trading.
--------------------------------------------------
