SOL Major Trendline Lost. High-Probability Breakdown ZoneHello traders,
Honestly, SOL is now out of excuses.
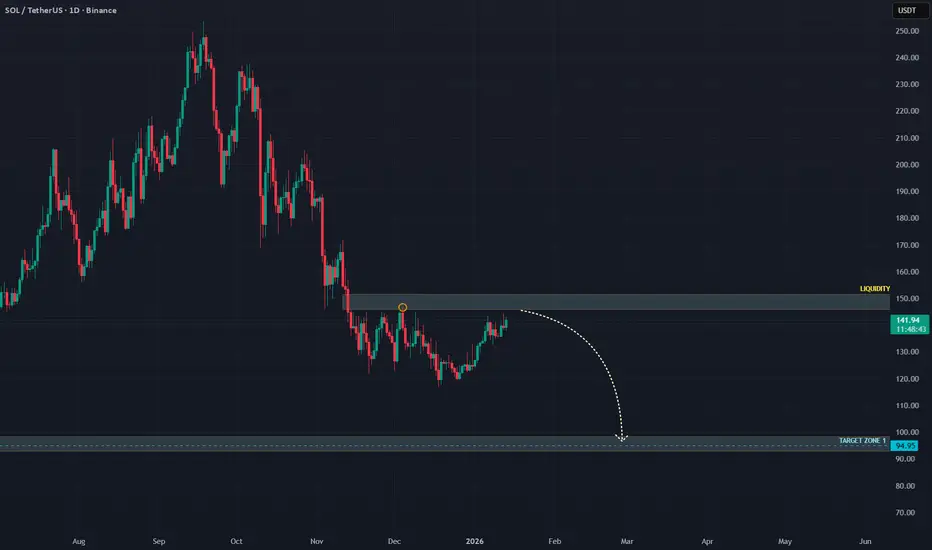
Every structure, every trend, every “support” that bulls were hiding behind is now gone.
There is nothing left to hold price except $94–$102 demand zone.
🩸 This is the last line for bulls to defense.
If this breaks…there is only air below.
The market will enter a low-liquidity void where panic can accelerate price toward the $8 psychological level.
Choose what you hold wisely 📉
Good Luck!
SOLUSD

SOL Major Trendline Lost. High-Probability Breakdown ZoneHello traders,
Honestly, SOL is now out of excuses.
Every structure, every trend, every “support” that bulls were hiding behind is now gone.
There is nothing left to hold price except $94–$102 demand zone.
🩸 This is the last line for bulls to defense.
If this breaks…there is only air below.
The market will enter a low-liquidity void where panic can accelerate price toward the $8 psychological level.
Choose what you hold wisely 📉
Good Luck!

#SOL/USDT Final Liquidity Zone Before Expansion ?#SOL
The price is moving within a descending channel on the hourly timeframe. It has reached the lower boundary and is heading towards a breakout, with a retest of the upper boundary expected.
The Relative Strength Index (RSI) is showing a downward trend, approaching the lower boundary, and an upward bounce is anticipated.
There is a key support zone in green at 97.05, and the price has bounced from this level several times. Another bounce is expected.
The RSI is showing a trend towards consolidation above the 100-period moving average, which we are approaching, supporting the upward move.
Entry Price: 101.80
Target 1: 103.95
Target 2: 106.65
Target 3: 109.93
Stop Loss: Below the green support zone.
Remember this simple thing: Money management.
For any questions, please leave a comment.
Thank you.

Solana Traders Beware: Critical Support Ahead! (1W)In our previous analysis, we presented a bearish outlook on Solana starting from the $135 level. In this updated analysis, we’ve revised the key support zone and made adjustments to the high-timeframe wave count to reflect recent market behavior.
From the point marked by the red arrow on the chart, the corrective move has begun. Based on the price action and wave structure, this correction appears to be forming a diametric or symmetrical pattern, which is typical in complex corrective phases.
The green zone on the chart represents the potential area where wave e could complete and wave f may start. For wave f, we’ve identified two possible targets, which are clearly marked on the chart for easy reference.
We encourage you to adjust your own outlook and trading plan according to this updated analysis, keeping in mind these support levels, wave structures, and potential targets.
Stay disciplined and manage your risk carefully—Solana’s next move will likely depend on how it reacts around these key zones.
If you have a coin or altcoin you want analyzed, first hit the like button and then comment its name so I can review it for you.
This is not a trade setup, as it has no precise stop-loss, stop, or target. I do not publish my trade setups here.

SOLANA — Absorption at HTF Resistance | Downside Risk IncreasingTraders,
CRYPTOCAP:SOL pushed into resistance and stalled. Not aggressively. Not weakly either.
What we are seeing now is absorption, and the market is quietly deciding what to do next.
The question is not “bullish or bearish.”
The question is where the real decision gets made.
Right now, the chart gives us a very clean structure.
1. What happened
SOL rallied back into a higher-timeframe resistance zone around $142–145.
This area is important because:
It previously acted as distribution
It aligns with a harmonic exhaustion level
Liquidity is clearly resting above
Price did not reject immediately.
Instead, it slowed down.
That already tells us something.
2. What price is doing now
On the 1H, price is pushing higher in small steps:
Push
Pause
Shallow pullback
Push again
Each high looks constructive, but none are being accepted cleanly.
This is not breakout behavior.
This is price being worked inside supply.
Liquidity above is visible.
Yet price hesitates just below it.
3. Momentum in strength, not divergence
RSI is not aggressively diverging here.
Instead:
RSI stays elevated
Each push higher produces less expansion
Momentum rolls over inside strength
That usually means effort is being absorbed, not rewarded.
When momentum stalls at resistance without breaking down, it often reflects absorption inside strength, not weakness.
4. Spot flow tells the real story
Spot CVD continues to rise.
On both the 1H and the 4H, spot CVD is making clear higher highs. Buyers are not hesitating. Market orders keep hitting the ask, and spot demand is persistent across timeframes.
On the surface, that looks bullish.
But price is not responding.
Despite spot CVD printing higher highs, price remains capped beneath resistance and fails to gain acceptance. Each attempt higher is absorbed rather than extended.
That mismatch matters.
When spot demand increases across multiple timeframes and price fails to move, it usually means one thing:
Supply is sitting above the market
Sellers are passive and patient
Buyers are doing all the work
This is classic absorption behavior.
The important detail here is that this is not a single-timeframe signal. The fact that spot CVD is making higher highs on both the 1H and 4H strengthens the read. Real buyers are present, but they are being met by consistent supply.
That is not how breakouts start.
That is how distribution hides.
5. Futures are not confirming
While spot keeps buying:
Stablecoin-margined futures CVD trends lower
Perp traders are selling into strength
Leverage is not chasing this move
Coin-margined futures remain net negative, suggesting longer-horizon participants are still distributing.
Different groups, same message: less appetite for higher prices here.
6. Open interest adds tension
Open interest remains elevated.
Price is not expanding, yet positions are being added.
That creates pressure.
Crowded markets don’t drift.
They eventually move, and usually fast.
7. The higher-timeframe context
On the daily, accumulation and distribution remains pointed lower.
Rallies continue to be used to offload supply.
This move fits that pattern.
Push into resistance.
Effort from buyers.
No acceptance.
8. The decision zone
The area around $142–145 is the key checkpoint.
This is where supply has been active before, and it is where the market has to prove it can do more than just absorb.
If price:
Pushes slightly higher
Sweeps the liquidity sitting in the blue box
But fails to hold or shows weakening spot follow-through
Then this area becomes a distribution and take-profit zone, not a breakout.
A sweep without acceptance is often the final act before rotation.
If sellers remain patient here, downside opens quickly.
9. Downside focus
Below the current range, the structure is thin.
There is unfinished business lower, and price has not spent enough time there to build support.
Target zone: $94–100
This area stands out because:
It previously acted as acceptance
Liquidity is concentrated there
It represents a clean mean reversion for the entire move
If price starts to roll from the current region, this zone becomes the primary magnet.
Moves like this rarely stop halfway.
10. How to read it in real time
A push into the blue box followed by stalling price and slowing spot CVD → distribution
Spot CVD still rising but price failing to hold → absorption, not strength
Spot CVD rolling over at highs → rotation starting
The market does not need to break down immediately.
It only needs to stop rewarding buyers.
When that happens, the path lower opens fast.
------------------------------------------
The market is leaning into supply.
It may take one more push into liquidity before the real move starts, but the risk remains skewed lower as long as buyers are not being rewarded.
Let price do the talking.
If this analysis helped you see the structure more clearly, a like is always appreciated.
Feel free to share your thoughts or alternative scenarios in the comments.
Thanks for reading.
SOL Global Trend. Triangle. Head and Shoulders. 02/2026Logarithm. The time frame is 1 month for clarity; on a shorter time frame, the key zones are identical. The price is currently in the distribution zone (reset wave), in the "neck" zone of a potential head and shoulders pattern, should this support zone be broken.

#SOL/USDT Final Liquidity Zone Before Expansion ?#SOL
The price is moving within a descending channel on the hourly timeframe. It has reached the upper boundary and is heading towards breaking it. A retest of this boundary is expected.
The Relative Strength Index (RSI) is showing an upward trend, as it has approached the upper boundary. A bearish reversal is expected.
There is a key support zone in green at 114.50. The price has bounced from this zone several times and is expected to bounce again.
A consolidation trend is observed above the 100-period moving average, which we are approaching. This trend supports a decline towards this level.
Entry Price: 116.78
Target 1: 117.96
Target 2: 119.91
Target 3: 122.82
Stop Loss: Above the green support zone.
Don't forget one simple thing: Money Management.
For any questions, please leave a comment.
Thank you.

SOL/USDT | Slowly going back up (READ THE CAPTION)By examining the daily chart of SOLUSDT we can see that after dropping as low as 112.14 and touching the high of the Bullish OB, it bounced back up and its currently being at 116.00.
Considering that Solana has swept the liquidity pool, I expect it to slowly move higher.
Targets for Solana: 116.50, 117.00, 117.50, 118.00, 119.00 and 120.

SOL/USDT | SSL sweep? (READ THE CAPTION)As you can see in the 4h chart of SOLUSDT, it has experienced a massive drop from 148.74 all the way to 117.15, but managed to recover a bit and reached 128.34 before dropping again and now it's being traded at 122.70.
I don't want Solana to go for the Sellside liquidity pinpointed on the chart, but it is not unlikely for it to go there and sweep the liquidity below the 116.88 level, then starting a move upwards, going for the IFVG.
Bullish Targets for Solana: 123.00, 123.50, 124.00, 124.50 and 125.
Bearish targets: 122.50, 122.00, 121.50 and 121.00.

SOL/USD: ABC Correction Ending at SupportSOL/USD has completed a bullish impulsive move, finishing a full 5-wave structure to the upside. After the top of Wave 5, the market shifted into a corrective phase, forming a clear A-B-C correction. Price has now moved down into Wave C, which is testing a strong support zone between 121–119 (Fibonacci 0.618–0.786 area). This zone is important because corrections often end here. As long as price holds above ~119, the bias turns bullish, and a recovery toward 129–132 (Wave B / retracement area) is expected first, followed by a potential continuation higher. If price breaks and closes below 119 , the bullish recovery idea fails, and SOL could move lower toward the next support near 115 .
Buy zone: 121 – 119 (0.618–0.786 Fibonacci support)
Stop-loss: 118.50 (below Wave C low)
Target 1: 129.30 (0.382 retracement)
Target 2: 132.00 – 135.00 (prior structure resistance)
Stay tuned!
@Money_Dictators
Thank you :)

SOLANA 2022 fractal shows crash to $30 is coming.Solana (SOLUSD) has been consolidating mostly within the last 2 months, with the 1W MA50 (blue trend-line) as its Resistance and the 1W MA200 (orange trend-line) as its Support. We have posted this chart more than two months ago, giving a timely sell signal to exit this market.
Based on the early 2022 price action, Stage 1 of that Bear Cycle was completed after a short-term rebound towards the 1D MA200 (red trend-line), which was rejected and initiated Stage 2. We expect that to be confirmed once the 1W MA200 breaks. Notice also the similarities between their 1W CCI fractals.
The minimum Target we have for the 2026 Bear Cycle is $30.00, which is both on the 0.618 Fibonacci retracement level from the previous Cycle bottom as well as the 2.78 Fib extension (blue) from the recent High and Low.
---
** Please LIKE 👍, FOLLOW ✅, SHARE 🙌 and COMMENT ✍ if you enjoy this idea! Also share your ideas and charts in the comments section below! This is best way to keep it relevant, support us, keep the content here free and allow the idea to reach as many people as possible. **
---
💸💸💸💸💸💸
👇 👇 👇 👇 👇 👇

Crypto SILVER - LTCIn the world of traditional finance, Gold (XAU) and Silver (XAG) provide the ultimate blueprint for what we are seeing in the crypto markets today.
While Bitcoin (Digital Gold) has been busy smashing all-time highs and capturing the world's attention, Litecoin (Digital Silver) has been quietly ignored, stuck in a massive range for years.
If this feels familiar, it’s because we’ve seen this movie before in the metals market.
On the charts, we are witnessing a rare technical phenomenon: a high-conviction accumulation phase exceeding 1,300 days.
The 1,300+ Day Accumulation : We are currently mid-way through 2026, and LTC has been building a base for over 1,300 days.
The "Forgotten" Asset : For nearly 8 years, LTC has largely moved sideways against the macro trend. It has been called "boring" and "forgotten" by the retail crowd—the exact sentiment usually found at a generational bottom.
Network Integrity : Despite the price stagnation, LTC recently hit record-high network activity and has maintained 100% uptime for over 14 years. Institutional accumulation is happening in the dark while the public looks away.
Drop in comments bellow - Are You holding Litecoin?

DeGRAM | SOLUSD will rebound to $135📊 Technical Analysis
● SOL/USD continues to respect a long-term descending dynamic resistance, but price has stabilized above a well-defined demand zone around 120–125, forming higher lows after a prolonged decline.
● The structure shows base-building following multiple triangle consolidations, with bullish divergence implied by compression near support, suggesting accumulation ahead of a potential breakout.
💡 Fundamental Analysis
● Improving sentiment in the crypto market and growing Solana ecosystem activity support long-term recovery expectations once macro risk stabilizes.
✨ Summary
● SOL holds above a major support area.
● A long-term bullish reversal is favored, with upside potential toward 143–170 if support near 120 remains intact.
-------------------
Share your opinion in the comments and support the idea with a like. Thanks for your support!

SOL/USDT | Sweeping the Liquidity Pools! (READ THE CAPTION)SOLUSDT made it all the way to 148.74 and swept away the liquidity there and then it dropped massively all the way to 117.15, and is currently being traded 124.00. I'd like to see Solana sweep away the sellside and buyside liquidity that are pinpointed in the chart.
For the time being, bearish targets for SOL are: 123.50, 121.50, 119.50, 117.50 and 117.00.
Bullish Targets are: 125.50, 127.50 and 129.50.

Solana (solusdt): a correction and a possible bounceHi guys!
As you can see Solana breakout from the resistance line but it was a false breakout and then started a drop there!
I see the drop will continue at least until the gray area and then price could rise from there!
short position target: $123

DeGRAM | SOLUSD is testing the support area📊 Technical Analysis
● SOL/USD broke below the key rising support trendline (former channel base), with the breakdown confirmed by a strong impulsive candle, signalling loss of upward structure and a shift toward bearish control.
● Price failed to hold above the horizontal support near ~$134.00–$130.00 and now trades below both dynamic support and the former rising channel, increasing probability of continuation toward the next structural levels near ~$123.6 and lower.
💡 Fundamental Analysis
● Broader crypto risk sentiment remains fragile as tighter liquidity conditions persist and speculative flows pull back from high-beta tokens like Solana, reinforcing short positioning bias.
✨ Summary
● Breakdown confirmed below rising support and ~$134.00.
● Downside targets: ~$123.6 → lower key support ~119.3.
● Trend shift to bearish while below former support.
-------------------
Share your opinion in the comments and support the idea with a like. Thanks for your support!

1W SOL update: Volatility is back, but structure mattersWe’re seeing another dump reaction across the majors, and Solana isn’t immune. That said, this still looks like reactionary selling within a broader structure, not random collapse.
On SOL specifically:
• Price broke down from a steep corrective channel
• Momentum flushed quickly, which is typical late in corrections
• The $100 area lines up with the top of the prior trend / major HTF support
• A sweep into that zone would still be structurally healthy
A move toward ~$100 would likely be a retest, not a failure. That’s where you’d expect:
• Sellers to exhaust
• Late shorts to press
• Potential for relief or rotation back into the range
If $100–105 holds with acceptance, a relief bounce back toward $125–140 is very reasonable. If it doesn’t, then we reassess. Simple.
Same theme as BTC and ETH:
Volatility is shaking confidence, not invalidating the higher-timeframe picture yet. Let price come into real levels before jumping to conclusions.

Don’t Panic With SOL – The Market Is Offering an OpportunitySOLUSDT currently looks like a deep correction within a broader uptrend, rather than a trend reversal. Recent news has mainly created short-term psychological pressure across the crypto market, while Solana’s fundamentals remain solid: institutional capital has not exited aggressively, staking levels stay high, and the ecosystem continues to show healthy activity.
On the chart, the recent drop came from a strong rejection at the descending trendline and the upper edge of the Ichimoku cloud. The key point, however, is that after the breakdown, price did not continue to collapse. Instead, it quickly formed a clear consolidation zone around 125 USDT — a sign that selling pressure is fading and buyers are starting to absorb supply.
The 125 area now acts as a critical support zone. As long as price holds above this level, I favor a scenario where SOL continues short-term fluctuations to build a base, followed by a recovery toward the 132–136 zone.
Overall, SOLUSDT is still following the textbook structure of a healthy uptrend: a sharp drop, base formation, consolidation, and recovery. For me, this is a phase that requires patience, because the market tends to reward those who wait for proper structure — not those who rush in.

Coinranger|SOLUSDT. Potential reversal to 135🔥News
🔹The International Economic Forum continues. US GDP is at 16:30 (UTC+3). US PCE data for November and October will be released at 18:00 (UTC+3) – this is still important due to possible recalculations for later months.
🔥SOL
🔹Time to update the Solana chart:
1️⃣A potential set of upward wave markers has appeared above: 133, 135, 138.
2️⃣Below, 124 and 122 remain significant levels. They could still play out during a potential flat phase.
For now, the priority is a continued upward pullback. There is also a possibility of a flat at 131 - 124, but not yet.
-------------------
Share your opinion in the comments

SOL analysis Hello traders,
We are seen the btc & sol falling in past few days, as we expected pullback from here.

My Crypto Convictions - BTC | ETH | ADA | SOL | XLMBitcoin (BTC): Bitcoin is the world's first and most well-known cryptocurrency, created in 2009 by an unknown individual or group using the pseudonym Satoshi Nakamoto. Bitcoin operates on a decentralized ledger technology called blockchain, which allows for secure and transparent transactions without the need for intermediaries such as banks. Bitcoin's price is known for its volatility, often experiencing sharp rises and declines in short periods of time. As of September 2021, Bitcoin has a market capitalization of over $800 billion and a circulating supply of 18.8 million coins.
Ethereum (ETH): Ethereum is a decentralized blockchain platform that enables developers to build and deploy decentralized applications (dApps). The platform's native cryptocurrency is Ether, which is used to pay for transactions and computational services on the network. One of Ethereum's most significant contributions to the cryptocurrency world is the introduction of smart contracts, which are self-executing contracts that can automate the negotiation and enforcement of contract terms. Ethereum currently has a market capitalization of over $400 billion and a circulating supply of over 117 million coins.
Cardano (ADA): Cardano is a blockchain platform that operates on a proof-of-stake (PoS) consensus algorithm. The platform was created by Charles Hoskinson, one of the co-founders of Ethereum, and aims to provide a more sustainable and scalable alternative to existing blockchain networks. Cardano's native cryptocurrency is ADA, which is used to pay for transactions and fees on the network. The platform has gained attention for its focus on academic and scientific research, with a strong emphasis on the development of practical use cases for blockchain technology. Cardano has a market capitalization of over $80 billion and a circulating supply of over 32 billion coins.
Solana (SOL): Solana is a high-performance blockchain platform that aims to provide faster and cheaper transactions compared to other existing blockchain networks. The platform's native cryptocurrency is SOL, which is used to pay for fees and transactions on the network. Solana is built on a unique consensus algorithm called Proof of History (PoH), which helps to optimize the processing of transactions and reduces network congestion. In August 2021, Solana experienced a surge in popularity and price, briefly becoming one of the top 10 largest cryptocurrencies by market capitalization before experiencing a correction. As of September 2021, Solana has a market capitalization of over $35 billion and a circulating supply of over 300 million coins.
Stellar Lumens (XLM): Stellar Lumens is a blockchain platform that enables fast and secure cross-border transactions. The platform's native cryptocurrency is XLM, which is used to facilitate transactions and pay for fees on the network. Stellar was created by Jed McCaleb, one of the co-founders of Ripple, and aims to provide a more inclusive and accessible financial system by leveraging blockchain technology. One of Stellar's notable partnerships is with IBM, who has been working with the platform to develop blockchain solutions for the financial industry. As of September 2021, Stellar has a market capitalization of over $8 billion and a circulating supply of over 23 billion coins.

SOL - you won’t like this idea.Greetings! You’re looking at the analysis from Financier Monitors, which means you’re in for some high-quality analytics.
Today we’ll take a look at SOL.
1) The asset has been truly impressive this cycle. Not even so much in terms of its price growth as a coin, but in terms of growth as a project. All these memes, tons of projects, and overtaking ETH — that’s significant.
It also started growing together with Bitcoin, and for 749 days it managed to do this quite successfully. However, the ATH may be nothing more than a possible last high for Solana over the next 1.5–2 years.
2) Sentiment.
So far, I don’t see bearish scenarios. Either people lost money on 11.10 and are hoping to recover it and sell their spot altcoins, or they simply didn’t get the multiples (x’s) they were expecting — overall, who knows.
The verdict is simple: the crowd and major influencers have been deep in alts since 2021, deep in longs, believing in altseason, etc.
We have no right to judge them, because there’s always a chance that I’m the one who’s wrong. For now, I’ll base my view purely on the chart, so let’s move on to it.
3) Chart.
On the weekly timeframe, SOL has entered a range. But is it just a range? No. In the PSY and BC zones, the first volume spikes appeared — position profit-taking.
Next, we see a not entirely classic Wyckoff distribution, because it lacks a UTAD (another higher high after the UT). However, this is normal when buyers simply don’t have enough strength to counteract selling from large investors.
A nice rise within an ascending channel in LPSY, followed by a breakdown of that channel.
Overall, I’ve attached the schematic, so this is roughly what I expect.
Subscribe.

Solana's Price Action reflects some Short-Term AmbiguityPrice now appears to be operating within the b-wave portion of the corrective pattern. While I acknowledge we could see marginally lower prices from here, my base case remains that price recovers and continues to subdivide as depicted in my chart in the black pathway. What remains less clear is whether we are still subdividing to new local lows under the purple alternate, or if the retracement instead continues in a more standard fashion into my target box.
The uncertainty stems from the fact that SOL’s price never decisively traded above the $147–$148 region we have been monitoring for some time. That failure keeps the purple count viable.
However, what lends slightly more confidence to my black primary count over the purple alternate, specifically with respect to Solana, is Bitcoin. BTC has managed to trade above a level that can reasonably be interpreted as the wave iv of a lesser degree. If that interpretation proves correct, it becomes increasingly difficult to envision Bitcoin continuing its corrective advance without exerting upward influence on Solana as well.
As always, time and structure will resolve this short-term ambiguity.
