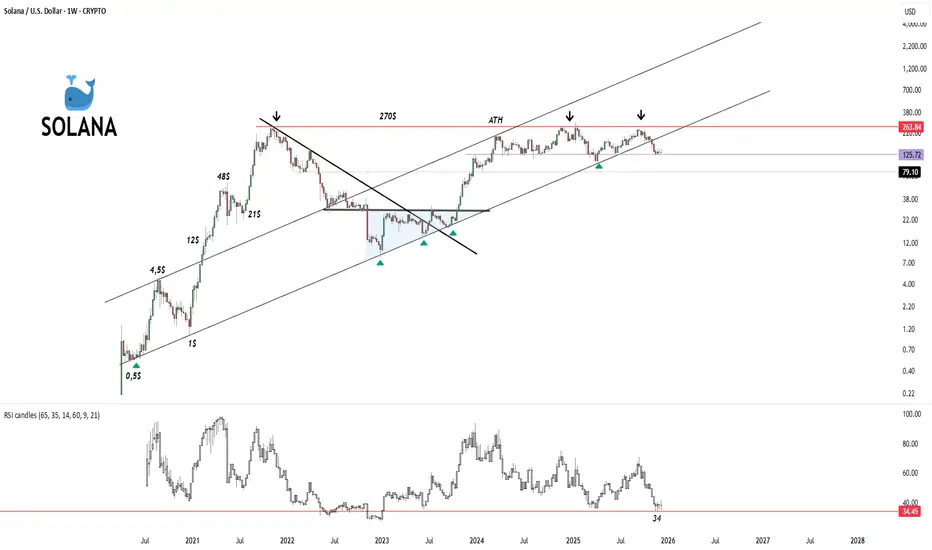
SOLANA MACRO VIEW !
1. Macro Trend: Ascending Channel
The most dominant feature of this chart is the massive ascending parallel channel (the two long black lines sloping upwards).
Long-Term Bullish: Despite volatility, the price has generally trended upward over the last several years, respecting the boundaries of this channel.
Current Status: The price is currently in the lower half of this channel. After being rejected near the top of the channel (around the ATH region), it is retracing downward.
2. Key Support & Resistance Levels
Resistance (The Ceiling):
~$263 - $270 (Red Zone): This is the major historical resistance area, aligned with the All-Time High (ATH). The chart shows three distinct rejections (marked by black downward arrows) in this area over the last year, indicating strong selling pressure whenever SOL approaches this price.
Upper Channel Line: The diagonal upper line acts as dynamic resistance.
Support (The Floor):
~$125.72 (Purple Line): The price is currently trading at $131.50, just above this crucial horizontal support level. This level previously acted as resistance during the recovery phase; holding this line is critical for bulls.
~$79.10 (Dotted Line): If the $125 level fails, the next major historical support is around $79.
Lower Channel Line: The diagonal bottom line is the "trend defender." Every time the price has touched this line (marked by green triangles), it has bounced significantly.
3. Indicator Analysis: RSI (Relative Strength Index)
The bottom panel shows the RSI, which measures momentum.
Approaching Oversold: The RSI is currently at 34.45.
Historical Bounce Zone: The red horizontal line at 34.45 on the RSI panel suggests this is a historical "floor" for momentum. In previous instances (like late 2020 and mid-2022), when the RSI hit this low, the price eventually found a bottom and reversed upward.
Divergence: The RSI is making lower lows, confirming the strength of the current downtrend, but it is reaching a point where sellers often become exhausted.
4. Chart Patterns & Behavior
Rejection at ATH: The "Double Top" or "Triple Top" formation near the $260-$270 level is a bearish reversal pattern, which explains the significant correction SOL is currently experiencing.
Correction Phase: Since hitting the top of the channel, the price has been in a consistent downtrend (lower highs and lower lows on the weekly timeframe).
Summary
The chart depicts a critical decision point for Solana.
The Bearish Case: If the price breaks below the $125 support, it could flush down to the $80 region or the bottom of the channel to find liquidity.
The Bullish Case: The RSI hitting historical support (34) combined with the horizontal price support at $125 suggests a potential bounce area. If buyers step in here, the trend remains intact
-------------------
1. Historical "Bottom" Zone (Momentum Support)
Looking at the bottom RSI panel, whenever the RSI line touches or approaches the 34 level (the red horizontal line), we see that selling pressure tends to exhaust and buyers step in.
Past Examples: Looking at the left side of the chart (late 2020 - early 2021), when the RSI dropped to these low levels, the Solana price found a bottom (around $1) and subsequently launched a massive bullish trend.
Meaning: This level acts as a psychological floor where "bear" (seller) strength runs out and "bulls" (buyers) prepare to take over momentum.
2. Approaching Oversold Signal
RSI typically considers anything below 30 as "oversold." The 34 level is very close to this zone.
The fact that the RSI is currently at 34.45 indicates that the price has dropped sharply and quickly, and this decline is approaching an unsustainable point.
Technically, this is interpreted as a zone where it is "too late to sell, but time to look for buying opportunities."
3. Confluence of Price and RSI
The price is trading at $131.50, trying to hold the $125 support.
The fact that the RSI has hit the 34 support at this exact same moment creates a condition of "Double Support" (support in both price and momentum).
This alignment increases the probability of a reaction bounce from this area.
4. Risk Warning
While the RSI 34 level is strong support, if this level is broken to the downside (meaning RSI slides below 30 into the 20s), it indicates that the downtrend is extremely strong and panic is continuing. In this scenario, there is a risk of the price retracing to the next major support zone around $79.
In Summary: The 34 RSI level is currently a "Make or Break" decision point for Solana. Historical data suggests that this level usually marks a reversal point.
+
SOL/BTC 1w
SOL Dominance
SOLUSD
#SOL/USDT Final Liquidity Zone Before Expansion?#SOL
The price is moving in a descending channel on the 1-hour timeframe. It has reached the lower boundary and is heading towards a breakout, with a retest of the upper boundary expected.
We are seeing a bearish bias in the Relative Strength Index (RSI), which has reached near the lower boundary, and an upward bounce is expected.
There is a key support zone in green at 130, and the price has bounced from this level several times. Another bounce is expected.
We are seeing a trend towards stabilizing above the 100-period moving average, which we are approaching, supporting the upward trend.
Entry Price: 132
First Target: 134
Second Target: 137
Third Target: 140
Remember a simple principle: Money Management.
Place your stop-loss order below the green support zone.
For any questions, please leave a comment.
Thank you.

$SOL Solana is currently in a clear accumulation phase following a strong reaction from the major demand zone.
The horizontal accumulation in this zone indicates both a re-intensification of liquidity and the market gathering energy for the next directional breakout.
As long as the region holds, the structure is positive, and this accumulation will be the key to the next expansion phase.

Solana (SOL/USDT) – 4H Technical AnalysisSolana is currently consolidating within a tight range after failing to sustain momentum above the short-term moving averages. Price continues to trade below the 200-EMA, which keeps the broader 4H trend tilted to the bearish side.
Key Levels
Immediate Resistance:
$135–136 zone where price recently faced multiple rejections.
Short-term EMAs are also flattening near this region, creating additional overhead pressure.
Major Supply Zone:
$168–175 (highlighted red area).
This remains a strong higher-timeframe resistance where sellers previously dominated.
Immediate Support:
$128–130 (blue demand zone).
Price rebounded from here several times, showing active buyers.
Market Structure
Price attempted a short-lived recovery but failed to break above the 200-EMA. The market is forming lower highs, indicating weakening bullish attempts. Unless SOL makes a decisive close above the $135–136 region, upside continuation remains limited.
A sweep of liquidity into the $128–130 support zone is still possible, especially if momentum weakens further.
RSI Momentum
The RSI is hovering around the mid-zone (~45–47), reflecting indecision and lack of strong directional momentum.
No major bullish or bearish divergence is present on the current 4H structure.
As long as RSI remains below 50, bulls are not in clear control.
Possible Scenarios
Bullish Case
A clean breakout and 4H close above $136 could open room for a move toward $142–145, followed by a potential retest of the $155–160 region.
However, the 200-EMA overhead means buyers need strong volume to shift structure.
Bearish Case
If price breaks below the $128–130 demand zone, SOL may revisit $122–124, where the next support cluster is visible.
Failure to hold these levels could extend the corrective structure.
Neutral Summary
SOL is currently range-bound between $130–136, with neither side showing strong conviction. Traders may prefer waiting for a breakout from this range or a clearer reaction at the major support zone before taking directional positions.
This analysis is for educational purposes only and reflects general market observations, not financial advice.

SOL : LIVE TRADEHello friends
as you can see, after the resistance we set was broken, the price has grown well, and now with this red shadow, there is a sign of sellers entering, and there is a possibility of price correction, and the price can grow again from these areas and move to our targets, of course, if buyers support the support area again...
This analysis is purely from a technical perspective and is not a buy or sell recommendation, so please follow risk and capital management.
*Trade safely with us*

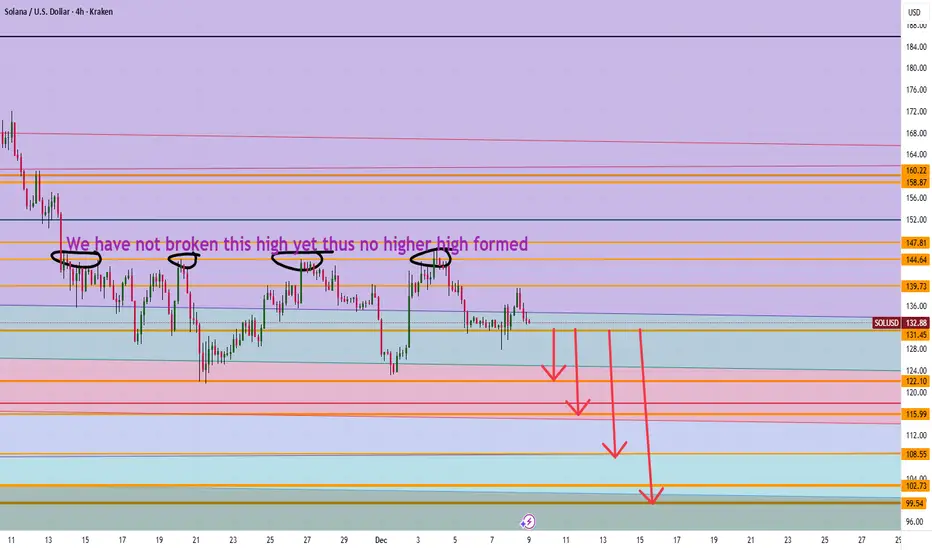
Is Solana heading to $100 It appears we have not made new higher highs in price action on the 4 hour and thus a possible movement down to $108 then 100 levels make sense. However if we can break 139 level then 147 can make sense going up.
Trade Smarter Live Better
Kris
Solana Rebounds Weakly with No Clear Trend SignalsSolana on the 4H timeframe is only showing a mild pullback, as neither technicals nor news indicate fresh inflows strong enough to shift momentum. Price remains capped below the 138–142 FVG resistance cluster, and although small rebounds occur, their narrow range highlights the lack of aggressive buying. The Ichimoku cloud and multiple overhead FVGs form a thick supply layer, causing every upward attempt to be sold off — making a breakout relatively unlikely.
Volume behaviour also supports the idea of a technical retracement: it picks up slightly at the lows but fades as price climbs, signalling reactive buying rather than committed inflows. If SOL fails to break above 142, a move back down to fill the lower FVG at 128–123 remains a reasonable scenario.

No Clear Path yet...but I Still Favor Higher in Orange or BlackOrange represents a FLAT retracement, whereas Black represents a standard retracement. However, since we have not even traded above the 23.6%, I am still carrying a purple OML count.
Therefore, SOL is about as clear as mud.
Chris

SOLANA – Key Support Retest, Watching HTF Structure CloselySOL is interacting with one of the most important HTF zones on the chart — the multi-year support level that has repeatedly defined trend transitions. This zone has served as structural support during expansion phases, a breakout base during the run toward all-time highs, and later as a liquidity pool during corrective cycles. Every major deviation from this line has led to a significant move in the opposite direction, making this retest highly meaningful.
Earlier in the chart, support broke and produced a full liquidity sweep, clearing long-position stop clusters before price reclaimed the level and initiated a multi-month advance. The presence of an order block just above this zone adds additional structure: it acted as a redistribution area during the breakdown, and later as the origin of re-accumulation. The recent taps into this region suggest the market is again probing for resting liquidity and responsive buy orders.
Price is now compressing between HTF support and declining 50/100 EMAs, creating a classic higher-timeframe squeeze. EMAs continue to slope downward, signaling a bearish macro trend, but candles remain supported at the long-term horizontal level. This type of compression typically resolves with a decisive expansion once liquidity is absorbed from one side.
The FVG Reaction Zone earlier in the trend shows how SOL tends to return to inefficiencies before choosing direction. The current circled region may represent the same behavior on a larger scale — an attempt to rebalance price before either reclaiming the EMAs or continuing displacement lower.
Momentum indicators add another layer: Stoch RSI is turning upward from deeply oversold territory, suggesting momentum exhaustion on the downside but not yet confirming a trend reversal. Historically on this timeframe, these rotations have preceded multi-week expansions when aligned with structural reclaim, but have also failed when EMAs continued to reject price.
Overall, SOL is positioned at a pivotal HTF decision point:
Hold support → potential base formation and EMA reclaim attempts
Lose support → opens the door to a fresh liquidity sweep into prior structural lows
Until a break in structure or EMA reclaim occurs, this remains a compression zone with elevated importance for trend continuation or reversal.

SOL at a Major Turning Point — Big Move Ahead#SOL
SOL is sitting right on its major weekly support, a zone that has held the chart together multiple times. This area is still acting as the main foundation for the current structure 🧱
If SOL can bounce from here and push back into the resistance zone above, the chart opens the door for a larger continuation toward the upper distribution area 🚀
We can already see how clean the structure becomes once price reclaims that mid-zone.
But if this major support fails to hold, SOL could slide into the deeper accumulation zone — a long-term area where strong buyers usually step in 👀
Right now, SOL is at a critical point. How it reacts here will shape the next big weekly move. Stay patient and follow the reaction, not the prediction ⚡
#SOLUSDT

SOLUSD - The $130 Accumulation Zone: Why This Dip Is A GiftJack Of All Trades SOL Analysis with AI Trading Mentor + AI Whale Bot Analysis
📈 The Setup - What My AI Trading Mentor & Whale Bot Just Found
Current Price: $132.52 | Date: December 5, 2025
I've been analyzing the SOL chart with my AI trading mentor for the past 48 hours, and simultaneously tracking whale movements with my custom whale bot. What we discovered is absolutely insane.
While retail traders are panic-selling this -4.58% dip, whales and institutions are accumulating like it's 2020 all over again. And they know something the market doesn't.
Let me show you what's REALLY happening behind the scenes.
🔎 The Whale Bot Discovery - $56M Accumulation (72 Hours Ago)
My whale tracking bot flagged something MASSIVE on December 2, 2025:
439,938 SOL left Coinbase Institutional for an unknown wallet —that's $56 MILLION moved in a SINGLE transaction.
This wasn't panic selling. This was strategic accumulation.
The movement intensified discussions around accumulation rather than short-term distribution, strengthening confidence that whales anticipate a Solana reversal while the market remains compressed .
But here's where it gets REALLY interesting...
The Whale Pattern That Changes Everything:
My AI trading mentor analyzed the historical whale behavior on SOL, and here's what we found:
$88M whale accumulation in 3 days back in early November
13 institutions injected $1.72B into Solana treasuries (1.44% of total supply!)
$39.65M negative netflow (coins LEAVING exchanges)
Translation? Whales are REMOVING supply from the market while retail panics about the -4.58% dip.
Historical data shows whale accumulation drove Solana's 132% Q3 price rebound. We're seeing THE EXACT SAME PATTERN right now at $130.
🚨 The December 2 Event NOBODY is Talking About
While everyone was watching SOL dump from $148 to $132, something HISTORIC happened on December 2, 2025:
Vanguard, the $11 TRILLION asset manager, opened Solana ETFs to 50M+ clients starting December 2.
Let me repeat that: $11 TRILLION.
Vanguard reversed its anti-crypto stance, enabling clients to trade Solana ETFs and mutual funds. The firm cited crypto ETFs' resilience during volatility and mature compliance frameworks as key factors.
Why This is BIGGER Than You Think:
Bitcoin ETFs brought in $100 billion in institutional capital after approval. Sol ana is now getting the SAME treatment.
Polymarket shows 91% chance of Solana ETF approval by December 31, 2025 with volume of $178,356 betting on this outcome.
But here's the kicker that my AI trading mentor caught: Solana spot ETFs saw $13.55M net outflow on December 1, BUT Bitwise's BSOL ETF had $17.18M INFLOW.
What does this mean?
Retail is selling. Institutions are buying. Classic wealth transfer setup.
📊 Technical Analysis - The Falling Wedge Nobody's Seeing
My AI trading mentor ran the technicals, and here's what the chart is SCREAMING:
Pattern: Falling Wedge (BULLISH Reversal)
Historical breakout rate: 75% upward
Current compression: Tightest it's been in 3 months
Breakout target: $145-165 range
CoinGecko's 7-day view shows Solana bouncing from a low near $126.75 on Tuesday to about $141.65, with today's move alone adding roughly $14.64 in 24 hours .
That bounce happened EXACTLY when?
December 3 ONE DAY after Vanguard opened SOL ETFs.
Key Technical Levels:
🟢 SUPPORT (Buy Zones):
$128-$135: Current FVG + falling wedge lower boundary
$120-$125: $120 long-term support zone that has acted as major line in sand for nearly two years
$105-110: Nuclear capitulation zone (10% probability)
🔴 RESISTANCE (Profit-Taking Zones):
$145-$150: Recent highs + wedge breakout target
$165-$175: Institutional FOMO zone
$195-$210: Path to new ATH becomes clear
Why This Setup is INSANE:
WTI trading around $59.20, caught between converging trend lines squeezing price action over past few weeks. Break above triangle resistance could trigger rally.
Wait, that's oil. Let me correct that—SOL is showing the EXACT same compression pattern.
SOL is still about 57% below its all-time high of $295.83 and is only recently rebounding from key $120 long-term support zone.
Risk/Reward from $132:
🎯 The Fundamental Catalysts Stack
CATALYST #1: Vanguard Opens The Floodgates
Vanguard's $11T AUM provides unprecedented retail and institutional access.
But here's what my AI trading mentor calculated: If just 0.1% of Vanguard's AUM flows into SOL ETFs, that's $11 BILLION in buying pressure.
Current SOL market cap? $79 billion.
That would be 14% of the entire market cap as NEW demand.
What would that do to price? You do the math.
CATALYST #2: Institutions Are Going ALL-IN
13 institutions injected $1.72B into Solana treasuries, leveraging 7-8% staking yields.
But here's the part that blew my mind: Sharps Technology and Upexi Inc. lead this trend, allocating $445.4M and $260M, respectively.
These aren't crypto-native firms. These are TRADITIONAL COMPANIES moving into SOL.
FalconX and Wintermute purchased 44,000 SOL worth $8.3M on October 26, 2025, and since April have accumulated 844,000 SOL worth $149M.
Pattern? Institutional accumulation is ACCELERATING, not slowing.
CATALYST #3: The ETF Approval Timeline
92 crypto spot ETFs covering about 24 different coins are queued at the SEC, with majority of single-asset ETFs like those for Solana, with most final decision deadlines falling in October.
Wait, October already passed. What happened?
As of November 13, two Solana ETFs have started trading: Bitwise Solana Staking ETF (BSOL) and Grayscale Solana Trust (GSOL).
SOL ETFs are ALREADY LIVE!
JPMorgan expects Solana ETFs to see about $1.5B in first-year inflows.
That's $1.5B of guaranteed buying pressure over the next 12 months.
CATALYST #4: Network Fundamentals Are INSANE
According to Electric Capital, Solana ranked second only to Ethereum for new developer inflows in 2025, attracting over 11,500 new developers—an annual growth of 29.1%.
More developers = More dApps = More users = Higher demand for SOL.
Solana stays fast and low-cost, with high throughput and low latency. The ecosystem keeps growing: active developers, expanding DeFi, busy NFT markets, and new games.
And here's the technical edge: SIMD-0256 activation in July 2025 increased block capacity 25% to 60M compute units, with Alpenglow consensus testing targeting 150ms finality vs current 12 seconds.
Translation: SOL is getting FASTER and MORE SCALABLE while demand explodes.
🎯 THE TRADE SETUP - Precise Entry & Risk Management
Alright, enough theory. Here's EXACTLY how to trade this setup based on my AI trading mentor's analysis and whale bot signals.
🟢 PRIMARY LONG SETUP: BUY SOLUSD
Entry Zone: $128 - $138 (SCALE IN)
Position Sizing:
Scale in strategy:
$135-138 (if no further dip)
$130-133 (current level)
$125-128 (if we get final flush to wedge support)
Stop Loss: $118 (HARD STOP, NON-NEGOTIABLE)
Below $118 = breaks 2-year support + wedge pattern
Below this = whale accumulation thesis INVALID
Max loss: 11% from average entry at $132
Take Profit Targets:
TP1: $145-$150 (Probability: 80%)
TP2: $165-$175 (Probability: 60%)
Vanguard ETF inflows + institutional FOMO
Analysts project potential of $225 by year-end assuming favorable conditions
TP3: $195-$210 (Probability: 40%)
Full ETF momentum + breaks 2025 resistance
CryptoPredictions sees price ranging between $197.29 and $290.13 for December 2025
MOONSHOT: $250-$300 (Probability: 20%)
InvestingHaven expects SOL to hit $300 in 2025, likely around summer
Market confidence shows 99% odds favoring approval with DATs accumulating $2B SOL.
Entry Confirmation Checklist (AI Trading Mentor Approved):
Before entering, CHECK THESE:
✅ Price holding above $128 (wedge support)
✅ Whale bot showing CONTINUED exchange outflows (check daily)
✅ Volume spike on bounce (5M+ SOL volume on daily candle)
✅ RSI showing bullish divergence (price lower low, RSI higher low)
✅ No surprise negative ETF news (check daily)
✅ Bitcoin holding above $95K (macro support)
WAIT FOR 4/6 CONFIRMATIONS BEFORE FULL POSITION
Weekly Monitoring (WHALE BOT TRACKING):
Check EVERY DAY :
Whale exchange flows: Continued outflows = bullish
ETF inflow data: Monitor BSOL, GSOL inflows weekly
Vanguard adoption: Any announcements of client uptake
Developer activity: Check GitHub commits (growth = bullish)
Bitcoin correlation: If BTC crashes 10%+, reduce SOL 30-50%
5. Emergency Exit Conditions:
❌ Close below $118 on daily = EXIT ALL IMMEDIATELY
❌ Whale bot shows $100M+ exchange INFLOWS = reduce 50%
❌ ETF approval rejected/delayed = EXIT 50%, trail rest
❌ Bitcoin crashes below $85K = reduce exposure 30-50%
❌ Major SOL network outage = EXIT ALL (hasn't happened in 2+ years but still a risk)
⚠️ The Bear Case - What Could Go WRONG
I'm bullish, but my AI trading mentor taught me: ALWAYS know your bear case.
Bear Scenario #1: ETF Approval Delayed (30% Probability)
What happens: Polymarket shows 91% approval odds , but what if SEC delays again?
Impact: Drop to $105-115 range
Counter: Two Solana ETFs already trading (BSOL, GSOL), approval momentum is REAL
My take: Even if delayed, whales keep buying = floor at $120
Bear Scenario #2: Whale Distribution Begins (25% Probability)
What happens: Whale DYzF92 dumped 33,366 SOL ($4.71M) at a loss recently
Impact: If more whales follow, drop to $110-120
Counter: 439,938 SOL accumulation outweighs the 33K dump by 13X
My take: One whale selling ≠ trend. NET whale flow is BULLISH.
Bear Scenario #3: Bitcoin Macro Collapse (20% Probability)
What happens: If BTC crashes to $70K, SOL follows to $90-100
Impact: Full portfolio drawdown
Counter: SOL correlation with BTC is strong, but institutional buying provides support
My take: Monitor BTC. If breaks $90K, cut SOL exposure 50%.
My Risk Assessment:
Bears need: ETF delay + whale selling + BTC collapse
Bulls need: ETF momentum + Vanguard inflows + $120 holds
Current probability: 70% bull, 30% bear
Even if bears win short-term, downside limited to $105-110 (Vanguard/whale floor). But upside? $195-250+ (institutional FOMO).
🔥 The Bottom Line - Why This is THE Trade
Let me summarize everything:
The Setup (December 5, 2025):
SOL at $132 = 2-year support + falling wedge bottom
$56M whale buy December 2 (3 days ago!)
Vanguard opens SOL ETFs December 2 (2 days ago!)
Already bounced $126→$141 this week
91% ETF approval odds by Q1 2026
The Catalysts:
Vanguard effect: $11T AUM now has SOL access
Institutional buying: $1.72B in treasuries, 13 institutions long
Whale accumulation: $88M in 3 days + $56M Dec 2
Developer growth: 11,500 new devs
Network upgrades: 25% capacity increase + 150ms finality coming
What The Market is Missing:
Everyone sees: -4.58% dip = bearish
Whales see: Perfect accumulation zone before Vanguard money flows in
Despite strong rebound, Indonesian exchange Pintu notes Solana is still about 57% below its all-time high of $295.83.
That's not a bug. That's a FEATURE.
We have 57% room to run back to ATH, and we're sitting at 2-year support with $11 TRILLION in new capital about to enter through Vanguard.
🎯 Action Plan - What To Do RIGHT NOW
IF YOU'RE BULLISH (Recommended by AI Trading Mentor):
Set Alerts:
Alert at $128 (aggressive buy - wedge support test)
Alert at $133 (current - scale in point)
Alert at $138 (last entry before breakout)
Alert at $145 (take profit trigger)
IF YOU'RE BEARISH:
Wait for:
Close above $150 with volume (breakout confirmed)
Then enter on $145-148 retest
Safer but worse risk/reward
IF YOU'RE NEUTRAL:
Allocate 3-4% of portfolio (half position)
Enter at $130-135 only
Take profits at $155 (+19%)
This is the "I believe but I'm cautious" play
Final Thoughts - The Truth About This Setup
My AI trading mentor has analyzed thousands of setups.
Here's what I KNOW for certain on December 5, 2025:
✅ 439,938 SOL ($56M) removed from Coinbase Dec 2
✅ Vanguard ($11T) opened SOL ETFs Dec 2
✅ 13 institutions hold $1.72B SOL (1.44% supply)
✅ 91% ETF approval odds on Polymarket
✅ $120 support held for 2 years
✅ Falling wedge = 75% break upward historically
✅ $100B flowed into BTC after ETF approval
Here's what I DON'T know:
Will Vanguard inflows start immediately or take months?
Will whales keep accumulating or start distributing?
Will BTC hold or crash?
Drop a 🟣 if you're buying SOL at $130-135.
Drop a 🤖 if you're using AI to refine and help guide you with setups like this.
Drop a 🐋 if you're following whale accumulation.
Drop a 💰 if you're ready for $

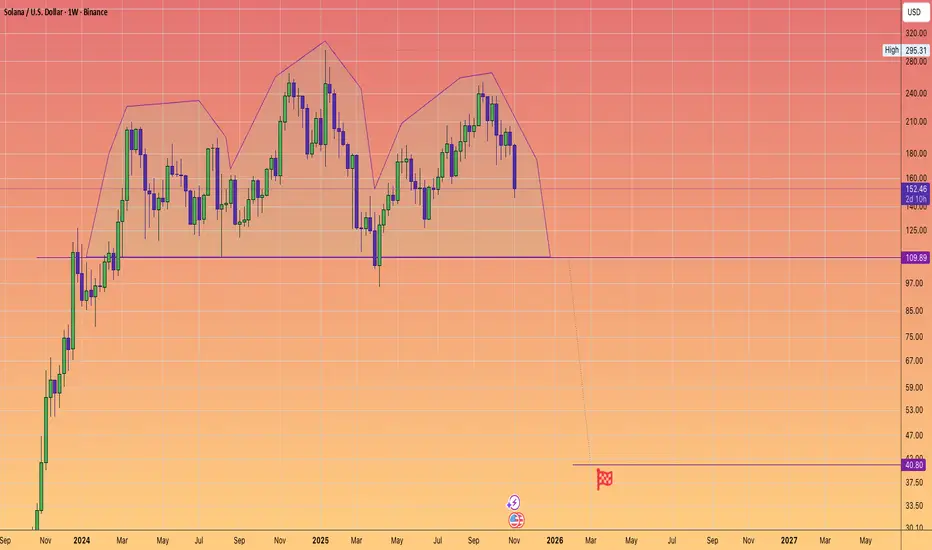
Solana could rapidly fall to $40A massive potential Head and shoulders topping exists on Solana. And many other Altcoins exhibit similar tops.
Keep nimble and protect your gains if you have them.
On the positive side, I believe the bear market will be swift and we could potentially see this number as early as next March.
Why because Solana's network effect topped on the #Trump memecoin release last January.
The solana ecosytem also enjoyed a full cycle of activity unlike other chains.
I believe there will be plenty of buyers at those prices.
SOL 1W – FVG Cleared/Fib Reset Tagged, Is the Reversal Starting?SOL has reached a major confluence area on the weekly chart, tagging the broader Fib Reset Zone and reacting directly from long-term Trendline Support. This is the same structural level that launched previous multi-month rallies, making this an important point for potential reversal.
Price is also sitting just above the 0.618 retracement — historically one of SOL's strongest reaction levels — while the weekly Stoch RSI is emerging from oversold conditions, a signal often seen near macro turning points.
The declining 50/100 EMAs still create overhead pressure, but reclaiming these EMAs would confirm a shift in weekly trend structure and open the door for a broader recovery leg.
If the trendline fails, the lower demand zone becomes the next logical retest. But as long as SOL continues to defend this diagonal and build higher closes inside the Fib Reset Zone, the case for reversing the multi-month downtrend strengthens.
This is one of the most important weekly levels SOL has approached all year.

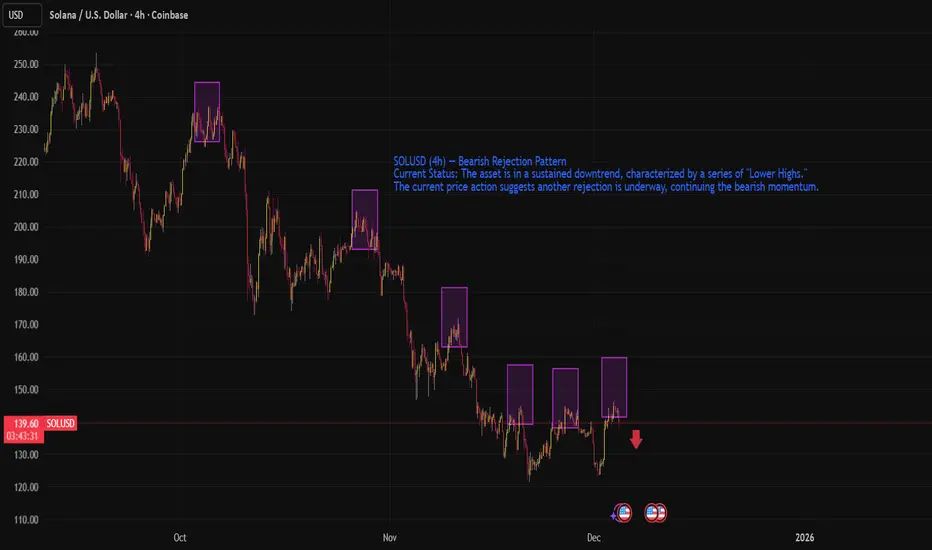
SOLUSD (4h) — Bearish Rejection PatternSOL/USD is in a sustained downtrend, characterized by a series of "Lower Highs." The current price action suggests another rejection is underway, continuing the bearish momentum.
1. Price Action: The "Lower High" Structure
The chart visually highlights (via purple boxes) a classic bearish market structure. Since the high near $240, SOL has failed to reclaim previous peaks.
The Pattern: Each rally attempt (purple box) runs out of momentum at a lower price point than the previous one ($240 -> $210 -> $180 -> $160 -> $140).
Current State: The price recently rallied into the $150-$160 zone (the right-most purple boxes) and is currently reacting negatively, dropping to $139.83.
The current setup suggests a short opportunity as the price rejects off the most recent lower high.
SOLUSD: Breakout from Bottom Structure Inside Downtrend ChannelHi!
SOL has been trading inside a descending channel, consistently respecting both upper and lower boundaries. Recently, price formed a clear Inverse Head & Shoulders at the bottom of the channel, signaling potential bullish reversal momentum. The neckline breakout aligns with the break of the minor descending trendline, strengthening the shift in structure.
If price holds above the neckline, the pattern projects a move toward the 160–165 USD zone, which also aligns with the channel’s upper boundary, a strong confluence area and natural target for bulls.
However, failure to sustain above the neckline could lead to a pullback toward the right-shoulder region, though the setup remains valid as long as price stays above the head level.
Overall, SOL is showing a bullish reversal signal, with upside continuation favored while above the breakout zone.

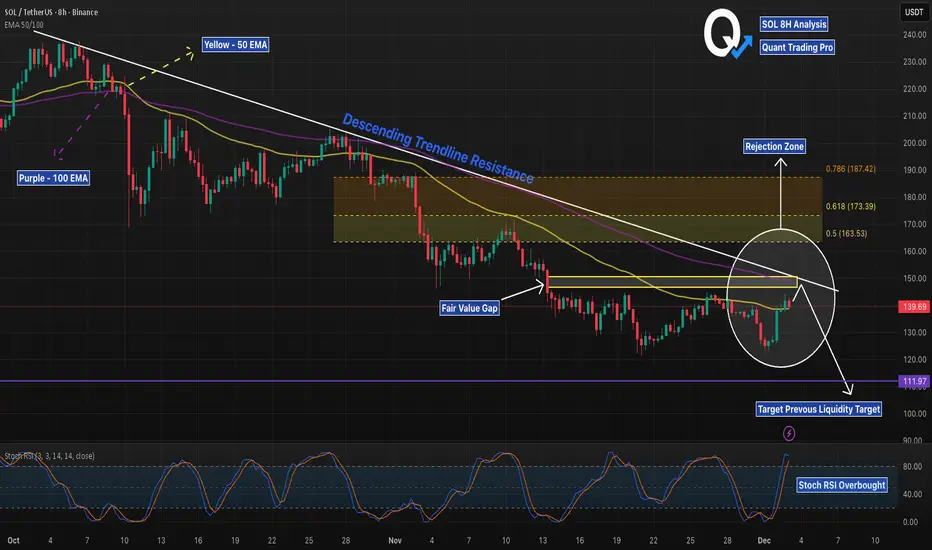
SOL 8H – FVG + EMA Rejection, Liquidity Next?SOL has tapped a clean multi-confluence rejection zone: the descending trendline, the 50/100 EMA cluster, and a filled Fair Value Gap all stack at the same price level. This area has acted as a strong pivot throughout November, and today’s reaction is consistent with prior trendline rejections.
The Stoch RSI is already in overbought territory on the 8H, adding momentum exhaustion to the setup. Bears will watch for continuation toward the major liquidity level around $111.97, which remains untested below.
For bulls to regain control, price must break and hold above the EMA cluster and FVG, flipping the trendline into support. Until then, the path of least resistance remains down toward liquidity.
DeGRAM | SOLUSD is preparing to reach the $160 level📊 Technical Analysis
● SOL rebounded sharply from the major support zone near 130, breaking the inner falling channel and signaling a shift in short-term structure. Price is now forming a bullish continuation pattern beneath dynamic resistance, with room to extend toward the 160 level once the breakout is confirmed.
● Prior triangle, consolidation, and flag formations all resolved downward but now price is rejecting lows more aggressively, indicating accumulation.
💡 Fundamental Analysis
● SOL benefits from rising network activity and renewed inflows into high-performance L1 ecosystems, while broader risk sentiment improves across crypto majors.
✨ Summary
● Bullish bias above 130. Targets: 150 → 160. Support: 130. Resistance: 160.
-------------------
Share your opinion in the comments and support the idea with a like. Thanks for your support!

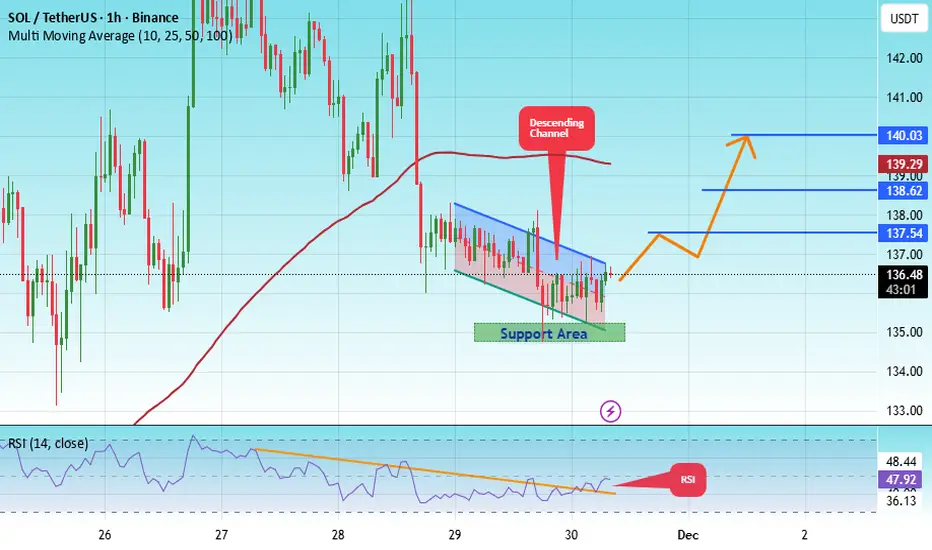
#SOL/USDT Final Liquidity Zone Before Expansion?#SOL
The price is moving in a descending channel on the 1-hour timeframe. It has reached the lower boundary and is heading towards breaking above it, with a retest of the upper boundary expected.
We have a downtrend on the RSI indicator, which has reached near the lower boundary, and an upward rebound is expected.
There is a key support zone in green at 135. The price has bounced from this zone multiple times and is expected to bounce again.
We have a trend towards stability above the 100-period moving average, as we are moving close to it, which supports the upward movement.
Entry price: 136.60
First target: 137
Second target: 138
Third target: 140
Don't forget a simple principle: money management.
Place your stop-loss below the green support zone.
For any questions, please leave a comment.
Thank you.
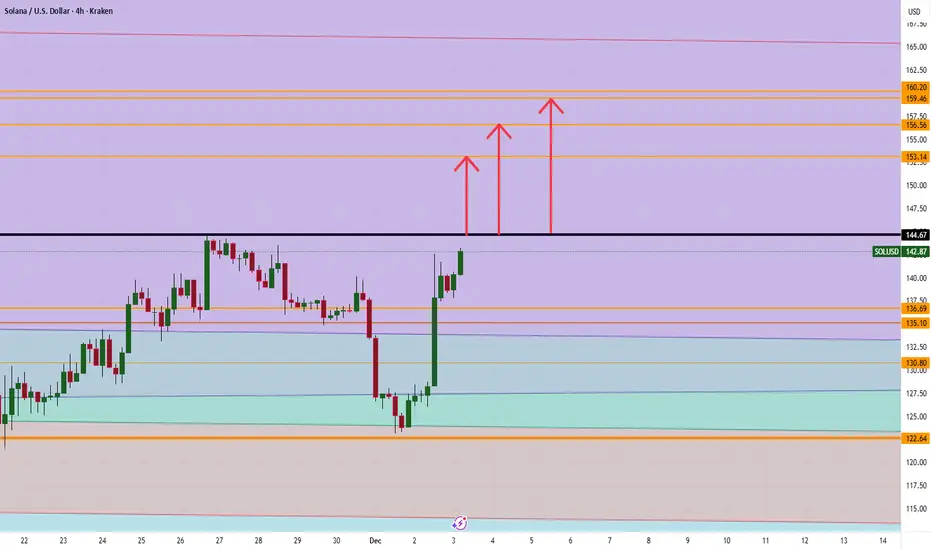
FireHoseReel | All Eyes on Solana at This Critical Level🔥 Welcome to FireHoseReel!
Let’s jump into the Solana (SOL) market structure.
👀 SOL – 4H Overview
After breaking its descending curve structure, SOL faced strong resistance at $144 but failed to break it, leading to a sharp rejection.
Price then formed a double bottom and pushed back toward the same resistance. SOL is now trading near this critical zone once again.
📊 Volume Analysis
Volume increased significantly during the formation of the double bottom, driving a sharp move back toward resistance.
If buy volume remains sustained, the probability of a breakout above $144 increases.
✍️ SOL Trading Scenarios
You can use the following scenarios alongside your own trading strategy:
🟢 Long Scenario (Breakout Setup)
A confirmed breakout above $144, supported by a strong increase in buy volume, could provide a solid long opportunity on SOL.
🟢 Long Scenario (Aggressive Risk Setup)
Wait for price to consolidate, then enter during the pullback with decreasing volume, followed by the first signs of renewed buying pressure.
This setup allows for a tighter stop-loss and faster R:R, suitable for higher-risk traders.
🔴 Short Scenario
A loss of the key support at $124, accompanied by strong sell pressure, could activate a valid short setup for SOL.
❤️ Risk Management & Emotional Discipline
Crypto trading is highly risky. Without proper risk management and emotional control, trading is no different from gambling.
Logic must always come before emotions. Learn to manage your trades, and enjoy the process of trading with control and discipline.

Solana Breakout to 153/156/ and 159 Jump on this MOVE !! Breakout on COINBASE:SOLUSD gets real only if we clear 144.67 with conviction. Above that, the levels to watch are 153, 156, and 159 for potential take profits.
Trade Smarter, Live Better/ Mindbloome Exchange.
If your trading feels stuck or you’re wrestling with a position right now, shoot me a message. Tell me what you’re doing, what’s not working, and I’ll send you a free, specific tweak you can test this week. No fluff, just something you can implement and see if it moves the needle.
SOL — WEEK 49 TREND REPORTSOLUSD — WEEK 49 TREND REPORT
Ticker: COINBASE:SOLUSD — 12/02/2025 @ 139.43$
Timeframe: WEEKLY
This is a reactive structural classification of SOL based on the weekly chart as of this timestamp. Price conditions are evaluated as they stand — nothing here is predictive or forward-assumptive.
⸻
1) Current Trend Condition
• Trend Duration: +8 weeks (Bearish)
• Trend Reversal Level (Bullish): 179.71$
• Trend Reversal Level (Bullish Confirmation): 187.51$
⸻
3) Temperature :
Cooling Phase
⸻
4) Momentum :
Bearish
⸻
Author’s Note
This analysis is fully reactive, not predictive. Market conditions, trend structure, and behavior are classified as they appear in real time. The objective is to identify where directional shifts first occurred, where structural integrity remains intact, and where it would begin to weaken if key levels were breached.
Predictive analysis projects outcomes that do not exist yet. Without price confirmation, prediction is built on baseless assumptions. This framework avoids that entirely by responding only to verified structural changes and live conditions.
The levels shown simply identify where the current trend structure first shifted and where it would begin to lose integrity if breached. Recognizing these boundaries allows for clearer interpretation of market behavior without relying on forward guarantees, speculative projections, or unsupported assumptions.
⸻
Methodology Overview
This classification framework evaluates directional conditions using internal trend-interpretation logic that references price behavior relative to its structural layers. These relationships are used to identify when price movement aligns with the framework’s criteria for directional phases, transition points, or regime shifts. Visual elements or structural labels reflect these internal interpretations, rather than explicit trading signals or preset indicator crossovers. This framework is observational only and does not imply future outcomes.

DeGRAM | SOLUSD will test the strength of the $150 resistance📊 Technical Analysis
● SOL/USD remains inside a broad descending structure with repeated rejections from the dynamic resistance line, preserving bearish dominance.
● Price is approaching the $150 zone, where previous flag and consolidation tops failed, making a reversal toward the $135–$130 support area highly probable.
💡 Fundamental Analysis
● Market rotation out of high-beta altcoins continues as investors reduce exposure amid rising volatility, limiting SOL’s upside potential.
✨ Summary
● Bearish bias below $150. Targets: $135 → $130. Resistance: $150.
-------------------
Share your opinion in the comments and support the idea with a like. Thanks for your support!

her name was solanagm,
i'm projecting a push up on solana to about $400 into 2026.
this is my most conservative target.
---
from the lows of 2022, solana has seen one of the most beautiful impulses in the whole market,
the only impulse that was cleaner is probably bitcoin.
---
between june 2023, and march 2024 i believe solana played on a 3rd wave
between march 2024, and april 2025, i believe solana played out an expanded flat w4
everything after is building either an ending diagonal for the final 5th,
or
a potential extended 5th.
---
$400 is the low end for the final 5th, especially if we play out an ending diag.
$549 - $876 is the high end, if solana decides to play out an extended 5th
