#SOL/USDT — Critical Retest at Demand Zone vs Long-Term Downtr#SOL
The price is moving within an ascending channel on the 1-hour timeframe and is adhering to it well. It is poised to break out strongly and retest the channel.
We have a downtrend line on the RSI indicator that is about to break and retest, which supports the upward move.
There is a key support zone in green at the 158 price, representing a strong support point.
We have a trend to stabilize above the 100-period moving average.
Entry price: 159
First target: 161
Second target: 164
Third target: 168
Don't forget a simple money management tip:
Place your stop-loss order below the green support zone.
Once you reach the first target, save some money and then change your stop-loss order to an entry order.
For any questions, please leave a comment.
Thank you.
SOLUSD

SOLUSD⬆️ Buy Range: 156.100 - 153.000
⏹️ Stop Loss: 140.000
*️⃣ Take Profit: 172.800 - 179.000
🔠 Upward movement from medium-term support.

Bitcoin, Ether and SolanaBITSTAMP:BTCUSD
COINBASE:SOLUSD
COINBASE:ETHUSD
Looking for this on the crypto market. Bullish narrative across the arena

Important range: 161.79-163.73
Hello, traders!
Follow us to get the latest information quickly.
Have a great day!
-------------------------------------
(SOLUSDT 1D chart)
The HA-Low indicator, the DOM(-60) indicator, and the M-Signal indicator are forming around 161.79-163.73.
Therefore, the key is whether the price can break above the 161.79-163.73 level.
To continue the uptrend by breaking above this key point or level, the StochRSI, TC (Trend Check), and OBV indicators must show upward trends.
- The StochRSI indicator should not have entered the overbought zone.
- The TC (Trend Check) indicator should remain above zero.
- The OBV indicator should remain above the High Line.
Currently, the OBV indicator is near the Low Line, and is in a reversed state with OBV < EMA 2 and EMA 1.
Therefore, if the price breaks above the 161.79-163.73 level, we need to watch for a reversal where OBV > EMA2 and EMA1.
The StochRSI indicator appears to be rising from the oversold zone, and appears to have shifted to a K > D state.
The TC (Trend Check) indicator is trending upward, but since it's below the 0 level, we can see that selling pressure still dominates.
Therefore, if the TC indicator breaks above the 161.79-163.73 level, we should also check to see if it can rise above the 0 level.
If it fails to rise above the 161.79-163.73 level, we should check for support around 126.36.
Since the HA-Low indicator has been created, even if it shows a stepwise downward trend, it is expected to eventually turn upward.
Therefore, we should focus on finding the right time to buy.
-
Thank you for reading to the end.
I wish you successful trading.
--------------------------------------------------

Long SolanaTrading Fam,
Received a buy signal from my indicator on Solana the other day. Inside a nice liquidity block, above the 200/350 SMA, and inside a bullish triangle. I'll easily take this trade all day. But with the crypto market continually disappointing, I am not going to risk more than an 8% loss here. Shooting for a target of around 32% profits brings my rrr to a 1:4. Best of luck!
✌️Stew

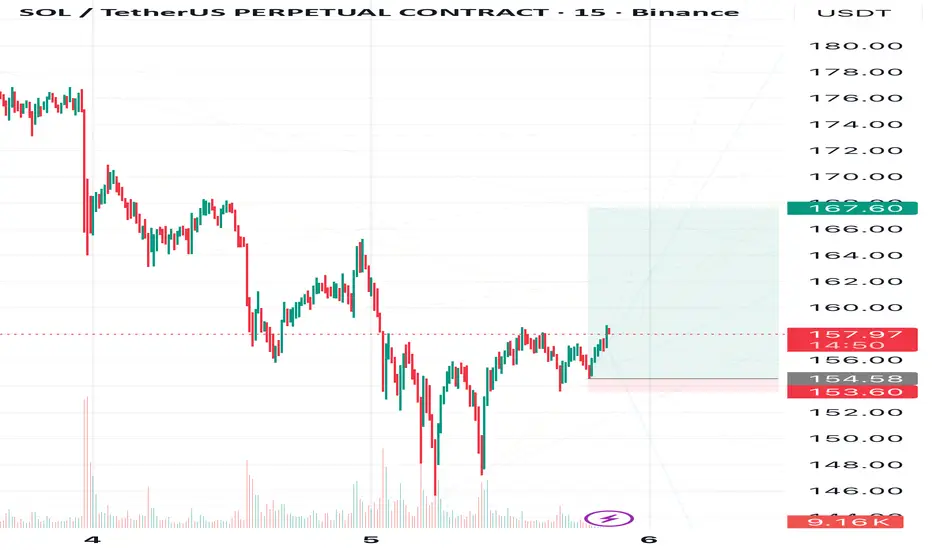
Solana’s pause after the causeHi friends!
How are you doing after the recent Bitcoin–Solana drop?
I hope you didn’t lose anything — and maybe even managed to make some profit instead! 💪
📉 My next targets on the downside are around $144 and $124, but at the moment, Solana seems to be taking a breather from the fall.
After a long and deep decline, even below my earlier expectations, Solana is finally showing some signs of a small correction to 167,60 📈
🎯Target - 167,60
❌Invalidation zone are marked on the chart - 153,60
💬 What do you think — is this the start of a reversal, or just a short pause before another move down? Share your thoughts in the comments. I always enjoy reading your views!
🔔 Follow me to stay updated on Solana and other crypto market analyses.
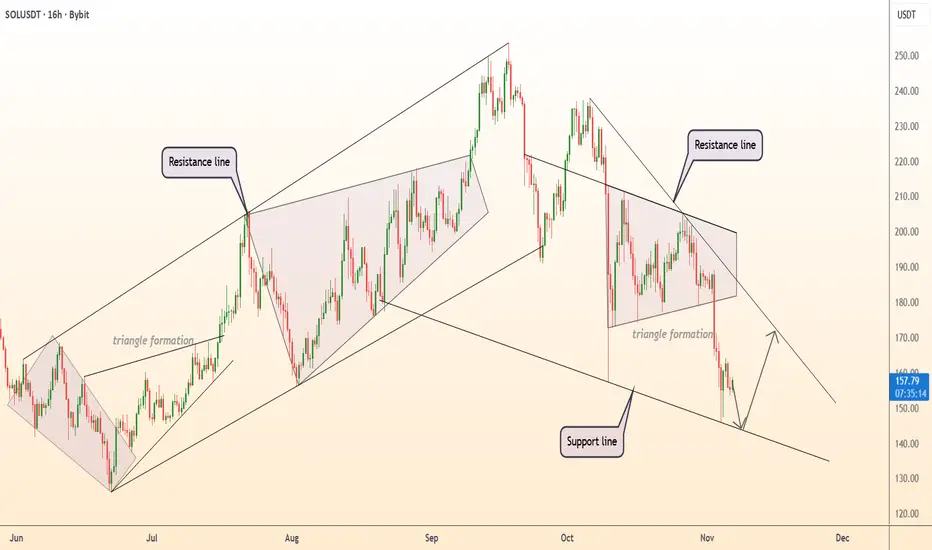
DeGRAM | SOLUSD will test the support line📊 Technical Analysis
● SOL/USD is testing the lower boundary of the descending channel near $150, a key support aligning with the broader bullish trendline from June. The pattern suggests a potential rebound within the channel toward $175–$180 resistance.
● Multiple triangle formations indicate prior consolidation phases before upward moves, reinforcing the likelihood of another medium-term recovery if support holds.
💡 Fundamental Analysis
● Growing institutional activity in Solana’s DeFi and NFT ecosystems continues to support long-term investor confidence, despite short-term volatility.
✨ Summary
● Support: $150. Resistance: $175–$180. A sustained bounce from the lower trendline could trigger a rally toward $190.
-------------------
Share your opinion in the comments and support the idea with a like. Thanks for your support!
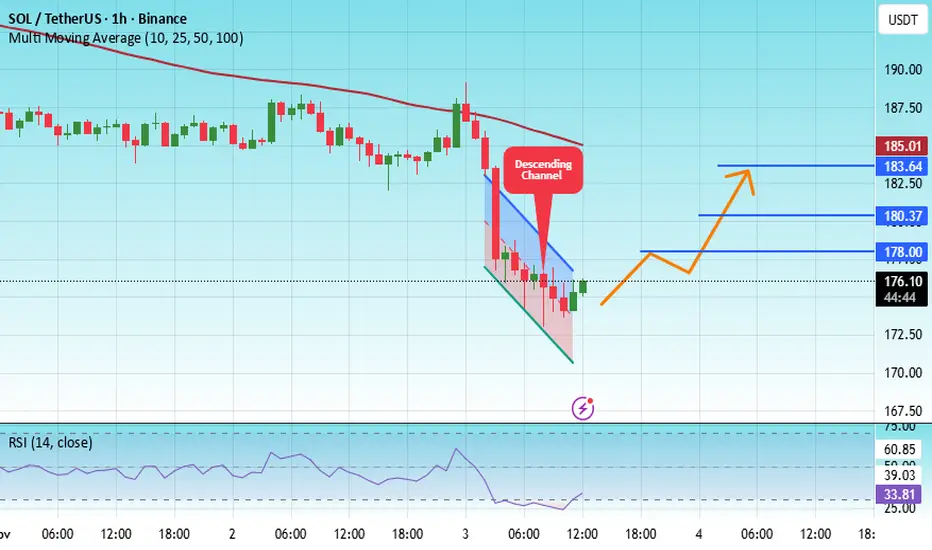
#SOL/USDT The Next Explosion, Hidden Clues in Price Behavior
#SOL
The price is moving within an ascending channel on the 1-hour timeframe and is adhering to it well. It is poised to break out strongly and retest the channel.
We have a downtrend line on the RSI indicator that is about to break and retest, which supports the upward move.
There is a key support zone in green at 172.80, representing a strong support point.
We have a trend to stabilize above the 100-period moving average.
Entry price: 175.50
First target: 178
Second target: 180
Third target: 183
Don't forget a simple money management rule:
Place your stop-loss order below the support zone in green.
Once the first target is reached, save some money and then change your stop-loss order to an entry order.
For any questions, please leave a comment.
Thank you.
SOLANA HIGH PROBABILITY SETUPS SOON!!!🚨 SOL HIGH PROBABILITY SELL/BUY SETUP 🚨
* Here We Can See Clearly The Next Potential Moves For SOLUSD Coming Hours/Days.
* Keep Your Eyes Close On Your Trading Positions.
* Happy PIP Hunting Traders.
FXKILLA.

SOLUSD H4 | Bearish Drop-Off in MomentumSOL/USD has rejected off the sell entry which is an overlap resistance that aligns with the 50% Fibonacci retracemnt and could drop from this level to the downside.
Sell entry is at 204.97, whichis an overlap resistance that aligns with the 50% Fibonacci retracemnt.
Stop loss is at 221.25, whichis a pullback resistance that is slightly below the 78.6% Fibonacci retracement.
Take profit is at 174.91, whichis a swing low support.
Stratos Markets Limited (tradu.com ):
CFDs are complex instruments and come with a high risk of losing money rapidly due to leverage. 68% of retail investor accounts lose money when trading CFDs with this provider. You should consider whether you understand how CFDs work and whether you can afford to take the high risk of losing your money.
Stratos Europe Ltd (tradu.com ):
CFDs are complex instruments and come with a high risk of losing money rapidly due to leverage. 70% of retail investor accounts lose money when trading CFDs with this provider. You should consider whether you understand how CFDs work and whether you can afford to take the high risk of losing your money.

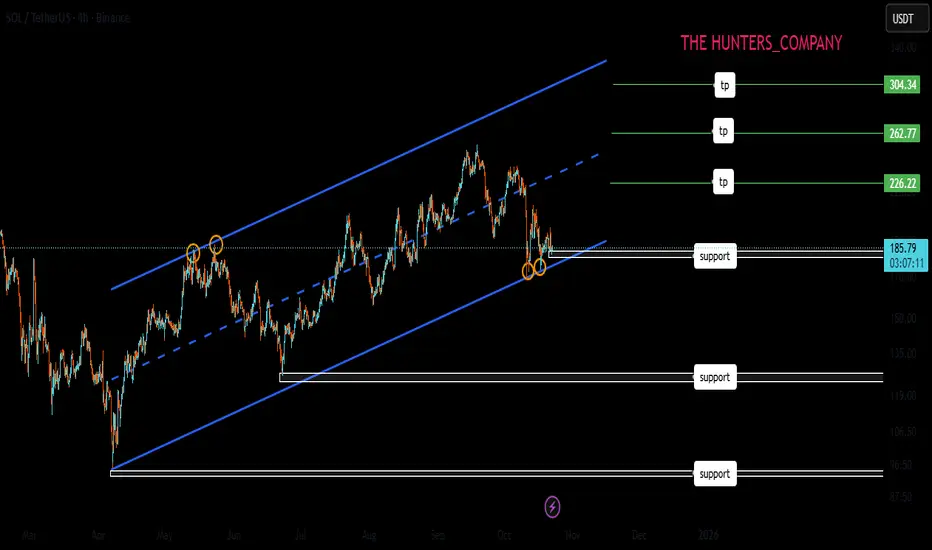
Solana – Saucer Pattern & Key Resistance in FocusSolana is starting to stand out with notable relative strength versus both Bitcoin and Ethereum, and it's catching my attention this week.
✅ Key Support Holding:
Price recently held firm at the $185–$190 support zone, bouncing with strength and attempting to establish a higher low. If this level holds, it would further confirm the uptrend in place since April.
📉 Corrective Phase Since September:
Despite the pullback, the larger trend structure remains bullish. A break above the September high is still needed to confirm trend continuation.
🔵 Multi-Month Saucer Formation:
A rounded base is developing on the daily chart—a classic saucer bottom. If confirmed, this pattern points to major upside potential, with a projected move possibly targeting $500 over time.
⚠️ Watch This Zone Closely:
The $250–$260 resistance area is the key overhead level to clear. A decisive breakout here could trigger a strong rally and confirm the saucer breakout.
📌 Summary:
Solana is showing resilience, building a bullish structure, and forming a significant base. If momentum builds above $260, bulls may take control in a big way.

$SOL Solana is sandwiched between the nearly 4-year resistance level of 2021's ATH and the approaching 3-year uptrend.
A squeeze lasting this long typically ends not with a minor breakout but with a major blowout.

SOLUSDTI think have this chart of BINANCE:SOLUSDT buy because breakout trendline and i see order-block in 194$. Target is end measured move (2-Leg) from low latest swing in 208$.
Please control your risk in any position.

(b) Wave Retracement Almost CompleteEarlier, I had some concern that this (b) wave might be concluding too quickly relative to the preceding (a) wave.
While time symmetry isn’t a strict requirement in Elliott Wave analysis, there are moments when a pattern’s timing simply doesn’t pass the “smell test.”
Now, however, we’re seeing price retrace higher in a manner that better aligns with the duration of wave (a). With price currently sitting just below the (b) wave target box, I’m expecting it to enter that zone imminently to complete this (b) wave retracement.
A subsequent move to a new local low will serve to confirm my analysis.

SOLANA (SOLUSD): High Chance for a Rise
There is a high probability that Solana will continue rising
after a confirmed breakout of a key daily resistance.
The next key structure is 208.8 level.
I think it will be reached soon.
❤️Please, support my work with like, thank you!❤️

SOLUSD | Approaching Major Resistance LevelSOL/USD is rising towards the sell entry, which is an overlap resistance and could reverse from this level to the downside.
Sell entry is at 198.22, which is an overlap resistance.
Stop loss is at 206.24, which is a swing high resistance that aligns with the 138.2% Fibonacci extension.
Take profit is at 187.02, which is an overlap support.
Stratos Markets Limited (tradu.com ):
CFDs are complex instruments and come with a high risk of losing money rapidly due to leverage. 68% of retail investor accounts lose money when trading CFDs with this provider. You should consider whether you understand how CFDs work and whether you can afford to take the high risk of losing your money.
Stratos Europe Ltd (thttps://tradu.com/eu ):
CFDs are complex instruments and come with a high risk of losing money rapidly due to leverage. 70% of retail investor accounts lose money when trading CFDs with this provider. You should consider whether you understand how CFDs work and whether you can afford to take the high risk of losing your money.

SOLUSDT.P - October 26, 2025Based on the 4-hour chart, the price appears to be consolidating within a triangle after a sharp decline. A long bias is supported by the potential for a breakout above the upper trendline.

SOL at Support, History Could Repeat$SOL/USDT Analysis
SOL continues to respect its long-term rising support line beautifully. Each time it has accumulated around this trendline, we’ve seen a strong rally follow, and the same pattern seems to be forming again.
Right now, SOL is in another accumulation phase, holding well above the key support zone. If history repeats itself and the price sustains this level, we could see another explosive move toward new highs.
DYOR, NFA
Thanks for reading! Appreciate your support and engagement 🙏

Solana - We have to see new all time highs!🚀Solana ( CRYPTO:SOLUSD ) has to break out:
🔎Analysis summary:
Over the course of the past couple of months, Solana has been rallying another +100%. This rally ultimately resulted in another, third retested of the previous all time high. And if Solana now creates bullish confirmation, we can all expect new all time highs very soon.
📝Levels to watch:
$250
SwingTraderPhil
SwingTrading.Simplified. | Investing.Simplified. | #LONGTERMVISION

Is A Bullish Crossover Next For Solana Price?Solana’s price stands at $187 at the time of writing, holding firm above the $183 support level. The altcoin remains range-bound, struggling to break through the key $192 resistance. However, price stability above support suggests growing resilience in the face of selling pressure.
If Solana’s bullish indicators gain traction, the price could climb past $192 and target $200 or higher. Strengthening support levels combined with improving investor sentiment could help SOL establish a sustainable uptrend.
Conversely, if momentum fails to build, Solana may drop below $183 to test $175. A further decline could extend losses toward $163. This would effectively invalidating the bullish outlook and signaling continued market weakness.

SOLUSD H1 | Bearish Reversal from Pullback ResistanceSOL/USD is rising towards the sell entry which is a pullback resistance that aligns with the 61.8% Fibonacci retracement and could reverse from this level to the downside.
Sell entry is at 190.50, which is a pullback resistance that aligns with the 61.8% Fibonacci retracement.
Stop loss is at 198.02, which is an overlap resistance.
Take profit is at 175.45, which is a swing low support.
Stratos Markets Limited (tradu.com ):
CFDs are complex instruments and come with a high risk of losing money rapidly due to leverage. 68% of retail investor accounts lose money when trading CFDs with this provider. You should consider whether you understand how CFDs work and whether you can afford to take the high risk of losing your money.
Stratos Europe Ltd (tradu.com ):
CFDs are complex instruments and come with a high risk of losing money rapidly due to leverage. 70% of retail investor accounts lose money when trading CFDs with this provider. You should consider whether you understand how CFDs work and whether you can afford to take the high risk of losing your money.

SOLUSDT.P - October 22, 2025Price is attempting a short-term rebound from the 183.13-180.23 range after an extended decline, forming a potential counter-trend setup targeting multiple profit levels near 189.9, 192.0, 194.3, and 197.6. However, volatility remains high amid Trump's tariff narrative, making this a high-risk play that requires tight stop management and active monitoring.

SOL ; What can be done?Hello friends
Given the decline we had, the price has been moving in an ascending channel for some time now, and now that the price is at the bottom of the channel and is on an important move, we can buy one step with risk and capital management, and in case of further correction, we can buy another two steps down and move with it to the specified targets.
*Trade safely with us*