TOP Altcoins for 2026 ~ ALTSHappy New Year 🥂
Here's a quick glance at my TOP 5 alts of choice for 2026, and why.
💭Injective (INJ)
Fast, interoperable DeFi infrastructure. Active development and a clear use-case in scaling decentralized trading.
💭Illuvium (ILV)
Prioritizes high-quality gameplay and steady development, backed by a solid revenue model.
💭Solana
ETH competitor, SOL is approaching some great buy zones that can have big bounces:
💭Origin Protocol (OGN)
Focuses on tokenized commerce and NFT marketplaces, making it easy for creators and brands to build decentralized storefronts.
💭Audius (AUDIO)
Decentralized music-streaming platform giving artists more control and growing consistently in real-world adoption.
Which alts are you watching for this year?
Solusdt

SOL M30 Previous Low Liquidity Sweep and Bullish Reversion Setup📝 Description
SOL on M30 has swept the previous low liquidity (SSL) and immediately showed a strong reaction, indicating liquidity collection rather than bearish continuation. With sell-side now cleared, price has the fuel needed for a bullish rotation toward higher levels and nearby imbalances.
________________________________________
📈 Signal / Analysis
Primary Bias: Bullish after SSL sweep
Long Setup (Preferred):
• Entry (Buy): 135.5
• Stop Loss: Below 133.8
• TP1: 136.96
• TP2: 137.97
• TP3: 139.5 (upper liquidity)
________________________________________
🎯 ICT & SMC Notes
• Previous low liquidity swept (SSL)
• Sharp reaction confirms sell-side raid
• H1 / 30M FVGs acting as upside draw
________________________________________
🧩 Summary
With sell-side liquidity cleared, SOL now has room to rebalance higher. As long as price holds above the sweep low, the higher-probability path is a move toward 137–139 liquidity.
________________________________________
🌍 Fundamental Notes / Sentiment
No immediate negative catalysts for SOL. In a neutral-to-stable market, post-liquidity sweep bounces tend to resolve to the upside. Manage risk and scale out at targets
________________________________________
⚠️ Risk Disclosure
Trading involves substantial risk and may result in capital loss. This analysis is for educational purposes only and does not constitute financial advice. Always apply proper risk management, predefined stop-loss levels, and disciplined position sizing aligned with your trading plan.

SOLANA road map (daily) !After the drop, the price can slightly bounce back up if buyers support it and we have a price correction. If the red trendline is broken, the price can move to the ranges we have specified.

#SOL/USDT may continue its trend after correction#SOL
The price is moving in a descending channel on the 1-hour timeframe. It has reached the upper limit and is heading towards breaking it. A retest of the upper limit is expected.
We have an upward trend on the RSI indicator, which has reached near the upper limit. A downward reversal is expected.
There is a key support zone in green at 139.70. The price has bounced from this zone multiple times and is expected to bounce again.
We have a trend of consolidation above the 100-period moving average, as we are moving close to it. This supports a downward move towards touching this level.
Entry price: 137.70
First target: 136.15
Second target: 135.09
Third target: 133.66
Stop loss above the resistance zone in green.
Don't forget a simple thing: money management.
For inquiries, please leave a comment.
Thank you.

Coinranger|SOLUSDT. Big potential reversal from 141News at 16:15 PM and 18:00 UTC+3 could add volatility.
🔹Solana has reached exactly the first extension at 141 on h4. And this is a serious point for a potential reversal.
1️⃣I'll leave 141 above as a reminder of micro rally.
2️⃣ A set of downward waves with potential extensions: 131, 130, 125, 120.
We'll likely move to 130 today or tomorrow.

SOL - tiny upward wiggle detected Alright folks, here’s the tea: BTC is still dreaming of that sweet 100K, and I’m not planning any panic moves downward… but hey, the market can be spicy, so don’t quote me.
SOL, on the other hand, looks like that snack you didn’t know was in the fridge—juicy and ready to be devoured. 🥤
• Support is chilling right beneath us like a comfy couch.
• Quick bounce off the 50 EMA, because SOL apparently likes to stretch in the morning.
Could this work? Maybe. Could it go sideways like my motivation on Monday? Also maybe.
TL;DR: SOL doing a mini dance, BTC still dreaming big, and we all hold onto hope (and stop-losses). 💃📈

SOL/USDT | Back to the demand zone (READ THE CAPTION)As you can see in the 4H chart of SOLUSDT, After an initial run to 143.48 level, Solana has dropped in price again, reaching the demand zone it was stuck to for a matter of weeks at 133.79 level, it is currently being traded at 134.80, barely above the demand zone.
It is expected for it to retest the IFVG.
For the time being, Bullish targets: 136, 137.20, 138.40 and 139.60.
Bearish targets: 133.80, 132.65, 131,50 and 130.35.

ETHUSD: accumulation at $3,200🛠 Technical Analysis: On the H4 chart, ETHUSD is consolidating under a descending resistance trendline while building an accumulation range around the $3,200 area. The recent impulse higher was rejected at resistance, but price is still holding above the key moving-average cluster (SMA50/100/200), suggesting buyers are defending the structure. A clean breakout and acceptance above the nearby resistance level at $3,281.18 would confirm bullish continuation and open the path toward the next marked supply zone.
———————————————
❗️ Trade Parameters (BUY)
———————————————
➡️ Entry Point: Buy on a confirmed breakout and hold above 3,281.18
🎯 Take Profit: 3,622.98
🔴 Stop Loss: 3,054.07
⚠️ Disclaimer: This is a potential trade idea based on current analysis; market conditions and price direction are subject to change based on news factors and volatility.

SOLANA OBAMA - pamp itSOLANA OBAMA - pamp it
levels to watch for in case we are just being bull trapped
basically ; if the price action ledges out here and then pukes ,, well ya know whats up and wait for red fractal tripple bottom to try to buy again with tight stop. but those two negative options suck pretty bad, would be a multi year bear again. just accumulate btc if thats the case as we've seen the obvious change in the ALT market.
or
valhalla awaits us. and the whole 'alt season is dead' trap was sprung very well.
this cycle has been hard. gl

SOL/USDT | Continuing the trend? (READ THE CAPTION)By analysing the 4H chart of SOLUSDT, we can see that After weeks of struggling with the Demand Zone, not being able to break through it, Solana has finally gone out of there. It went on to just over $140 and it is currently being traded at 137.70 level, just above the IFVG High, it may touch the high of it again and then going higher.
There's relative equal highs here as I have pinpointed, and I believe that eventually Solana will take over them by reaching the $147.
For the time being, the targets are: 140, 143, 146 and 147.

#SOL/USDT Final Liquidity Zone Before Expansion ?#SOL
The price is moving in a descending channel on the 1-hour timeframe. It has reached the lower boundary and is heading towards a breakout, with a retest of the upper boundary expected.
We are seeing a bearish bias in the Relative Strength Index (RSI), which has reached near the lower boundary, and an upward bounce is expected.
There is a key support zone in green at 128, and the price has bounced from this level several times. Another bounce is expected.
We are seeing a trend towards stabilizing above the 100-period moving average, which we are approaching, supporting the upward trend.
Entry Price: 133
First Target: 134
Second Target: 137
Third Target: 140
Remember a simple principle: Money Management.
Place your stop-loss order below the green support zone.
For any questions, please leave a comment.
Thank you.

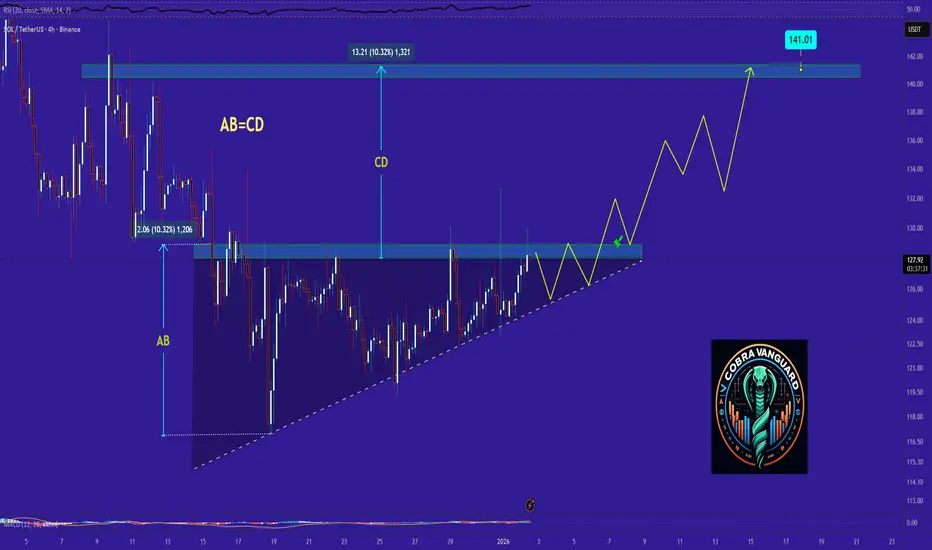
SOL road map (4h) !The price on the 4h timeframe is within an ascending triangle, which can be promising. If the price breaks this pattern with bullish candles, it could easily rise by the distance of AB=CD.
Best regards CobraVanguard.💚
Give me some energy !!
✨We spend hours finding potential opportunities and writing useful ideas, we would be happy if you support us.
Best regards CobraVanguard.💚
SOLUSDT.P The short-term structure of Solana is worth attention for scalpers, as it may offer a setup suitable for short positions.
NFA

SOLUSDT | Finally breaking through? (READ THE CAPTION)Solana finally made a small upwards move, barely getting through the demand zone it has been stuck in for a long while. After going out a little bit, it fell in the demand zone again, but it is now being traded at 134, which is slightly in the Demand Zone. I expect Solana to make it out of that zone and going to test the low of the FVG at 135.43.
Targets for Solana: 136, 137.50 and 139.

SOLUSDT | Bullish Structure. Pending RetracementHello traders,
As you can see on the chart price fall into a descending channel from early Dec, 2025. A confirmed breakout was followed by a consolidation/accumulation phase. Followed by a bullish market structure shift.
Currently, price is extended from the breakout leg. For continuation, I believe a corrective move driven by a liquidity sweep is likely to rebalance price before the next expansion higher.
Two key bullish order blocks I look for:
$130 Consistent with a shallow pullback.
$125 A deeper retracement but still structurally valid.
This bullish thesis is invalidated on a decisive break and close below $122 with impulsive bearish displacement.
Good Luck!
All our analysis is shared with honesty, care, and real effort. If you find value in it, a like or comment means a lot to show your support🙏📊

Solana’s Not Done Yet — Hitting 136 Soon?🚀 Solana Update | TF 15M
Hey everyone! 👋
In my previous post, my targets were:
🎯 127.50 & 130
Before SOL reached the first target, it dipped slightly below my old cancellation zone. But that didn’t break the long picture it actually strengthened it 💪.
🔥🎯New targets:
➡️ 132
➡️ 135
➡️ 136 😎
❌New cancellation zone: 126.85
Two possible scenarios for this move:
🟢 Green arrow path
🟣 Purple arrow path
⚠️ Disclaimer: Not financial advice — just my personal view. Trade responsibly!
💖 If you like this, hit follow & react to support! Every ❤️ helps!

SOLUSDT | Solana is coming back? (READ THE CAPTION)Hello folks, Amirali here, hope you're having a great day.
By examining the 6H chart of SOLUSDT we can see that after days of struggling below the Demand Zone, it made a move last night all the way to the high of demand zone and it is now being traded at 130.50. I expect Solana to test the high of the Demand Zone again. For the time being the targets are: 131.60, 133.25 and 134.85.

Solana going up? Solana on a weekly support with some recent bullish momentum. With the recent political uncertainty, I can see cryptos rising some.
Long Solana?

SOLUSDT 4hr – Trade idea Price is currently trading inside a range after a strong impulsive move down.
We are seeing multiple fair value gaps below and above, indicating unfinished business on both sides.
Context
Overall structure remains bearish
Price is consolidating near local support
Liquidity has been swept to the downside
Bullish idea
If price holds this support and reclaims the local fair value gap, a move towards the higher timeframe imbalance becomes likely.
Bearish idea
Failure to hold this area could lead to a continuation into the lower fair value gap, completing the downside move.
Are you expecting a range expansion up or further downside first?
MrC

Solana (SOL) — 15m Local Bullish StructureHello, friends!
How did you celebrate the New Year? 🎉
I wish everyone a productive and profitable 2026!
I haven’t posted ideas on TradingView for a few weeks, but I’ve decided that starting from the very first day of 2026, I’ll be sharing ideas daily.
So here is my first one:
Despite my previous bearish outlook, Solana looks quite positive on the local timeframe right now 🐂
After a small pullback to the 124.76 area, I’m considering long positions.
🎯 Targets:
• 127.5
• 130
❌ Invalidation:
Any touch of 124.69 fully invalidates this setup.
As always, manage your risk and stay tuned for updates. 🚀

SOLANA (SOL) ANALYSIS: 3 MODELS TO TRADE THE SWEEP & BREAKOUTMARKET STRUCTURE & ANALYSIS
Solana (SOL) has been trading within a defined accumulation range. We are currently sitting in the middle "no-trade zone," waiting for a decisive move.
Smart money often hunts for liquidity before the real move begins. We have identified a High Time Frame (HTF) Sweep Zone & Order Block (Green Box) below us, and a breakout level above us.
Here are the 3 SPECIFIC MODELS to trade this setup, depending on your risk tolerance:
MODEL 1: ENTRY AT OB (HIGH RISK, HIGH REWARD) The Sniper Approach
This is the aggressive entry for traders who want the best possible price.
The Plan: Set limit orders directly inside the HTF Sweep Zone / Bullish Order Block (Green Box)
The Logic: You are "catching the knife" based on strong institutional demand in this area.
Risk: Price could continue lower. This model requires a strict Stop Loss but offers the massive Risk-to-Reward (R:R) potential.
MODEL 2: WAIT FOR THE SWEEP & TAKE ENTRY (CONSERVATIVE) The Confirmation Approach
This is the safer alternative to Model 1.
The Plan: Let the price drop into the Green Box to sweep liquidity. Do not buy yet.
The Trigger: Wait for the price to pump back up and close a 4H candle back inside the range (reclaiming the support level).
Entry: Enter on the close of that reclamation candle.
Logic: This confirms that the dip was just a "bear trap" and buyers have stepped back in.
MODEL 3: LONG AFTER BREAKOUT & RETEST (CONTINUATION) The Momentum Approach
This model plays the breakout of the upper resistance (White Line, ~$148).
The Plan: Wait for price to break clearly above the resistance.
The Trigger: Wait for a SUCCESSFUL RETEST. Price must come down, touch the old resistance, turn it into support, and bounce.
Entry: Long the bounce after the retest holds.
CRITICAL WARNING: THE "TOP LIQUIDITY SWEEP" TRAP Do not get trapped here.
Model 3 has a specific danger: The Fakeout. If price breaks above the resistance but FAILS to hold the retest (i.e., it crashes back down into the range), this was NOT a breakout. It was a Top Liquidity Sweep (a trap to catch early longs).
Rule: If the retest fails, Model 3 is invalid. Do not FOMO long at the highs without confirmation.
SUMMARY
Aggressive? Use Model 1 in the Green Box.
Conservative? Use Model 2 and wait for the reclaim.
Momentum? Use Model 3 but ONLY if the retest holds.
Which model fits your style? Let me know in the comments!
Disclaimer: This analysis is for educational purposes only. Cryptocurrency trading involves high risk. Always manage your risk properly.

SOL/USDT – Accumulation or Continuation? Key Support!SOL/USDT on the 8-hour timeframe is still moving within a bearish corrective structure / broader downtrend, characterized by a series of lower highs and lower lows since the rejection from the 230+ area.
Currently, price is trading inside a strong historical demand zone at 127–121, which previously acted as a major accumulation and bounce area.
Price is now consolidating above this demand zone while pressing against a descending trendline, making this area a critical decision zone for the next major move.
---
Pattern & Price Structure
1. Descending Trendline (Bearish Pressure)
The descending trendline remains valid and unbroken
Each recovery move continues to be capped by this trendline
Indicates seller dominance is still present
2. Demand Zone / Support Base (127 – 121)
The yellow box marks a strong demand zone
Multiple lower-wick rejections indicate active buying interest
Price is forming a base / consolidation range above support
3. Compression Pattern (Range Tightening)
Price is compressed between:
Dynamic resistance (descending trendline)
Static support (demand zone)
This structure often leads to a high-momentum breakout
---
Key Levels
Dynamic Resistance: Descending trendline
Horizontal Resistances:
144
154.5
167
177
Major Support:
127
121
Invalidation Level:
Strong close below 121
---
Bullish Scenario
The bullish scenario is valid if:
1. Price holds above the 127–121 demand zone
2. A strong candle close breaks above the descending trendline
3. Volume expansion confirms the breakout
Upside Targets:
144 (minor resistance)
154.5 (key reaction level)
167 (mid-range resistance)
177 (major resistance)
A confirmed breakout above the trendline may signal a trend reversal or bullish continuation from a base structure.
---
Bearish Scenario
The bearish scenario occurs if:
1. Price fails to break the descending trendline
2. A strong breakdown and close below 121
3. The demand zone fails to absorb selling pressure
Downside Risk:
116.8 (previous low)
Further downside could form new lower lows, continuing the broader bearish trend
---
Conclusion
SOL/USDT is currently at a critical decision area.
The 127–121 demand zone is the key level to watch:
Holding support + trendline breakout → bullish reversal potential
Demand breakdown → bearish continuation
Patience is required. Wait for clear breakout or breakdown confirmation before committing to a directional trade.
---
#SOLUSDT #Solana #CryptoAnalysis #TechnicalAnalysis #DescendingTrendline #DemandZone #SupportResistance #AltcoinTrading #CryptoMarket

#SOL/USDT Final Liquidity Zone Before Expansion ?#SOL
The price is moving in a descending channel on the 1-hour timeframe. It has reached the lower boundary and is heading towards breaking above it, with a retest of the upper boundary expected.
We have a downtrend on the RSI indicator, which has reached near the lower boundary, and an upward rebound is expected.
There is a key support zone in green at 122.00. The price has bounced from this level multiple times and is expected to bounce again.
We have a trend towards stability above the 100-period moving average, as we are moving close to it, which supports the upward movement.
Entry price: 124.00
First target: 125.48
Second target: 127.15
Third target: 129.63
Stop loss: Below the support zone in green.
Don't forget a simple thing: capital management.
For inquiries, please leave a comment.
Thank you.
