SOLANA to $600Solana held $123 as support on the monthly timeframe, with the next resistance at approximately $640 in November.
Solusdt

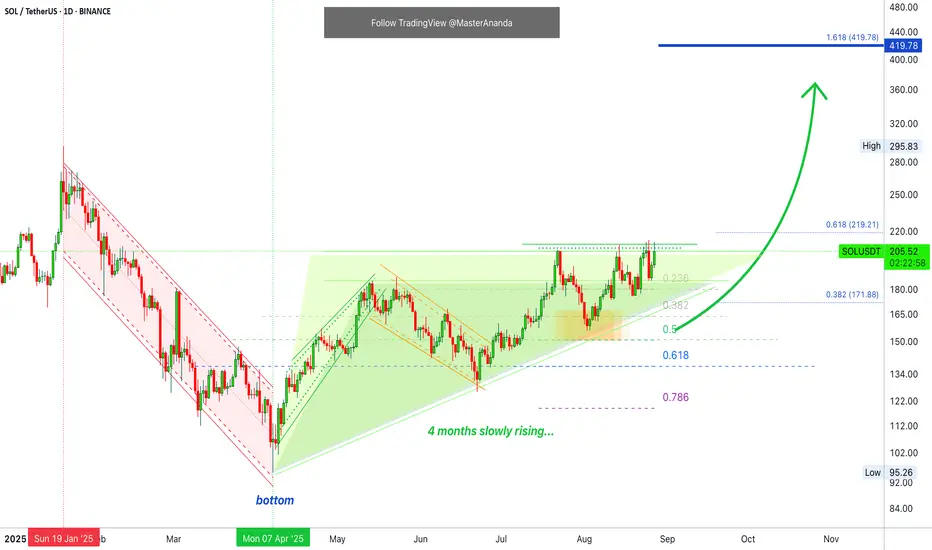
Solana · At The Top of The RangeI've been looking at many charts and seeing a repeating pattern; many pairs are trading right at resistance, at the top of the range.
This same rising triangle we see on SOLUSDT was present in another pair, and many other charts look similar.
The altcoins market is pushing higher, trying to break a local resistance zone. You know what happens when this level breaks don't you? Wave 3 of the bullish cycle, normally the strongest wave, starts.
Wave 5 is still missing of course but it normally tends to be an extension of the third. Sometimes wave 5 can become much bigger than wave 3 but right now we still don't know how things will develop in this current bullish cycle. In general, wave 3 is always the strongest one.
So there is the possibility that we are right in front of the strongest period of bullish action in the entire 2025-2026 Cryptocurrency bull market.
Summary
Solana is going up. Even if prices drop, the end result of the drop would be a higher low, which implies higher prices next.
Regardless of the short-term, SOLUSDT is set to move higher. This statement is supported by market data.
Thank you for reading.
Namaste.
SOL : I want to shop in these areas.Hello friends
Well friends, after a few hunts for the channel, the buyers finally broke the channel and the task was clear.
Now, with the price growth and correction we had in the areas identified as channel price pivots, I want to buy and move with it to the specified targets.
*Trade safely with us*

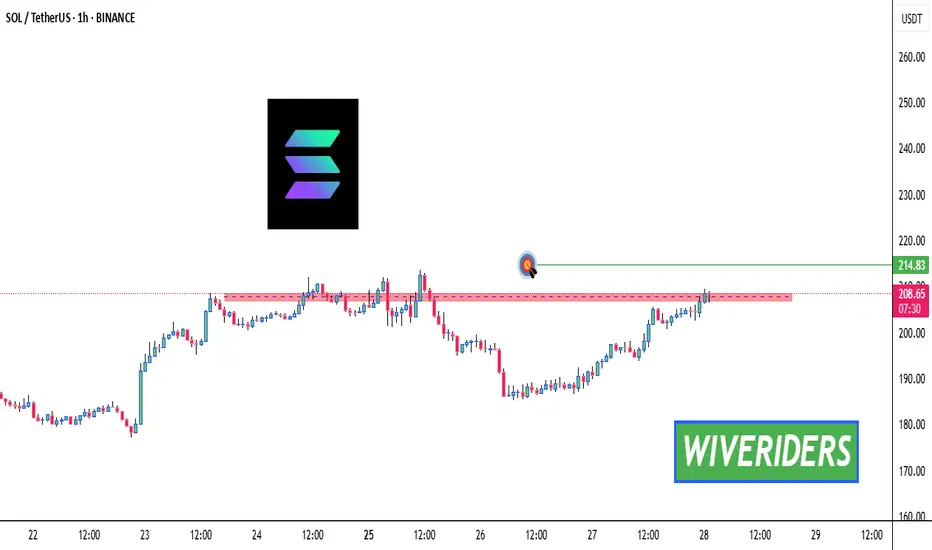
SOL Breakout Alert! 🚨 CRYPTOCAP:SOL Breakout Alert! 🚨
CRYPTOCAP:SOL is currently testing the red resistance zone 🔴
If price breaks out, the first target will be the green line level 🎯
A confirmed breakout would signal bullish continuation and could drive price higher ✅
SOLUSD bullish, till canceledI am bullish SOLUSD, and expecting going down first to 184.There I will accumulate more longs, only, if it holds, and doesnt move below 182.
If breaking below, the bullish bias s not valid anymore, ,and I expeczed to drop to 156,126, further to 96.
My first bullish target is is 213, if breaking above 251, and then 282
Ofcourse I am prepared that a change of signal can lead to exit immediately,no matter if positions in loss or profits.
Stops based only on acount risk tolerance

SOLGBP BullishTrend bias is bullish, higher highs and higher lows.
I am long in this trade. todays bias is ,currently bearish, but can change.At 140 I will add more longs, below 135, I exit. First profit target 156.
If it breaks above 156 my target will be 183
Nelow 125-128 bias is bearish
Stop loss dependent on risk tolerance

Bullish preparing to break above resistance?Solana gaining power vs. USD and that is boosting also other Solana paires.
On D tf I notice higher highs and higher lows, the market today a little bearish, but the bulls are accumulating. I am long. If the market falls back to 996, I add my longs. If below 990, I get out. First target is 1157, 2nd target is 1361
I dont show my stops. If you use stops. it depends on your own risk tolerance.

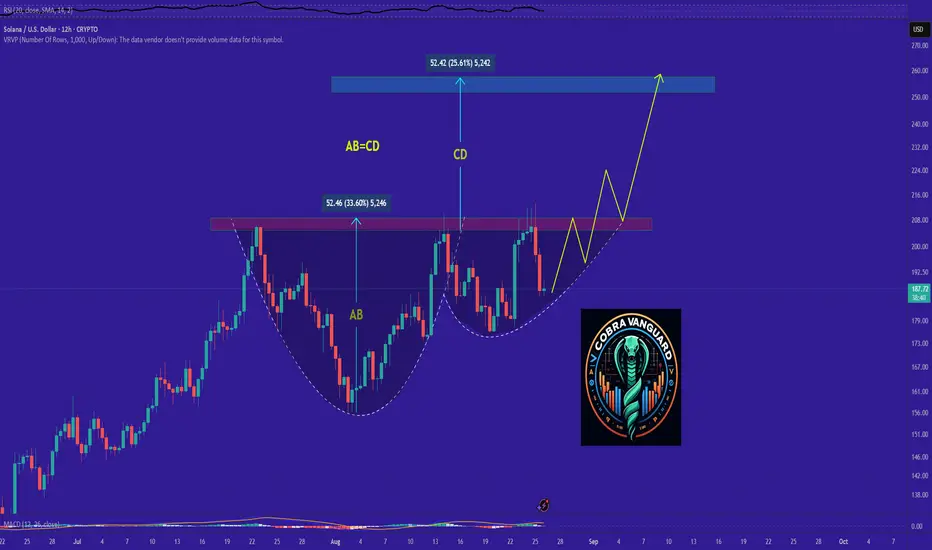
SOL's Situation, A Comprehensive Analysis !!!It appears that the price is forming a cup and handle pattern, and if this occurs, it could push the price above $210.
Best regards CobraVanguard.💚
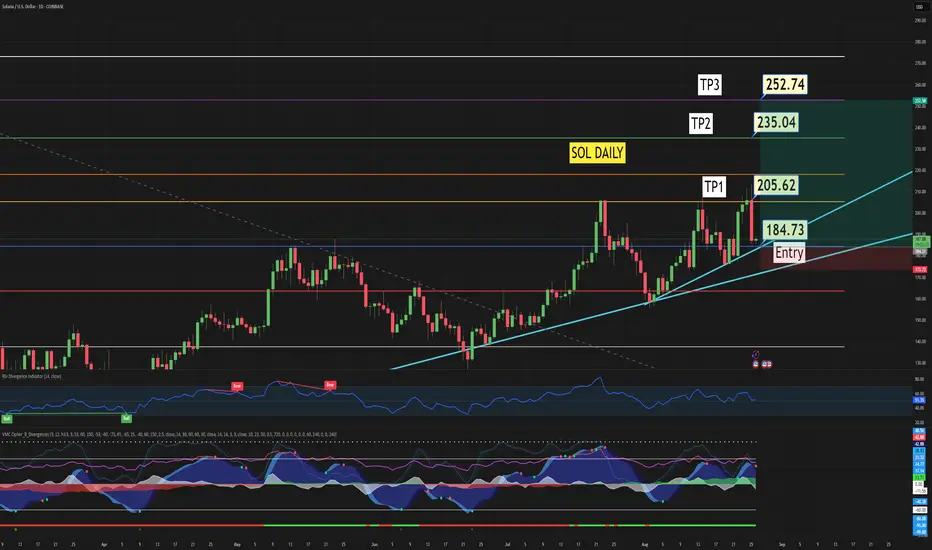
Sol Long Trade set up ideaSOL is at an important level right now. On the secondary trendline and at a 0.5 Fib pulled from ATH to April Low.. And currently on smaller time frame its in the middle of fibs with liquidity up and down.. So With BTC coming down to 108.8 after hours and Sol coming down to 187 kinda in the middle of noting I wouldn't be surprised for BTC to retest 108.8-107.500k (golden pocket) 618 fib tomorrow am market open and maybe Sol gets to 184.. Either way in this 185-180 range I like SOL for a move up to 232-252 if we get a bounce. If BTC falls below 106 this fails too so just keep a watch on both But looks very nice.
SOLUSDTSOLUSDT | 4H | Bullish Bias
🔑 Key Structure Update:
Price tapped into demand zone + FVG, marking a strong POI for potential reversal. Previous bearish leg may shift if buyers defend this level.
📍 POI Level (Demand Zone + FVG):
$175 – $178 range.
Reason: Overlap of demand zone + fair value gap, acting as liquidity zone.
📊 Trade Plan:
Wait for bullish confirmation (reversal pattern or BOS on lower timeframe) before entry.
🎯 Targets:
TP1: $190
TP2: $205
TP3: $220 (extended target if momentum sustains)
❌ Invalidation (SL):
Below $170 (clear demand failure).

SOLANA BULLISH MEGAPHONE PATTERN LOADING! solana continues to move step by step towards higher levels within the bullish megaphone pattern, which will make movements towards ATH and more inevitable in the coming period

SOLUSDT 1W Chart1. Main trend
• You can see a strong upward trend from holes around 120 USDT.
• The course currently moves along the growing trend line (orange).
• The last candles show that the buyers are defending support and each hole is higher → a sign of market strength.
⸻
2. Support and resistance (key levels from the chart)
• Support:
• 186.56 USDT - the first strong support (coincides with the trend line).
• 166.42 USDT - another stronger support.
• 139.00 USDT - main strategic support.
• resistance:
• 219.02 USDT - the closest resistance (currently tested).
• 253.15 USDT - strong resistance if 219 is broken.
• 296.24 USDT - another target in the event of a bull market.
⸻
3. Indicators
• MacD - upward signal, lines are above the zero line, green histogram → momentum is growing.
• STOCHASTIC RSI - high, close to the purchase zone → a short correction may occur.
• RSI (classic) - ~ 60 points, i.e. not yet purchased, but the space for increases is reduced.
⸻
4. Scenarios
• Bycza (more likely at the moment):
If the SOL stays above 186 USDT and pierces USDT USDT, subsequent goals are 253 → 296 USDT.
• Bear (alternative):
If the price drops below 186 USDT and breaks the trend line, possible return to 166 and even 139 USDT.
⸻
🔑 Summary
• The trend is upward and still strong.
• Key breakdown is 219 USDT.
• Trend holding (above 186 USDT) = potential for further increases.
• Breaking the trend line = correction warning.

#SOL/USDT Golden Pocket Retest ?#SOL
The price is moving within an ascending channel on the 1-hour frame, adhering well to it, and is on its way to breaking strongly upwards and retesting it.
We have support from the lower boundary of the ascending channel, at 174.85.
We have a downtrend on the RSI indicator that is about to break and retest, supporting the upside.
There is a major support area in green at 173, which represents a strong basis for the upside.
Don't forget a simple thing: ease and capital.
When you reach the first target, save some money and then change your stop-loss order to an entry order.
For inquiries, please leave a comment.
We have a trend to hold above the 100 Moving Average.
Entry price: 181.
First target: 183.
Second target: 186.
Third target: 190.
Don't forget a simple thing: ease and capital.
When you reach the first target, save some money and then change your stop-loss order to an entry order.
For inquiries, please leave a comment.
Thank you.

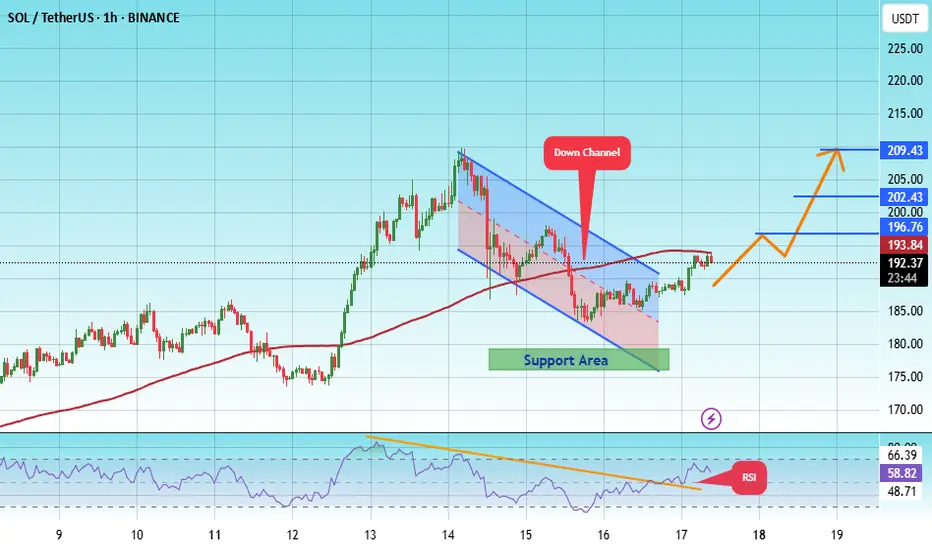
#SOL/USDT Is This the Perfect Time for a Solana Bullish Heist?#SOL
The price is moving within an ascending channel on the 1-hour frame, adhering well to it, and is on track to break it strongly upwards and retest it.
We have support from the lower boundary of the ascending channel, at 180.
We have a downtrend on the RSI indicator that is about to break and retest, supporting the upside.
There is a major support area in green at 178, which represents a strong basis for the upside.
Don't forget a simple thing: ease and capital.
When you reach the first target, save some money and then change your stop-loss order to an entry order.
For inquiries, please leave a comment.
We have a trend to hold above the moving average of 100.
Entry price: 192.
First target: 196.
Second target: 202.
Third target: 209.
Don't forget a simple thing: ease and capital.
When you reach the first target, save some money and then change your stop-loss order to an entry order.
For inquiries, please leave a comment.
Thank you.
SOL - Buy it before it's too late!As simple as the chart looks, everything on it is clear with strong targets expected in a short time.
The blue line: a close above it means BOS (Break Of Structure), signaling continuation of the upward move.
🔸Notice: this is the third attempt to break it.
In trading, resistance that the price tests multiple times weakens over time, and when it finally breaks, it usually does so with a huge green candle.
The price has also broken the daily 0.618 Fibonacci level, crossed above the 25 EMA, and made a retest of it.
Your minimum target from here is $400.
It’s a beautiful chart, strong project, and a leading coin in the market with big targets ahead… all that’s left is for you to buy it.
Best Regards:
Ceciliones🎯

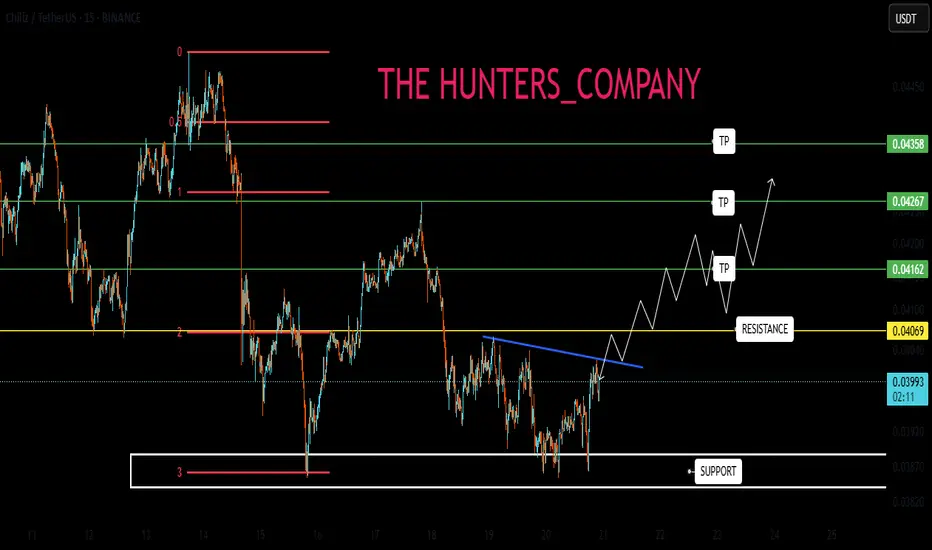
CHZ : BUY OR SELL? Hello friends
According to the price drop, you can see that the price is in the support area specified by the buyers. The specified support is also specified with Fibonacci, which is from our own strategy.
Now, if the support is held and the specified resistance is broken, the price can move to the specified targets. Don't forget risk and capital management.
*Trade safely with us*
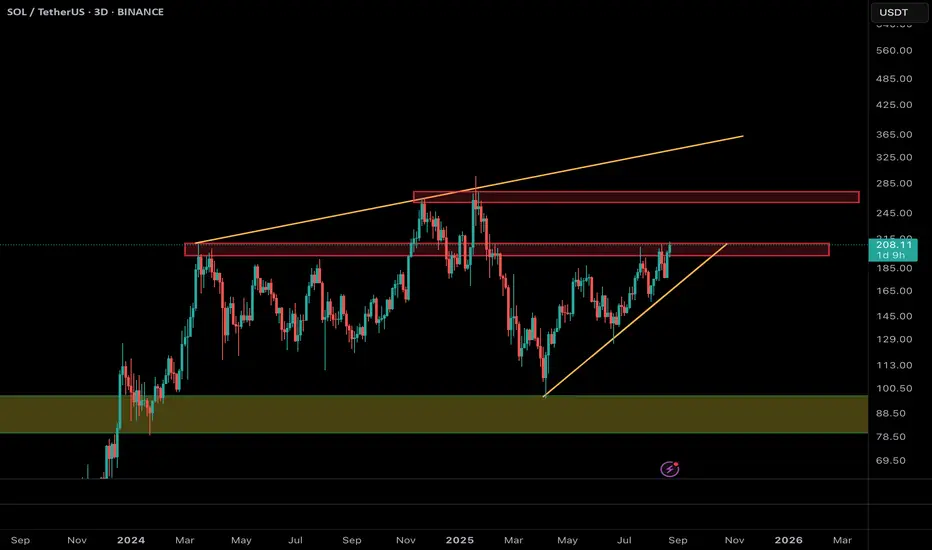
Solana at Make-or-Break: Can $213 Unlock the Rally to $270?Solana (SOL/USDT) has been recovering strongly since bouncing from the $110 area and is now testing the critical resistance zone around $205–213. This level has acted as a major barrier multiple times in the past, making it a true “make-or-break” point.
📌 Bullish Scenario (more likely if $213 holds):
• A confirmed breakout and daily/3D close above $213 could trigger a rally toward the next major resistance at $270.
• A successful move beyond $270 may even open the path toward the long-term resistance trendline near $320–340.
📌 Bearish / Alternative Scenario:
• If Solana fails to hold above $213, a pullback toward $180–175 is possible.
• Stronger support lies around $100, which remains the key level to defend for bulls.
⚡ Conclusion:
As long as SOL stays above $200, the structure remains bullish. A breakout above $213 would confirm momentum and unlock a potential move toward $270, while rejection could mean another corrective dip before the next attempt.
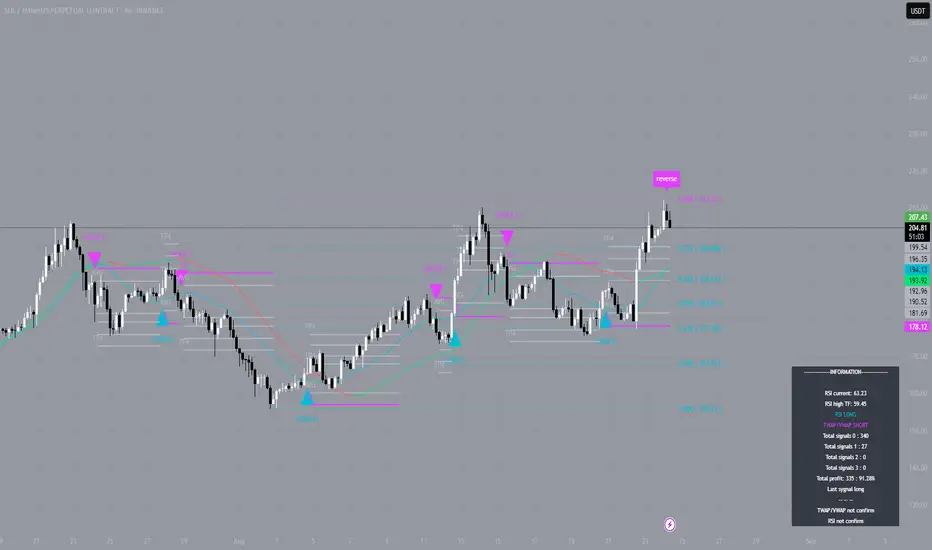
SOL — Growth Scenario from $187: TP4 Done, Position Still ActiveOn the 4-hour chart of Solana (SOL), our algorithmic model on August 20 identified a set of conditions favoring the continuation of the upward movement. The starting zone was around $187, where several factors aligned: strengthened buying volume, a breakout from the local range, and the defense of a key support level.
The trade has since unfolded according to the step-by-step management plan: price moved through the intermediate milestones, with profit-taking levels being triggered gradually. At this point, TP4 has been reached, with SOL already trading above $200. The position remains open, as the trend structure continues to hold and no confirmed reversal impulse to the downside has appeared.
The current working range is $198–$201. Holding this zone keeps the door open for continuation toward $205–$208, and potentially testing local highs around $212–$215. A breakdown and close below $198 would shift the focus back to the $194–$192 zone, where the model would reassess the buyer’s strength.
The key idea remains the same: we don’t try to guess direction but follow market structure and probabilities. The algorithm captures conditions where the trend has a statistical advantage, and the TP levels allow us to lock in profits step by step without giving control to emotions.
SOL Game Plan - Solana AltcoinSOL Game Plan
📊 Market Sentiment
Overall sentiment remains bullish, supported by expectations of a 0.25% rate cut in the upcoming FOMC meeting. A weakening USD and increasing global risk appetite are creating favorable conditions for further upside in crypto assets.
📈 Technical Analysis
Price has aggressively broken the HTF bearish downtrend and closed above it on the daily chart, indicating potential continuation to the upside.
In addition, price broke through the HTF resistance level, which is now acting as HTF support.
📌 Game Plan
I expect price to retrace back to the HTF support level at $194 and bounce from there, potentially retesting the broken HTF trendline as well.
🎯 Setup Trigger
I will monitor the 4H market structure for confirmation before initiating a position.
📋 Trade Management
Stoploss: Daily close below HTF support zone
Target: $296 (all-time high)
💬 Like, follow, and comment if you find this setup valuable!
⚠️ Disclaimer: This content is for informational and educational purposes only and does not constitute financial, investment, or trading advice. Always do your own research before making any financial decisions.

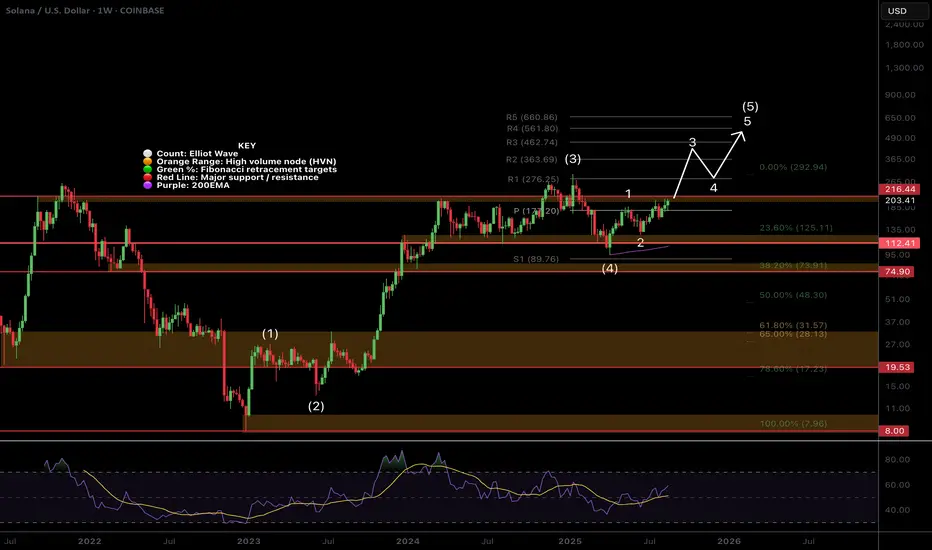
$SOL Ready for Price Discovery?CRYPTOCAP:SOL wave 3 of (5) appears to be underway but has to get through the major resistance High Volume Node at $216 and previous high first for an impulsive move.
Weekly pivot point was tested successfully as support and RSI has plenty of room to continue upwards.
Analysis is invalidated below $130.
Safe trading
Solana at the Gates of Breakout- 250-300 in sight1. What happened lately
After the sharp drop that started on July 23 and bottomed at 155 in early August, Solana has shown strong recovery.
The rebound pushed price back to the 207 resistance zone, followed by a pullback to 175, confirming it as a solid demand area. Yesterday, in line with the entire crypto market, SOLUSDT rallied strongly, and today, after a quick dip below 200, buyers stepped back in, pushing price once again toward resistance.
2. The key question
Is Solana ready to finally break above resistance and continue higher into a new bullish leg?
3. Why I expect continuation to the upside
• Positive fundamental backdrop across the crypto sector.
• Constructive technical structure with consecutive higher lows since April.
• 175 confirmed as a strong support zone, with buyers stepping in twice this month.
• 207 resistance under pressure again, showing growing bullish momentum.
4. Trading plan
As long as the daily close holds above 190, Solana remains firmly bullish.
A clear breakout above 207 could open the path toward 250, and in a more extended scenario, even 300 in the medium term.

Solana Prediction for 8/22I believe what we're seeing (order flow) is a bullish range order flow.
I don't see abnormal or excited sellers with huge size coming in constantly to bring price to any huge bearish targets.
Which leads me to believe, we're in a giant range.
Also today we had lots of buying activity that did strike me as excited. Big buyers, if they can get loose this target should be easy.

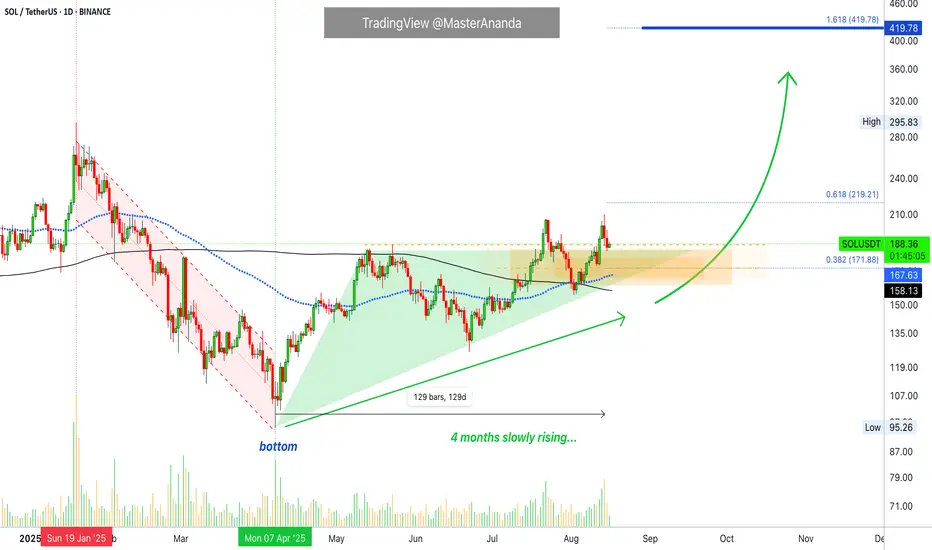
Solana Bullish · Long-Term Growth ConfirmedAfter the market bottom in April Solana has been rising slowly for four months.
Look at this chart here. I am keeping it very simple because I believe simple is best. Where is Solana at now? What happens next?
Solana is trading safely above EMA89 and MA200, notice the dynamics on the chart. These levels were first conquered as resistance back in July and by the 2nd of August these levels were being tested as support, they both held.
SOLUSDT is trading safely above these levels and also a price of $172 which is the 0.382 Fib. extension of the current wave. This is an important zone and the action is happening safely above it.
Solana has room to move around, wiggle around. This is what happens as prices grow. There can be stops and retraces but this does not mean that the rise is over, there is always more.
Solana just conquered the EMA89/MA200 duo-resistance recently, we have not yet seen what is possible now that the trading is happening on the bullish zone. We are due a major advance... The market is consolidating, building up strength to be able to grow long-term.
Namaste.