#SOL/USDT Final Liquidity Zone Before Expansion ?#SOL
The price is moving within a descending channel on the hourly timeframe. It has reached the lower boundary and is heading towards a breakout, with a retest of the upper boundary expected.
The Relative Strength Index (RSI) is showing a downward trend, approaching the lower boundary, and an upward bounce is anticipated.
There is a key support zone in green at 132. The price has bounced from this level several times and is expected to bounce again.
The indicator is showing a trend towards consolidation above the 100-period moving average, which we are approaching, supporting the upward move.
Entry Price: 133.50
First Target: 134.93
Second Target: 137.30
Third Target: 140.25
Stop Loss: Below the green support zone.
Remember this simple thing: Money management.
For any questions, please leave a comment.
Thank you.
Solusdtshort

#SOL/USDT Final Liquidity Zone Before Expansion ?#SOL
The price is moving within a descending channel on the hourly timeframe. It has reached the lower boundary and is heading towards a breakout, with a retest of the upper boundary expected.
The Relative Strength Index (RSI) is showing a downward trend, approaching the lower boundary, and an upward bounce is anticipated.
There is a key support zone in green at 142.67, and the price has bounced from this level several times. Another bounce is expected.
The RSI is showing a trend towards consolidation above the 100-period moving average, which we are approaching, supporting the upward move.
Entry Price: 145.00
First Target: 145.80
Second Target: 147.77
Third Target: 150
Stop Loss: Below the green support zone.
Remember this simple thing: Money management.
For any questions, please leave a comment.
Thank you.

#SOL/USDT may continue its trend after correction#SOL
The price is moving in a descending channel on the 1-hour timeframe. It has reached the upper limit and is heading towards breaking it. A retest of the upper limit is expected.
We have an upward trend on the RSI indicator, which has reached near the upper limit. A downward reversal is expected.
There is a key support zone in green at 139.70. The price has bounced from this zone multiple times and is expected to bounce again.
We have a trend of consolidation above the 100-period moving average, as we are moving close to it. This supports a downward move towards touching this level.
Entry price: 137.70
First target: 136.15
Second target: 135.09
Third target: 133.66
Stop loss above the resistance zone in green.
Don't forget a simple thing: money management.
For inquiries, please leave a comment.
Thank you.

#SOL/USDT Final Liquidity Zone Before Expansion ?#SOL
The price is moving in a descending channel on the 1-hour timeframe. It has reached the lower boundary and is heading towards a breakout, with a retest of the upper boundary expected.
We are seeing a bearish bias in the Relative Strength Index (RSI), which has reached near the lower boundary, and an upward bounce is expected.
There is a key support zone in green at 128, and the price has bounced from this level several times. Another bounce is expected.
We are seeing a trend towards stabilizing above the 100-period moving average, which we are approaching, supporting the upward trend.
Entry Price: 133
First Target: 134
Second Target: 137
Third Target: 140
Remember a simple principle: Money Management.
Place your stop-loss order below the green support zone.
For any questions, please leave a comment.
Thank you.

#SOL/USDT Final Liquidity Zone Before Expansion ?#SOL
The price is moving in a descending channel on the 1-hour timeframe. It has reached the lower boundary and is heading towards breaking above it, with a retest of the upper boundary expected.
We have a downtrend on the RSI indicator, which has reached near the lower boundary, and an upward rebound is expected.
There is a key support zone in green at 122.00. The price has bounced from this level multiple times and is expected to bounce again.
We have a trend towards stability above the 100-period moving average, as we are moving close to it, which supports the upward movement.
Entry price: 124.00
First target: 125.48
Second target: 127.15
Third target: 129.63
Stop loss: Below the support zone in green.
Don't forget a simple thing: capital management.
For inquiries, please leave a comment.
Thank you.

#SOL/USDT Final Liquidity Zone Before Expansion ?#SOL
The price is moving in a descending channel on the 1-hour timeframe. It has reached the lower boundary and is heading towards breaking above it, with a retest of the upper boundary expected.
We have a downtrend on the RSI indicator, which has reached near the lower boundary, and an upward rebound is expected.
There is a key support zone in green at 123.66. The price has bounced from this zone multiple times and is expected to bounce again.
We have a trend towards stability above the 100-period moving average, as we are moving close to it, which supports the upward movement.
Entry price: 126.20
First target: 127.76
Second target: 129.00
Third target: 130.74
Don't forget a simple thing: money management.
Place your stop-loss below the support zone in green.
For any questions, please leave a comment.
Thank you.

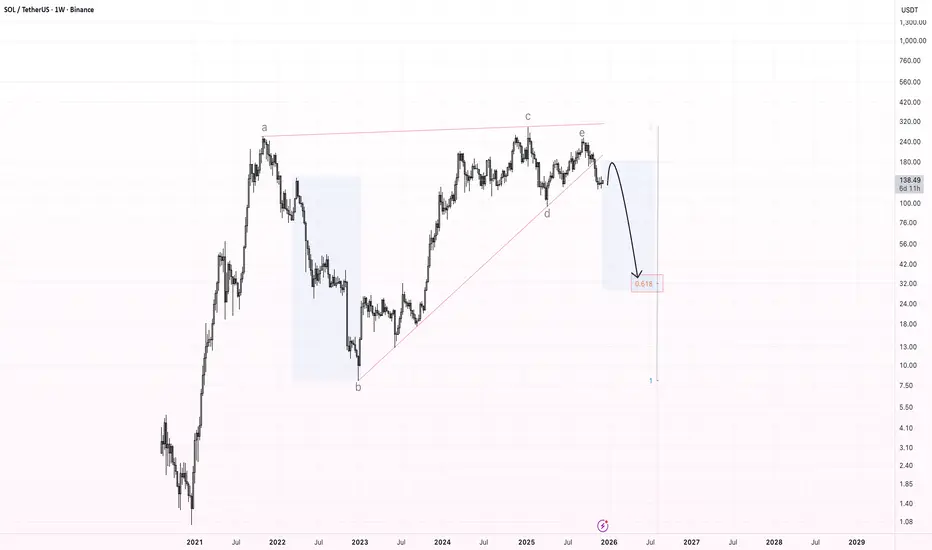
SOL – Bearish Rising Wedge Breakdown (Weekly Chart)The chart shows a large multi-year bearish rising wedge , which has now been broken to the downside. This wedge has been forming since the 2022 bottom and consists of clear wave structure (a–b–c–d–e), with the final wave e rejecting at the upper boundary and triggering the breakdown.
After this kind of pattern, the market often provides a relief bounce back into the broken support , which should now act as resistance . For SOL, the expected retest zone is located around $170–$190.
If price confirms resistance there, I expect the beginning of a larger downward wave , targeting the main Fibonacci zone near the 0.618 retracement, which aligns with a long-term target around $30–$40.
This zone marks the primary downside target for a full wedge breakdown.
Key Points:
Multi-year bearish rising wedge has broken.
Expected retest: $170–$190.
Major downside target: $30–$40 (0.618 zone).
Potential start of a macro corrective wave.
SOL/USDT : LIVE TRADEHello friends
considering the downtrend we have and the power of the sellers, we know that we should trade with the trend and be on the side of the one who has the market power.
So, at this stage, when we understand that our trend is down, we are now looking for the entry point that we have identified for you. This area that we have identified is the source of the price drop, which is full of sell orders. If the price pulls back to this area, when the sell orders are activated, they will cause the price to fall again.
This analysis is purely technically reviewed and is not a buy or sell offer, so do not be emotional and follow capital management.
*Trade safely with us*

Solana Fakeout: Bulls Caught, Bears in ControlMarket Context
In my previous publication about Solana, I clearly defined an Invalidation Level for the bearish setup. Price has now swept buy-side liquidity above that level, forming a false breakout with strong rejection.
This move appears to be a stop hunt, not genuine acceptance above resistance.
Structure & Intent
The long bullish candle above the invalidation level failed to hold, signaling lack of follow-through and confirming distribution at premium prices.
This behavior reinforces the expectation of further downside expansion.
Scenarios Recap
Previously, two downside scenarios were outlined:
• Scenario 1 : mitigation toward 116–118, followed by potential stabilization
• Scenario 2 : continuation toward 108 and below
The recent liquidity grab confirms Scenario 2 activation.
Execution Plan
📉 Bias: Bearish
🎯 Primary Target: 106
🧲 Intermediate liquidity: 116
❌ Invalidation : 129.4
Any acceptance or touch above this level invalidates the bearish thesis and opens the door for bullish continuation.
Conclusion
As long as price remains below the invalidation zone, Solana is expected to expand lower in search of sell-side liquidity.

SOL in Downtrend: Crypto Winter Hits HardFinally, Solana has broken out of its stagnation.
For a long time, the chart has been building a consolidation in the form of a three-wave WXY correction.
Right now, wave Y is wrapping up. I believe this wave could play out in two scenarios:
🔻• Solana drops from current levels to around 116-118;
🔻• or we see it much lower, in the 108 area.
I’m leaning more toward the second option because the consolidation has been quite prolonged. Plus, as I mentioned earlier, I think we’ve entered a downtrend. Crypto winter has already kicked off and is in full swing.
❌ The invalidation level for my bearish plan is 131.8 — any touch, even briefly, would cancel this scenario.
⚠️Be cautious: don’t trade without stop-losses, and avoid trying to catch the bottom, or you might end up with an unwanted “gift.”
🚀Drop reactions and comments if you want me to post daily updates on Solana.

SOL/USDT : SIGNALHello friends
Given the decline we had and the strength of the sellers, the price has reached the support areas we identified and has been well supported by the buyers in this area and has managed to hit higher lows.
The price is now in an important support area, and if buyers show support from this area, the price could grow and move to the specified targets.
Please note that this analysis is purely technical and does not constitute a buy or sell offer, so do not act emotionally and observe capital management.
*Trade safely with us*

#SOL/USDT Final Liquidity Zone Before Expansion?#SOL
The price is moving in a descending channel on the 1-hour timeframe. It has reached the lower boundary and is heading towards a breakout, with a retest of the upper boundary expected.
We are seeing a bearish bias in the Relative Strength Index (RSI), which has reached near the lower boundary, and an upward bounce is expected.
There is a key support zone in green at 130, and the price has bounced from this level several times. Another bounce is expected.
We are seeing a trend towards stabilizing above the 100-period moving average, which we are approaching, supporting the upward trend.
Entry Price: 132
First Target: 134
Second Target: 137
Third Target: 140
Remember a simple principle: Money Management.
Place your stop-loss order below the green support zone.
For any questions, please leave a comment.
Thank you.

SOL : LIVE TRADEHello friends
as you can see, after the resistance we set was broken, the price has grown well, and now with this red shadow, there is a sign of sellers entering, and there is a possibility of price correction, and the price can grow again from these areas and move to our targets, of course, if buyers support the support area again...
This analysis is purely from a technical perspective and is not a buy or sell recommendation, so please follow risk and capital management.
*Trade safely with us*

SOLUSD: Breakout from Bottom Structure Inside Downtrend ChannelHi!
SOL has been trading inside a descending channel, consistently respecting both upper and lower boundaries. Recently, price formed a clear Inverse Head & Shoulders at the bottom of the channel, signaling potential bullish reversal momentum. The neckline breakout aligns with the break of the minor descending trendline, strengthening the shift in structure.
If price holds above the neckline, the pattern projects a move toward the 160–165 USD zone, which also aligns with the channel’s upper boundary, a strong confluence area and natural target for bulls.
However, failure to sustain above the neckline could lead to a pullback toward the right-shoulder region, though the setup remains valid as long as price stays above the head level.
Overall, SOL is showing a bullish reversal signal, with upside continuation favored while above the breakout zone.

#SOL/USDT Final Liquidity Zone Before Expansion?#SOL
The price is moving in a descending channel on the 1-hour timeframe. It has reached the lower boundary and is heading towards breaking above it, with a retest of the upper boundary expected.
We have a downtrend on the RSI indicator, which has reached near the lower boundary, and an upward rebound is expected.
There is a key support zone in green at 135. The price has bounced from this zone multiple times and is expected to bounce again.
We have a trend towards stability above the 100-period moving average, as we are moving close to it, which supports the upward movement.
Entry price: 136.60
First target: 137
Second target: 138
Third target: 140
Don't forget a simple principle: money management.
Place your stop-loss below the green support zone.
For any questions, please leave a comment.
Thank you.
SOLUSDT: Get Ready For 300 Mark, This Time Reversal BigSOLUSDT has the potential to reach the 300 price range once it falls to our buying zone, defined by two horizontal white lines. Upon reaching this area we can target the 300 price level. Please exercise accurate risk management when trading cryptocurrencies.
For further analysis please like and comment.
Team Setupsfx_

SOL Short 1D Rebalancing the bearish inefficiency is likely to lead to further development of the downward movement.

SOLANA, November 15 Two Possible Correction Scenarios — One Outcome
In my view, Solana is currently forming a corrective structure.
At this moment, there are two scenarios:
🟧 Orange Scenario
The ABC corrective pattern has likely just completed, and Solana may follow the orange arrow toward 126 and potentially even lower.
🟪 Purple Scenario
The current flat ABC structure may actually represent wave A of a larger ABC correction — similar to what happened in Bitcoin right before its recent drop (see my recent BTC post where I expected 94K).
If this scenario plays out, Solana could first rise toward 144–146, and only then move down to 126.
I previously mentioned that I was waiting for Solana at 136 — and we’ve already seen that level.
I also expect 124, and possibly even lower.
But for now, I keep my short-term target at 126.
My global target is 112, but first, let’s see how exactly Solana approaches 126 — this will help confirm whether it truly intends to move below that level.
Let’s see which path Solana prefers — personally, I’m leaning toward the orange one.
⚠️Disclaimer: This is not financial advice or a call to action — only my personal vision.
🚀If you don’t want to miss updates, feel free to follow, leave reactions, or drop a comment.
Your support truly motivates me to continue posting regular Solana updates.

#SOL/USDT Bullish trend analysis Read The caption#SOL
The price is moving within an ascending channel on the 1-hour timeframe and is adhering to it well. It is poised to break out strongly and retest the channel.
We have a downtrend line on the RSI indicator that is about to break and retest, which supports the upward move.
There is a key support zone in green at the 137 price, representing a strong support point.
We have a trend to stabilize above the 100-period moving average.
Entry price: 141
First target: 143
Second target: 145
Third target: 148
Don't forget a simple money management rule:
Place your stop-loss order below the green support zone.
Once you reach the first target, save some money and then change your stop-loss order to an entry order.
For any questions, please leave a comment.
Thank you.

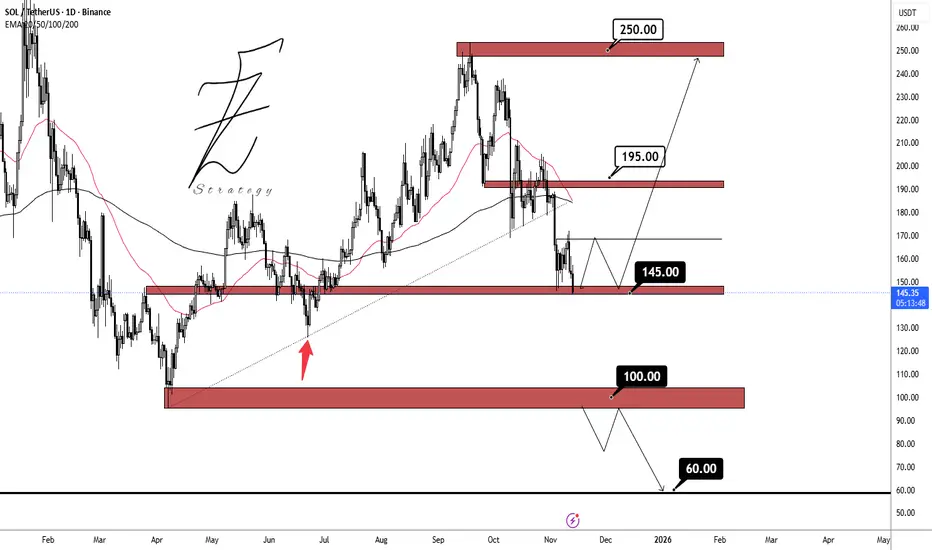
SOLUSDTLast week, the price BINANCE:SOLUSDT showed a positive reaction around the 145.00 dollar support zone, and with weakening bearish momentum, the likelihood of holding above this level has increased. If this support remains intact, the next target will be the 195.00 dollar resistance area.
Support zones: 145.00 dollar, 100.00 dollar, 60.00 dollar
Resistance zones: 195.00 dollar, 250.00 dollar
#SOL/USDT Bullish trend analysis Read The caption#SOL
The price is moving within an ascending channel on the 1-hour timeframe and is adhering to it well. It is poised to break out strongly and retest the channel.
We have a downtrend line on the RSI indicator that is about to break and retest, which supports the upward move.
There is a key support zone in green at the 154 price, representing a strong support point.
We have a trend to stabilize above the 100-period moving average.
Entry price: 156
First target: 156.80
Second target: 158
Third target: 160
Don't forget a simple money management rule:
Place your stop-loss order below the green support zone.
Once the first target is reached, save some money and then change your stop-loss order to an entry order.
For any questions, please leave a comment.
Thank you.

#SOL/USDT is going to breakout from descending channel 18% gain#SOL
The price is moving within an ascending channel on the 1-hour timeframe and is adhering to it well. It is poised to break out strongly and retest the channel.
We have a downtrend line on the RSI indicator that is about to break and retest, which supports the upward move.
There is a key support zone in green at the 162 price, representing a strong support point.
We have a trend to stabilize above the 100-period moving average.
Entry price: 164
First target: 166
Second target: 168
Third target: 171
Don't forget a simple money management rule:
Place your stop-loss order below the green support zone.
Once the first target is reached, save some money and then change your stop-loss order to an entry order.
For any questions, please leave a comment.
Thank you.

#SOL/USDT — Critical Retest at Demand Zone vs Long-Term Downtr#SOL
The price is moving within an ascending channel on the 1-hour timeframe and is adhering to it well. It is poised to break out strongly and retest the channel.
We have a downtrend line on the RSI indicator that is about to break and retest, which supports the upward move.
There is a key support zone in green at the 158 price, representing a strong support point.
We have a trend to stabilize above the 100-period moving average.
Entry price: 159
First target: 161
Second target: 164
Third target: 168
Don't forget a simple money management tip:
Place your stop-loss order below the green support zone.
Once you reach the first target, save some money and then change your stop-loss order to an entry order.
For any questions, please leave a comment.
Thank you.
