SOLANA HIGH PROBABILITY SETUPS SOON!!!🚨 SOL HIGH PROBABILITY SELL/BUY SETUP 🚨
* Here We Can See Clearly The Next Potential Moves For SOLUSD Coming Hours/Days.
* Keep Your Eyes Close On Your Trading Positions.
* Happy PIP Hunting Traders.
FXKILLA.
Solusdtshort

SOLUSDTI think have this chart of BINANCE:SOLUSDT buy because breakout trendline and i see order-block in 194$. Target is end measured move (2-Leg) from low latest swing in 208$.
Please control your risk in any position.

Solana Still ChillsSolana continues its correction phase. I am expecting a move toward 190 now
The invalidation zone for this scenario is marked on the chart

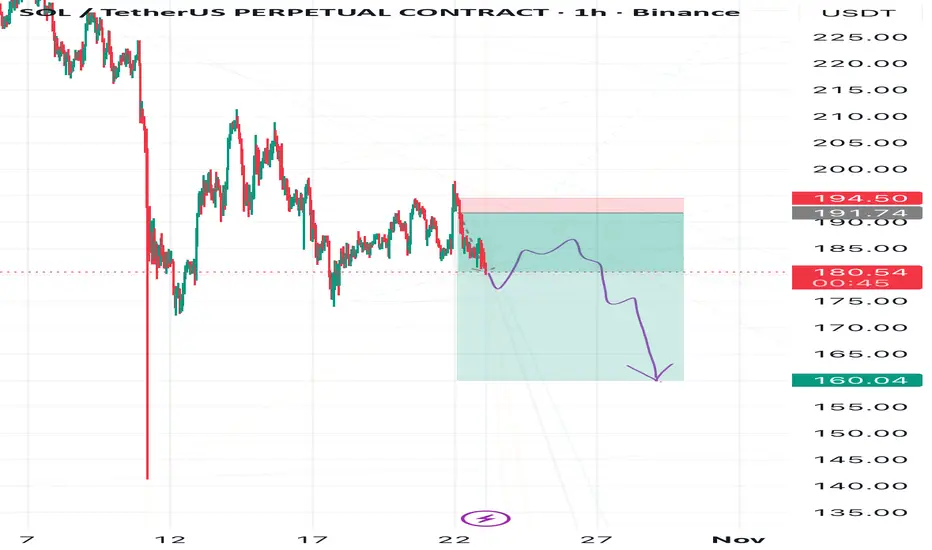
Don’t Trust the Twist — Solana’s Fall May PersistBe careful with Solana — the market might trick you into thinking a bullish reversal is forming.
In reality, the downtrend hasn’t finished yet.
A descending triangle is forming, and the breakout could be strongly to the downside.
🎯 Targets:
1️⃣ 164
2️⃣ 156
3️⃣ 138
❌ Invalidation: if price reaches the red zone marked on the chart
SOL ; What can be done?Hello friends
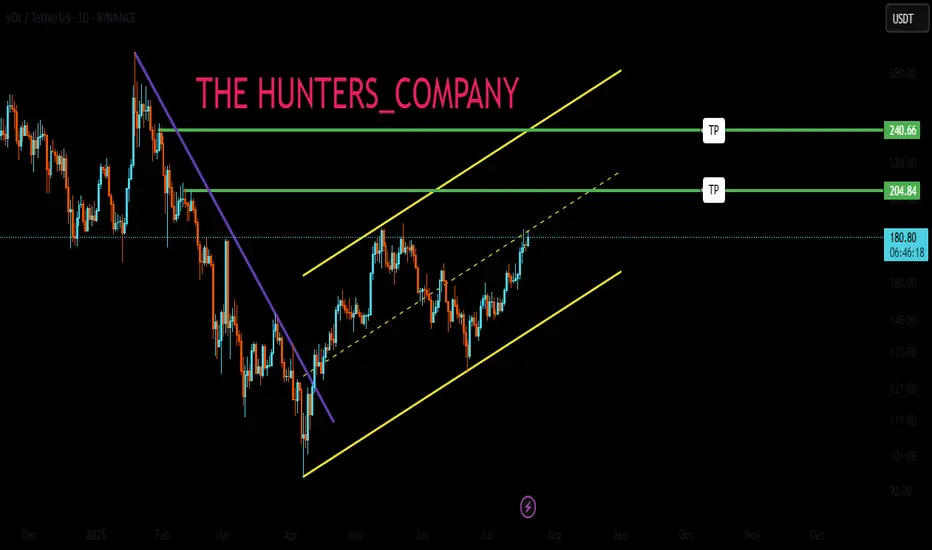
Given the decline we had, the price has been moving in an ascending channel for some time now, and now that the price is at the bottom of the channel and is on an important move, we can buy one step with risk and capital management, and in case of further correction, we can buy another two steps down and move with it to the specified targets.
*Trade safely with us*
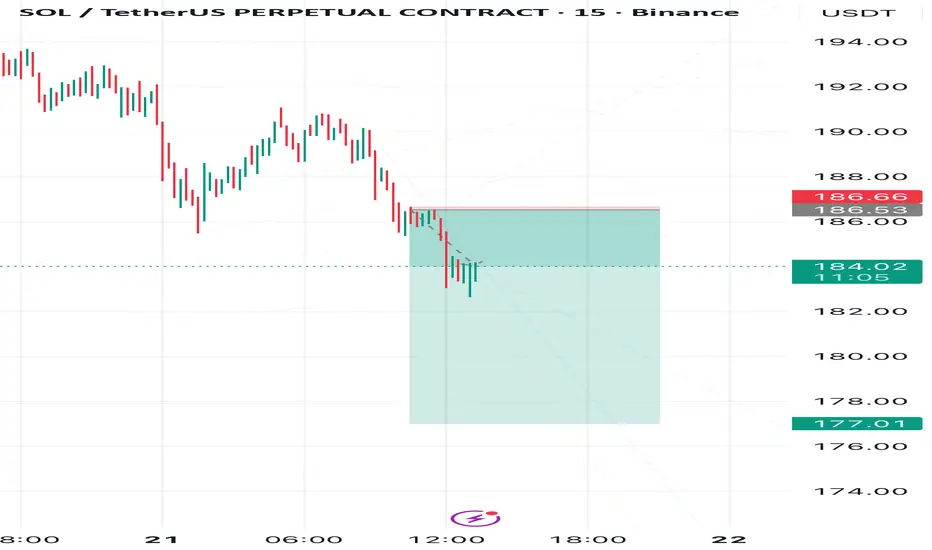
Solana Drop DramaSolana has started its decline as expected. I am now targeting a drop to 177
On the chart, I marked the plan cancellation zone—if price breaks this area, the scenario becomes invalid.
#SOL/USDT chart (1-hour timeframe)...#SOL
The price is moving in a descending channel on the 1-hour frame and is expected to break and continue upward.
We have a trend to stabilize above the 100 moving average again.
We have a downtrend on the RSI indicator that supports the upward move with a breakout.
We have a major support area in green that pushed the price higher at 188.
Entry price: 195.
First target: 200.
Second target: 207.
Third target: 214.
To manage risk, don't forget stop loss and capital management.
When you reach the first target, save some profits and then change the stop order to an entry order.
For inquiries, please comment.
Thank you.

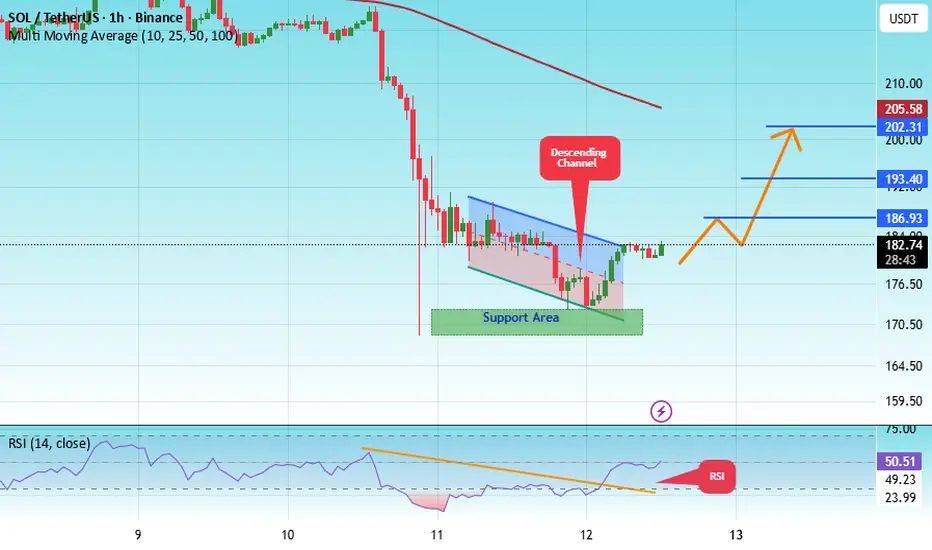
#SOL/USDT | SOL: Market Calms After Sharp Move & RSI Support#SOL
The price is moving within a descending channel on the 1-hour frame, adhering well to it, and is heading for a strong breakout and retest.
We have a bearish trend on the RSI indicator that is about to be broken and retested, which supports the upward breakout.
There is a major support area in green at 170, representing a strong support point.
We are heading for consolidation above the 100 moving average.
Entry price: 182.
First target: 186.
Second target: 193.
Third target: 202.
Don't forget a simple matter: capital management.
When you reach the first target, save some money and then change your stop-loss order to an entry order.
For inquiries, please leave a comment.
Thank you.
Solana Faces Bearish Pressure Below $190 SupportHi everyone!
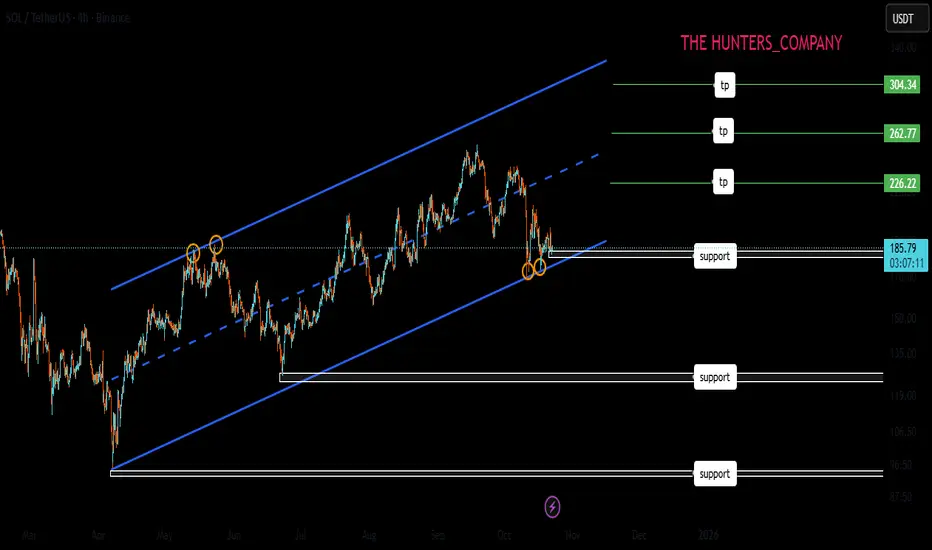
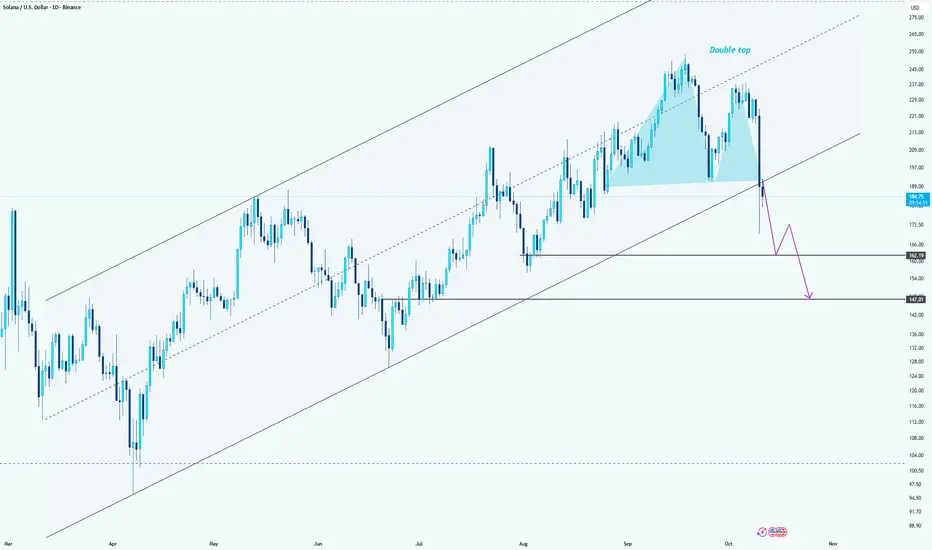
Solana appears to be forming a double top pattern near the $250 zone, signaling potential bearish momentum. After failing to sustain above the upper channel resistance, the price broke below the midline support, confirming short-term weakness.
Currently, SOL is retesting the neckline area around $190. If it fails to reclaim this level, further downside is likely. The next key support zones lie around $165 and $147, aligning with the previous structure and the lower channel boundary.
A clean break below $165 would likely accelerate the move toward $147, confirming a deeper correction within the broader ascending channel.
Bias: Bearish below $190
potential targets at $165 → $147.
BUY AND HOLDHello friends
Due to Solana's ATH and the Solana network becoming wider every day, big money is entering this currency, and considering the pullback we made, it is a good opportunity to enter with risk capital management and buy in steps in the specified areas.
Note that the holding period is at least 3 months, so be patient and observe capital management.
*Trade safely with us*

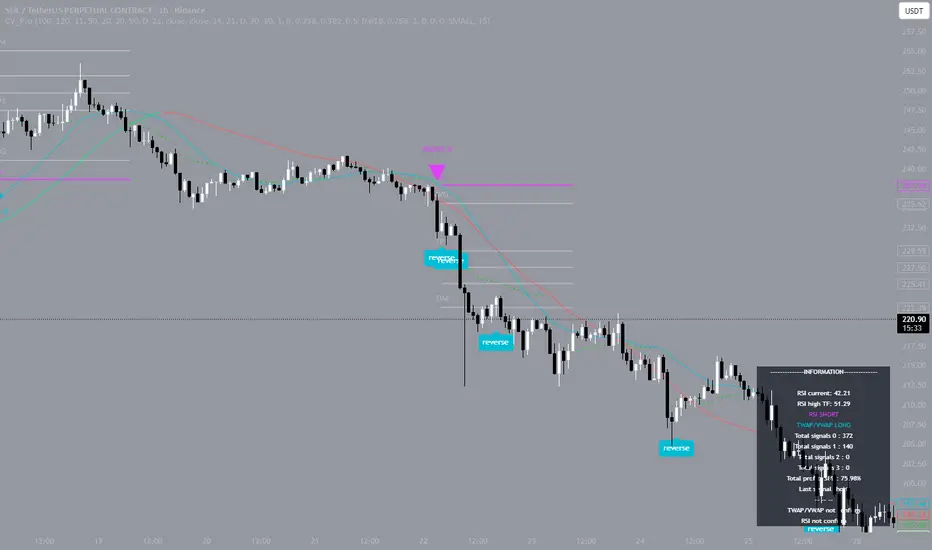
SOL: move down from $232On September 22, Solana turned into a clear downtrend on the 1H timeframe, starting from the $232.12 area. Price sequentially passed all four take-profit levels: $229.68, $227.66, $225.50, and $222.52, then printed a low at $190.78. The move offered over $40 per coin in potential, amplified by careful use of 5x leverage.
The trade was managed step by step: levels were mapped in advance, “take/hold” scenarios were defined, and decisions followed market structure. This removes haste and emotions—leaving only plan execution.
Observation: the win rate on SOL in the current market regime on 1H is notably above average - thanks to trend filtering and risk management. It’s not about guessing; it’s about math: volatility becomes measurable metrics, and metrics translate into consistent actions.
When discipline and structure are built into the process, trading stops being chaotic. Results become a function of consistency, not luck.
SOLUSDT ShortedWe saw a free fall for SOLUSDT, which can touch around 210-20,5, taking a short position with a risk of 10$ and RR of 1:4. Risk Management is more important than trading RM first trading next

SOL/USDT (4H chart) Bearish Bias🔎 Technical Outlook
• Trend: After a strong rally toward $250, Solana has started forming lower highs and lower lows, a clear sign of weakening momentum.
• Resistance Zone: Price faced rejection near $237 – $240, which aligns with a previous supply zone. This has turned into a ceiling for the market.
• Support Levels: Current price is hovering around $222, but if sellers maintain control, the next strong demand zone lies near $200 — also your marked target.
• Candlestick Behavior: The recent sharp decline shows strong bearish pressure, and recovery attempts have been weak, signaling more downside potential.
________________________________________
📉 Trade Setup (Bearish)
• Entry Zone: $222 – $223 (current area)
• Stop-Loss: $238 (above resistance and last swing high)
• Take Profit 1: $210 (interim support)
• Take Profit 2: $200 (major support)
• Risk/Reward: ~1:2 (attractive setup)
________________________________________
🛡 Risk Management
• 📉 Partial Profits: Secure partial gains at $210 before targeting $200.
• 🔒 Trailing Stop: Once $210 is hit, move SL to breakeven ($222) and trail down to lock profits.
• 🚫 Invalidation: A sustained break above $240 would cancel the bearish outlook and could push SOL back to $250+.
________________________________________
✅ Summary
Solana looks weak after repeated rejections at $237 – $240, and bears are in control. If sellers maintain momentum, a drop toward $210 and $200 is likely. The setup favors shorting rallies with a tight stop-loss above resistance.
________________________________________

SOL: Clear ReversalOn September 15, I opened a short on the 4-hour chart at $237 with 10x leverage. The move down was quick: TP1 was closed at $233 and TP2 at $230. A $7 difference per coin, amplified by leverage, delivered a solid result. The maximum of the trade came exactly at $230 before the market reversed.
The focus here was not on trying to take everything but on following structure. Levels had been mapped in advance, and I executed step by step according to plan. This allowed me to control the trade calmly, without panic or guesswork.
When trading is built systematically, even sharp moves become manageable. It’s clear where to take profit, where to hold, and where to stop. With leverage, this becomes especially critical: risk stays under control, and decisions are made without emotional pressure.
The market will always move in its own way, sometimes offering more, sometimes less. But discipline and consistency make the outcome predictable. Every such trade proves that success comes not from luck, but from a systematic approach and the ability to stay on course.

SOL AGAIN/;Hello friends
You see that the price is stuck in a trading range and you must know that 80% of failures in trading ranges are fake!
Now, as the trading range lengthens, we can finally wait for its failure, and if it fails, the price will move by the same amount as the trading range.
*Trade safely with us*

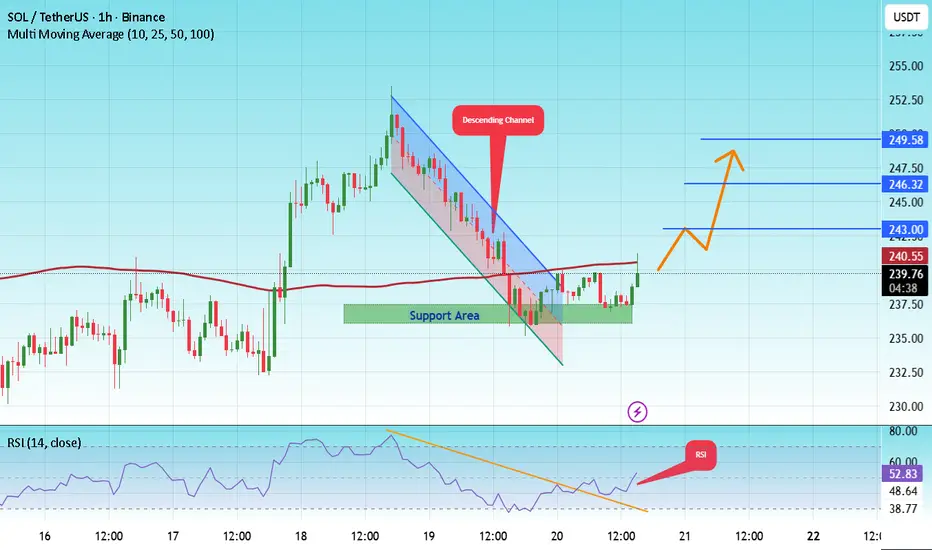
#SOL/USDT bullish structure formed at the chart#SOL
The price is moving in a descending channel on the 1-hour frame and is expected to break and continue upward.
We have a trend to stabilize above the 100 moving average again.
We have a downtrend on the RSI indicator that supports the upward move with a breakout.
We have a major support area in green that pushed the price higher at 236.
Entry price: 240.
First target: 243.
Second target: 246.
Third target: 249.
To manage risk, don't forget stop loss and capital management.
When you reach the first target, save some profits and then change your stop order to an entry order.
For inquiries, please comment.
Thank you.
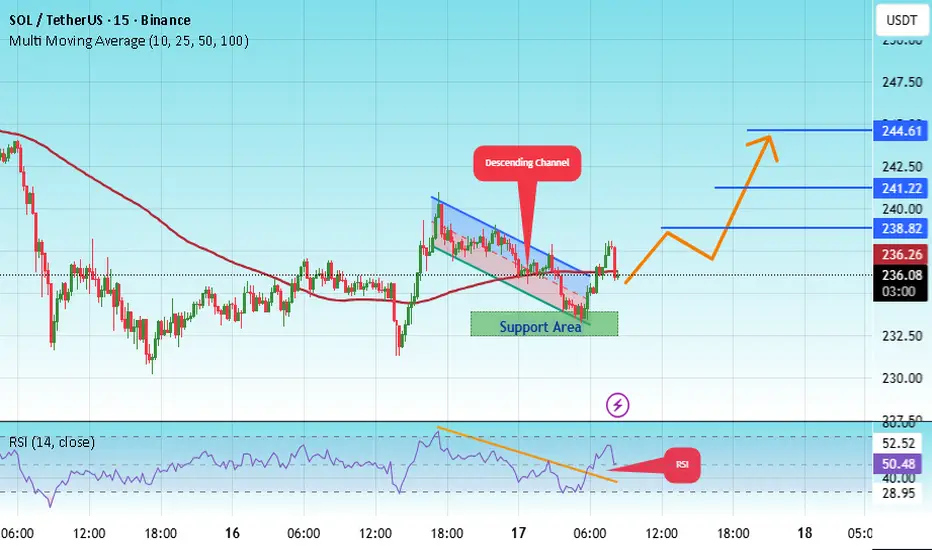
#SOL/USDT bullish structure formed at the chart#SOL
The price is moving within a descending channel on the 1-hour frame, adhering well to it, and is heading for a strong breakout and retest.
We have a bearish trend on the RSI indicator that is about to be broken and retested, which supports the upward breakout.
There is a major support area in green at 233, representing a strong support point.
We are heading for consolidation above the 100 moving average.
Entry price: 236
First target: 238
Second target: 241
Third target: 244
Don't forget a simple matter: capital management.
When you reach the first target, save some money and then change your stop-loss order to an entry order.
For inquiries, please leave a comment.
Thank you.
SOLANA UPDATEHello friends🙌
📉Given the decline we had, you can see that buyers came in and supported the price and were able to change the trend and create an ascending channel.
📈Now, considering that the price is hitting higher ceilings and floors, we can expect an ascending wave until the ceiling of the channel.
Don't forget risk and capital management.⚠
🔥Follow us for more signals🔥
*Trade safely with us*
Up or down?Hello friends
Well, considering the growth we had, the analysis of which we have already given you and it was full target, now we needed to go for another update.
Well, considering the price growth, there is an important resistance area on our way that they have determined for us.
If this resistance is validly broken, the price can move to the specified targets, but what if the price cannot break the resistance?
Well, don't worry, we have another scenario where if the price fails to break the resistance and falls, we have identified good support areas that if reached, the price can grow well to the set targets. Finally, it must be said that given the large number of buyers and the buying pressure we have in Solana, sooner or later, I think this resistance will be broken and we will see higher numbers.
*Trade safely with us*

$SOL Skyrockets to 240: Catch the Bull Run! BINANCE:SOLUSDT
CRYPTOCAP:SOL Skyrockets to 240: Catch the Bull Run!
Entry Level: Marked at 1 (240.00 USDT), suggesting a potential buy point near the current price.
Take Profit (TP) Levels:TP1: 0.786 (228.33 USDT)
TP2: 0.618 (219.17 USDT)
TP3: 0.5 (212.73 USDT)
TP4: 0.185 (185.46 USDT)
Stop Loss (SL): Set at -1.272 (254.84 USDT), indicating a level to exit if the price moves against the trade.
Dead Cat Bounce (DCB): Marked at -1.135 (247.36 USDT), possibly indicating a minor reversal point.
RSI (Relative Strength Index)Current RSI: Around 80.93, which is in the overbought territory (above 70), suggesting the asset may be overvalued and could be due for a pullback or consolidation.
Trend: The RSI has risen sharply in recent days, aligning with the price surge, indicating strong momentum but also potential overextension.
Key ObservationsThe chart indicates a bullish breakout with significant upward momentum, but the overbought RSI suggests caution. Traders might consider taking profits at the marked TP levels or waiting for a pullback to the entry or lower TP levels.
The SL is set above the recent high, providing a buffer against a potential reversal.
The analysis appears to use a Fibonacci-based strategy, with levels derived from a recent swing high and low.

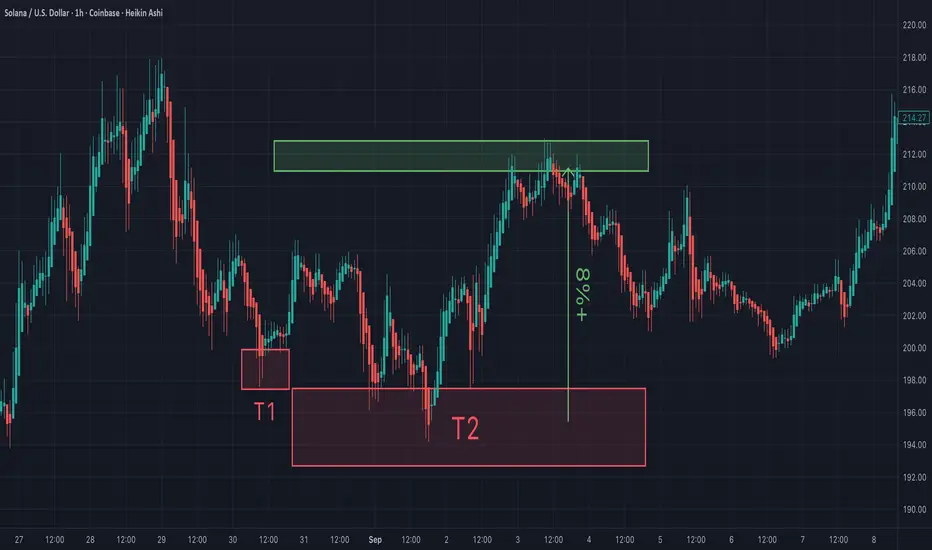
You will ask yourself, "how did he know Sol would do that"?On Aug 30th I posted Sol's support and resistance for my trades. I am grateful it played out perfectly.
One question remains...is Sol getting overheated, or going to continue to rip to the upside? I'd like to hear your thoughts?
May the trends be with you.
SOLUSDTThis is a bullish setup for BINANCE:SOLUSDT , but the $230 level is crucial for potential reactions. My strategy is to stay bullish and wait for the upcoming US CPI news, then decide whether to buy or sell CRYPTOCAP:SOL based on the news.
⚠️Ensuring your position size aligns with your risk tolerance.

#SOL/USDT → Stronger than the market. Correction before growth#SOL
The price is moving within a descending channel on the 1-hour frame and is expected to break and continue upward.
We have a trend to stabilize above the 100 moving average again.
We have a downtrend on the RSI indicator that supports the upward move with a breakout.
We have a support area at the lower boundary of the channel at 207, acting as strong support from which the price can rebound.
We have a major support area in green that pushed the price upward at 205.
Entry price: 210.
First target: 214.
Second target: 219.
Third target: 225.
To manage risk, don't forget stop loss and capital management.
When you reach the first target, save some profits and then change the stop order to an entry order.
For inquiries, please comment.
Thank you.
