Sonic (Fantom) OutlookSonic, formerly known as Fantom has been on a steady downtrend since Nov 2024. It's already one-sixteenth compared to that time. Let's see if it rises from here!
Sonic

SONICUSDT /// 30NOVIn every market cycle, some projects experience severe drawdowns and fail to recover meaningfully during the next bullish phase. These are often referred to as “underperforming projects” or projects that have not shown signs of sustainable recovery. Many traders who held such assets in previous cycles experienced significant losses as these tokens were unable to revisit their former highs.
From my perspective, Sonic appears to be one of the projects that has struggled to regain its previous momentum. Based on its current price behavior, it seems to function primarily as an asset that offers short-term volatility rather than long-term trend continuation. Because of this, it may attract traders who focus on short-term or periodic opportunities, especially during corrective phases where the market sometimes provides 20–40% swings.
This observation is not a guarantee of future performance, but simply a reflection of how the project has behaved in the current market environment. As always, market conditions can change, and any trading approach should be aligned with personal risk management and broader market trends.

Based on the liquidity structure and price reading method (RTM)My personal view on this currency is clearly visible on the chart.
This analysis is purely technical and does not include any fundamental bias.
My method is to identify sentiment, liquidity, and price action (RTM).
S Analysis (1W)Based on the complete data of this coin | which is not fully available in this chart —
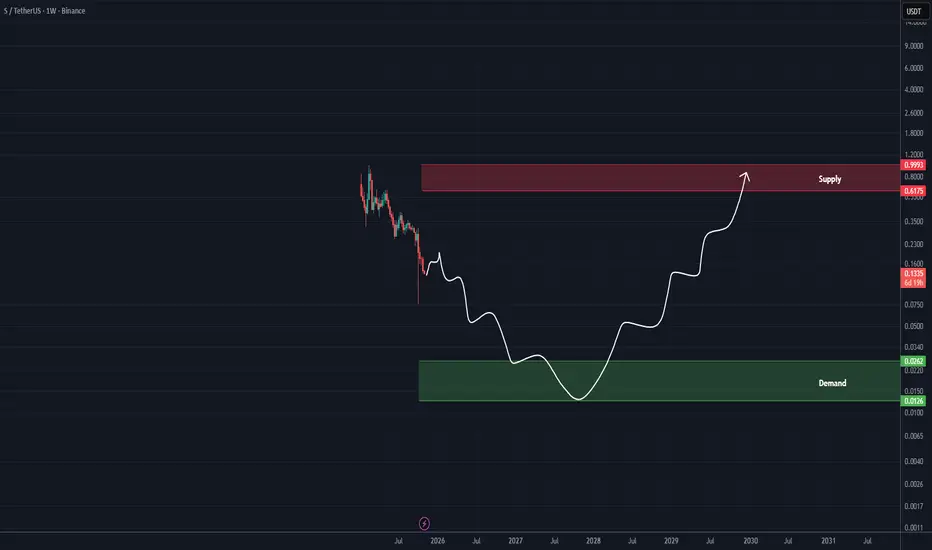
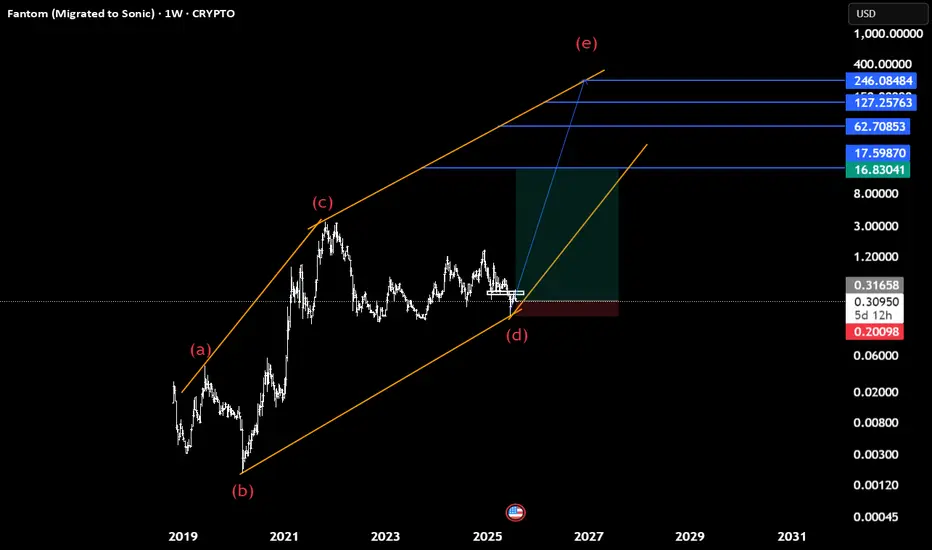
From the point where we placed the red arrow on the chart, the major corrective wave S has begun.
It appears that an ABC pattern has formed on the weekly timeframe, where wave B was a completed diametric structure.
We are now in the large C wave, which is expected to be a long and time-consuming move both in price and duration, likely to complete within the green zone.
This is our outlook on S.
For risk management, please don't forget stop loss and capital management
When we reach the first target, save some profit and then change the stop to entry
Comment if you have any questions
Thank You
S Roadmap (1W)#SUSDT | #FTMUSDT analysis (1W)
From the point where we placed the red arrow on the chart, the major corrective wave S has begun.
It appears that an ABC pattern has formed on the weekly timeframe, where wave B was a completed diametric structure.
We are now in the large C wave, which is expected to be a long and time-consuming move both in price and duration, likely to complete within the green zone.
This is our outlook on S.
For risk management, please don't forget stop loss and capital management
When we reach the first target, save some profit and then change the stop to entry
Comment if you have any questions
Thank You

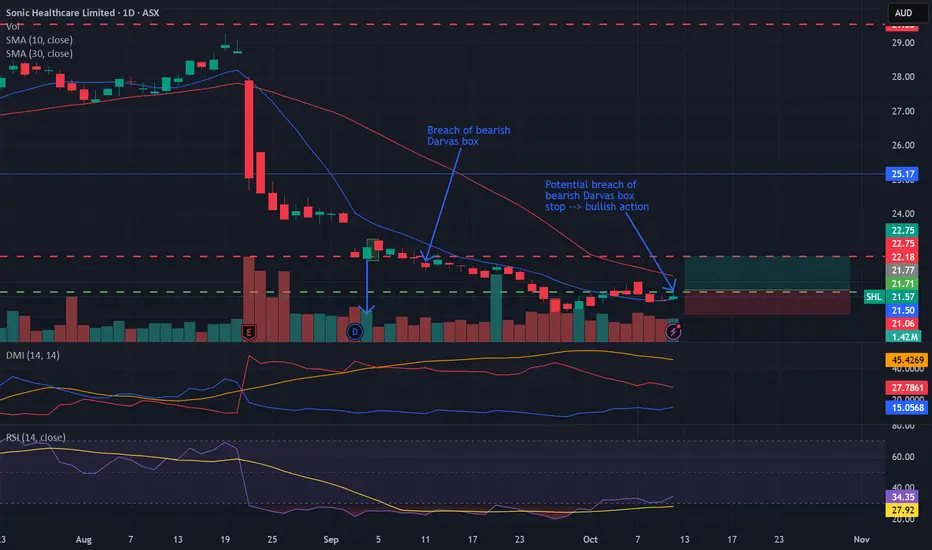
Bullish potential detected for SHLEntry conditions:
(i) higher share price for ASX:SHL along with swing up of indicators such as DMI/RSI.
Depending on risk tolerance, the stop loss for the trade would be:
(i) below the recent swing low of 8th October of $21.42, or
(ii) below the prior swing low of $21.07 from 26th September.
S/USDT The Big Test at the Trendline — Rebound or Rejection?🔎 Overview
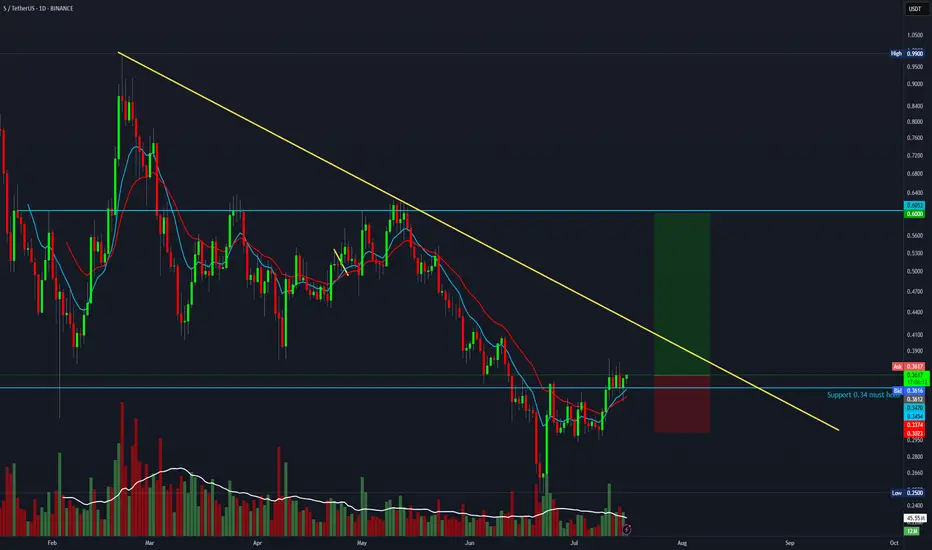
The price action of S/USDT remains under pressure from a long-term downtrend, marked by the descending trendline (yellow) that has consistently capped every rally attempt since early this year.
After bouncing from the 0.2219 major low, price has shown a solid rebound and is now testing the critical confluence resistance zone at 0.2984 – 0.31.
This area is a make-or-break level: will buyers manage a breakout to end the seller’s dominance, or will the trendline reject price once again?
---
🧩 Structure & Pattern
1. Descending Trendline
– A clear series of lower highs confirms seller dominance.
– Each rally attempt has been rejected at this line.
2. Key Supports
– 0.2219 → the major swing low and critical downside level.
– Minor support zone: 0.260 – 0.244.
3. Layered Resistances
– 0.2984 (current test) → the first breakout checkpoint.
– 0.3531 – 0.3946 → next upside targets if breakout holds.
– 0.6088 – 0.8650 → major resistance levels, potential rally zone in the mid-term.
---
📈 Bullish Scenario (If Breakout Holds)
Confirmation: Daily close above 0.2984–0.31 with strong volume.
Entry Idea: Buy on retest of the breakout zone.
Upside Targets:
TP1 → 0.3531
TP2 → 0.3946
TP3 → 0.6088
Stop Loss: Below 0.28 (or below the retest low).
Narrative: A breakout from the descending trendline could signal the first step of a trend reversal, opening the path for further bullish momentum.
---
📉 Bearish Scenario (If Rejection Happens)
Confirmation: Bearish rejection candle (engulfing / pinbar) around 0.298–0.31.
Entry Idea: Short/sell after confirmation of rejection.
Downside Targets:
TP1 → 0.260–0.244
TP2 → 0.2219 (major low)
Stop Loss: Above 0.31–0.33.
Narrative: As long as price remains below the trendline, the broader bearish structure is intact. Rejection here may trigger continuation towards the lows.
---
📝 Conclusion
The 0.298–0.31 zone is a major battleground between bulls and bears.
A confirmed breakout could shift momentum towards 0.3531–0.3946.
A rejection, however, keeps downside risk alive with targets back to 0.2219.
Best strategy: Wait for daily close + volume confirmation before committing to major positions.
---
📌 Key Levels to Watch
Support: 0.2884 → 0.260–0.244 → 0.2219
Resistance: 0.2984 → 0.3531 → 0.3946 → 0.6088 → 0.8650
---
#SUSDT #CryptoAnalysis #Altcoin #TechnicalAnalysis #TrendlineBreakout #BearishVsBullish #CryptoTrading #SwingTrade #SupportResistance

S(ex FTM) Long plan , LO My plan for S (SONIC)Long:
-place limit order on my Fib zone
- Weekly and Monthly open also in this zone and that give us additional confluence
- Target -> Monthly High at $0.35

S holding is bottom tight. Reversal here makes senseSonic price structure is very indecisive, however, as PA unfolds, POI are developing. If the current range, given the volume, can be respected, a break to the upside is expected. A sweep of the market structure is still possible, but as time passes and market conditions improve it becomes less likely.

SUSDT 4H Chart Analysis | Channel Breakdown LoomsSUSDT 4H Chart Analysis | Channel Breakdown Looms
🔍 Let’s break down the recent price action on the S/USDT 4-hour chart, focusing on the pivotal ascending channel structure and its implications for the next move.
⏳ 4-Hour Overview
S/USDT has been moving within a well-defined ascending channel, marked by higher highs and higher lows. Price is now testing the lower boundary of this channel, making the 0.3127 support a crucial level. The recent uptick in volume during the downward leg hints at mounting bearish pressure.
🔻 Short Setup:
A confirmed breakdown (BO) below 0.3127 would signal an exit from the ascending channel, opening the door to accelerated downside. With channel support breached, the next key target sits at 0.2710, in line with historical liquidity and the channel’s projected lower range.
📊 Key Highlights:
- Price action is currently at the channel’s lower boundary, with a breakdown below 0.3127 required to confirm bearish momentum.
- Volume has increased on the recent downward move, supporting the idea of a channel exit and follow-through selling.
- Downside target stands at 0.2710 if the channel fails, providing a clear roadmap for action.
🚨 Conclusion:
Bulls must defend the ascending channel at 0.3127, or risk seeing S/USDT cascade toward 0.2710. Watch for volume confirmation—an exit below channel support could shift sentiment quickly.

Sonic ($S) – Rebound After Heavy DownsideAfter months of downside, $S looks ready to repeat its historical cycle of massive accumulations followed by explosive breakouts.
✅ Previous cycles show gains of +1,600%, +5,600%, and +900% after similar consolidation phases.
✅ The current falling wedge breakout on the weekly chart suggests that momentum is shifting back in favor of the bulls.
✅ Strong fundamentals are aligning:
Testnet 2.1 upgrade (Aug 12) integrated Ethereum’s Pectra for scalability & interoperability.
TVL inflows of $21M and growing trading volume (June $3.1B → July $4.9B).
US expansion plans (ETF, NASDAQ PIPE, Delaware entity) with governance vote ending Aug 31.
🎯 Targets Ahead
First resistance: $0.54
Mid-term: $0.84 → $1.45
Long-term (cycle projection): $9 → $15+
⚡️ History shows what happens after long consolidations: parabolic runs. With fundamentals lining up and technicals breaking out, this could be the beginning of Sonic’s next major cycle.
💡 “After all the downside, it’s time for $S to return – the setup looks explosive.”

S/USDT - Daily - BreakoutThe S/USDT pair on the Daily timeframe presents a Potential Buying Opportunity.
Target Levels:
1st Resistance – 0.4000
2nd Resistance - 0.5839

Sonic (FTM) Technical Outlook: Signs of an Upcoming Breakoutthe price is currently below a dynamic resistance line, but the strength of this line has weakened compared to the past, increasing the likelihood of a breakout.
below the current price, a dynamic support line has formed, preventing the creation of a new price low. additionally, the pivot that led to the lowest low was unsuccessfully broken once. this, along with the fact that the price has been moving within this range over the past two months, serves as a bullish signal.
ichimoku analysis was also used, but is has been removed for chart clarity.
future price targets are: $0.35, $0.60, $1.20, and ultimately $3.00.

#SONIC #SONICUSD #SONICUSDT #Analysis #Eddy#SONIC #SONICUSD #SONICUSDT #Analysis #Eddy
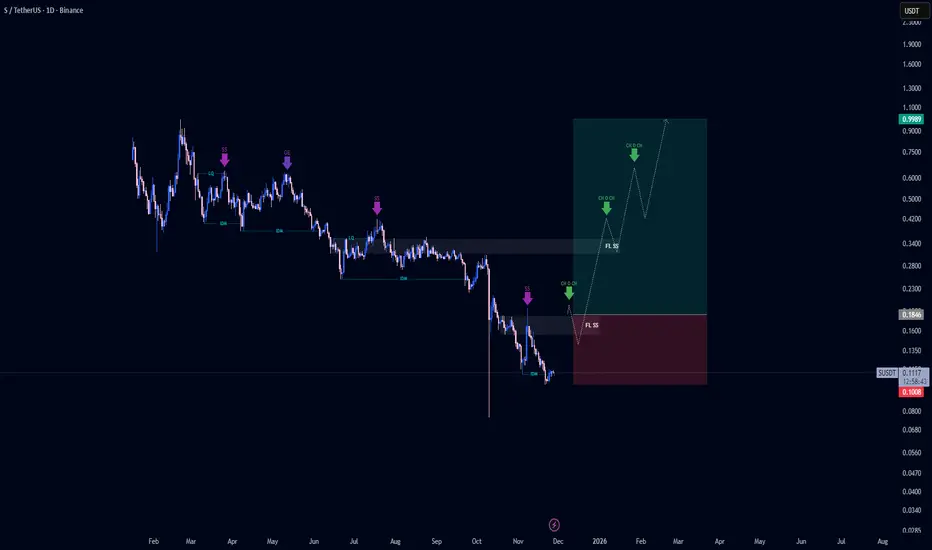
A reversal structure has formed on the weekly and daily time frames, and the necessary confirmations have been given on the weekly time frame. Considering the structure formed on the above time frame, as well as the behavior of this currency in the past chart, it is expected that this currency will perform a good pump.
I have identified the important supply and demand zones of the higher timeframe for you.
This analysis is based on a combination of different styles, including the volume style with the ict style.
Based on your strategy and style, get the necessary confirmations for this analysis to enter the trade.
Don't forget about risk and capital management.
The responsibility for the transaction is yours and I have no responsibility for your failure to comply with your risk and capital management.
💬 Note: The red order block cannot stop the growth of the price of this currency and by 0.66 cents this currency will be pumped more than 230%.
Be successful and profitable.

Sonic Near Strong Support, Eyes 15% Rally Toward $0.36 TargetHello✌️
Let’s analyze Sonic’s price action both technically and fundamentally 📈.
🔍Fundamental analysis:
Sonic Token’s Fee Monetization lets developers keep up to 90% of fees their apps make, boosting growth by rewarding active builders. This approach helped other projects grow 20-40% TVL early on.🚀
📊Technical analysis:
BINANCE:SUSDT shows solid volume near a strong daily support; if it holds, a 15% upside toward $0.36 looks likely. Watching this level is key for a potential bounce.📊🔍
✨We put love into every post!
Your support inspires us 💛 Drop a comment we’d love to hear from you! Thanks, Mad Whale

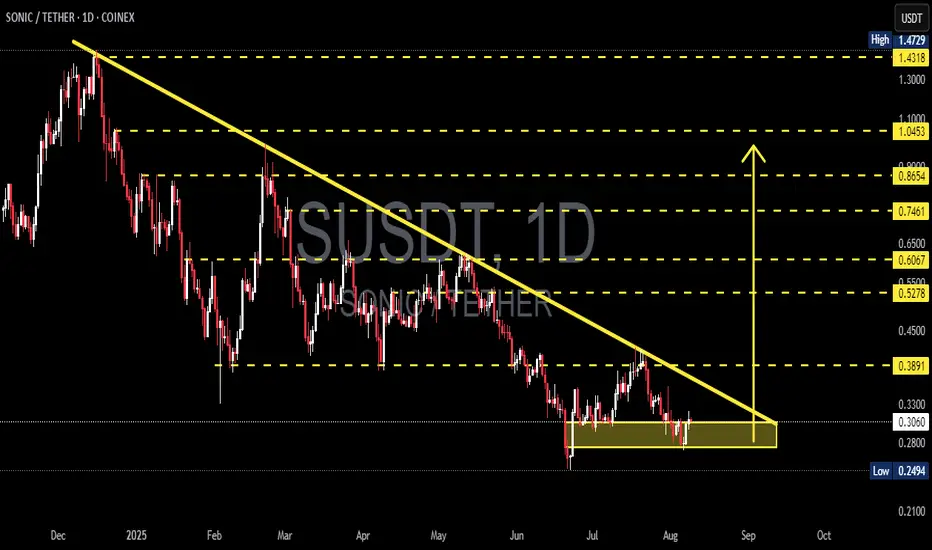
SONIC/USDT — Descending Triangle at Key Support!Overview
The daily chart shows a clear medium-term downtrend (well-defined descending trendline) meeting a strong horizontal support zone around 0.25–0.31 USDT (yellow box). Current price ≈ 0.3059 USDT. This structure forms a descending triangle or accumulation range, signaling that the market is in a decision phase — either a bullish breakout or a bearish continuation.
---
Key Levels
Current Price: 0.3059
Support Zone: 0.2494 – 0.305 (historical low at 0.2494)
Descending Trendline Resistance: ~0.33–0.35 (dynamic)
Next Resistances: 0.3891, 0.5278, 0.6067, 0.7461, 0.8654, 1.0453
Breakdown Measured Target: ~0.11 (if 0.2494 breaks)
Potential % moves from current price:
To 0.3891 ≈ +27.2%
To 0.5278 ≈ +72.5%
To 0.2494 ≈ −18.5%
To 0.11 ≈ −64%
---
Pattern & Interpretation
Main Pattern: Descending trendline + horizontal support = descending triangle (bearish bias unless broken to the upside).
Bearish Signal: Lower highs structure, price still under the descending trendline, supply pressure dominant. A daily close below 0.2494 with high volume = breakdown confirmation.
Bullish Signal: Daily close above the trendline (~0.33–0.35) with strong volume, followed by a successful retest = breakout confirmation. Extra confirmation if price breaks and holds above 0.3891.
---
Scenarios
Bullish
1. Break & daily close above trendline (~0.33–0.35) with rising volume.
2. Retest holds as support.
3. Targets: 0.3891 (+~27%), then 0.5278 (+~72%).
4. Stop-loss: below support box (~0.28 or safer < 0.2494).
Bearish
1. Daily close below 0.2494 with strong volume = breakdown.
2. Measured move target ≈ 0.11.
3. Conservative target: psychological zones 0.18–0.15.
4. Stop-loss for shorts: above 0.305–0.33.
---
Trading Notes
Conservative Long: Wait for breakout & retest above trendline.
Aggressive Long: Enter near support (0.26–0.30) with tight stop below 0.2494.
Short: Only after confirmed breakdown below 0.2494.
Always watch daily close + volume to avoid false signals.
---
Conclusion
Current trend is bearish, but the strong 0.25–0.31 support keeps the possibility of a short-term rebound alive.
Decision point: Breakout above 0.35 → bullish rally, Breakdown below 0.2494 → extended sell-off.
Risk management is key — use stop-losses and position sizing.
#SONIC #SONICUSDT #CryptoAnalysis #SupportResistance #DescendingTriangle #Breakout #Altcoin #RiskManagement
Sonic(based on NEo wave)Soon Sonic will start heavy bullish waves to the targets which shown with blue lines.
95% it is a diamnod diametric and we cant consider this as descending triangle because there is no overlap between wave d and a.
S - SONIC 1DSonic lacks the buying volume to break through its resistances.
The project, after a name change, has become Matic 2.
I expect that we'll soon reach support levels of 30 cents and 25 cents after the pullback is complete. If these supports are broken, the next support levels will be 20 cents and 17 cents.
If the 40 to 43 cent resistance breaks with high volume, there's a possibility of growth to 50 cents. If 50 cents is broken, growth to 63 cents becomes possible.

$SUSDT (or S , ex FANTOM): good entry for a long setupCrypto Market Outlook
The overall crypto market is in a clear uptrend.
The money printer is running, and USD dominance is dropping — all signs pointing to a potential continuation of the rally in the coming months.
Unless a black swan event hits, it's not too late to position yourself if you’re still on the sidelines.
⚠️ Always manage your risk with a proper stop loss — altcoins move fast and can reverse just as quickly.
One interesting setup: $S
✅ Relatively new
✅ Didn’t pump too hard
✅ Broke out of its downtrend
✅ Found solid support
The Fib levels offer good targets for take profit zones.
🔍 Ideal entry: within the green box or lower.
Let the pump cool off — it could offer a perfect entry opportunity. Be patient and wait for a good position.
If $S pumps from here without retrace:
→ Jump in with a tight stop loss
→ Or look elsewhere for a better risk/reward setup.
DYOR.
#Crypto #Altcoins #Bitcoin #ETH #Trading #CryptoMarket #TechnicalAnalysis #RiskManagement #DYOR

Sonic meme Goglz looking good for explosive moveSonic airdrop in a few days. I will be very surprised if Sonic's main memecoin Goglz doesn't ride the wave a bit. The graph looks good and with some momentum and a continued strong market, 35% TP shouldn't be too far off. Who knows where Sonic and Goglz will be in November/December 2025.
This is a risky idea for those who like memecoins and high risk. I like the timing of the graph and Sonic airdrop (stimulus meme money).

Trade setup with a 4:1 R:R for S (formerly FTM)BTC is likely about to continue its move toward 135K — if you're a bull, this is a solid setup with a 4:1 R:R.
Entry: 0.36
Stop Loss: 0.30
Target: 0.60
SONIC/USDT Breakout in Progress? Watch This Critical Level Close🧠 Technical Breakdown – Daily Chart (1D, Coinex)
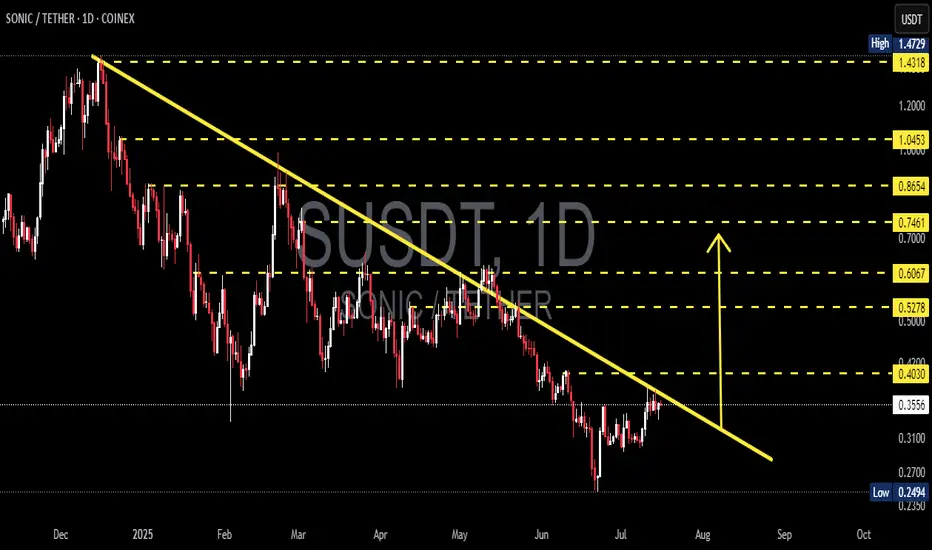
The SONIC/USDT pair is currently exhibiting a textbook descending trendline breakout setup, formed over the past 7+ months. This long-term downtrend has been respected since late November 2024, connecting multiple lower highs and establishing a well-defined bearish structure.
However, recent price action shows a potential trend reversal as the pair consolidates tightly near the apex of the structure, with signs of breakout momentum building.
📐 Pattern Identification:
✅ Falling Wedge / Descending Triangle
✅ Continuous lower highs connected by a descending trendline
✅ Support held above $0.25 (strong demand zone)
✅ Price now testing the upper boundary of the trendline
This is a classic bullish reversal pattern—especially when price breaks out after long-term compression.
🚀 Bullish Scenario:
Should SONIC successfully break and close above the $0.4030 level (trendline + horizontal resistance), it could unlock a wave of bullish momentum. Here are the key upside targets based on Fibonacci retracement from the previous high ($1.4729) to the local low ($0.2494):
🎯 Resistance Level Significance
$0.5278 0.382 Fib – First major target post-breakout
$0.6067 Key confluence level – psychological barrier
$0.7461 0.618 Fib – Bullish continuation zone
$0.8654 High momentum extension
$1.0453 0.786 Fib – Reversal confirmation
$1.4318 Retest of the all-time high
If volume supports the breakout, we could see a sharp move toward these zones.
🧨 Bearish Scenario:
If price fails to break out and gets rejected from the trendline:
It could retrace back toward $0.3100 and $0.2700
A daily close below $0.2494 (previous low) would invalidate the bullish setup, signaling potential continuation of the downtrend
Traders should monitor RSI divergence and volume drop as warning signs
📌 Why This Setup Matters:
This is not just a short-term play. A successful breakout here signals the end of a multi-month downtrend and the potential start of a new macro uptrend. SONIC has been heavily compressed — and the tighter the coil, the bigger the move.
Smart money often enters before the breakout confirmation. Monitor for volume surges, candle structure changes, and key breakout retests.
✅ Summary:
🔄 Trendline breakout imminent
🟢 Watch for breakout confirmation above $0.4030
🔴 Breakdown below $0.2494 invalidates the bullish thesis
🧭 Fibonacci levels offer reliable target zones for profit-taking
This is a critical make-or-break zone for SONIC/USDT. Traders, be ready.
#SONICUSDT #BreakoutSetup #AltcoinAlert #CryptoAnalysis #TrendReversal #TechnicalAnalysis #CryptoTA #Altseason #FibonacciLevels #PriceAction
Idea for Sonic bulls - swap Sonic to BRUSH (Paintswap)!I might have unreasonable expectations for Sonic. But I see Sonic as the most underrated L1.
Airdrop and big news coming up for Sonic in the coming week(s).
If you are a mega Sonic bull as I am, you probably just want to accumulate some more Sonic!
This is an idea how you can accumulate more Sonic...
A part Sonics airdrop is traded as an NFT on Paintswap exchange, which is a great NFT platform. If the airdrop "trading" goes smoothly, I think a portion of the airdrop money will go straight into BRUSH (Paintswap exchange token). The airdrop will create momentum and bring more traffic and new users to Paintswap.
My long term goal (as a Sonic bull) is to accumulate more Sonic. One way to do that could be to swap some Sonic -> BRUSH. I think a confirmed "break of trend" will be a good timing to swap a small amount of Sonic to BRUSH.
It looks timing wise that BRUSH breakout will happen at the same time as the airdrop.
If the swap S->BRUSH idea plays out it could give 60% more Sonic.
No financial advice
