Soybean

Grains will shock youWith all the drama of last year and many areas locked down, one of the big sufferers was agriculture. Much of last years yields went to waste and panic buying occured. Which I'd guess also went to waste for the most part.
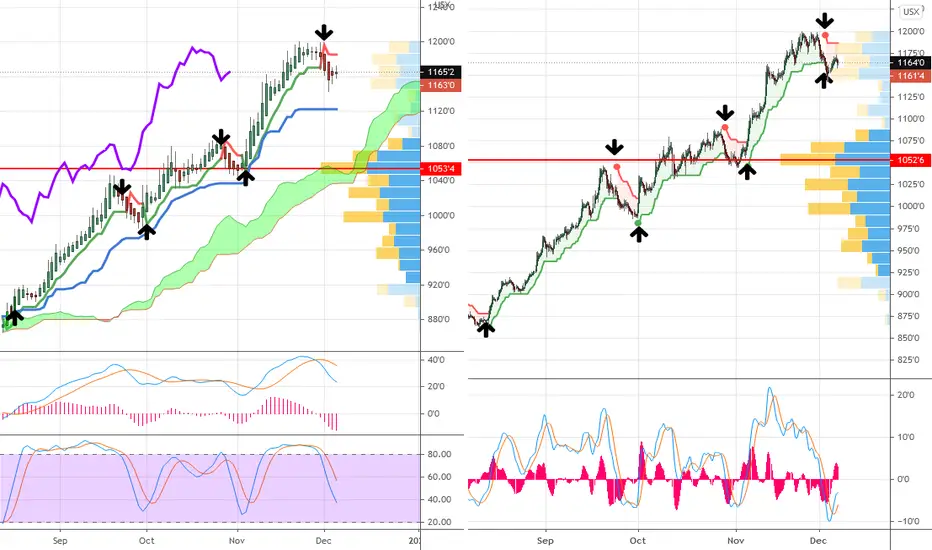
As you can see on my chart I'm expecting a sizeable pullback in price before the event, which is completely normal.
let it collect the orders down there and get in where you feel comfortable.
From there hold way into 2022. I wouldn't like to call the top on this, but it'll be impressive.
Checkout soybean and corn also. Why do you think they drove up so hard in price?
Happy trading and don't long just yet. (July?).

Sell Soybean futufes (JUL 2021)Sell from 1547 and 1568, stop 1635.25, target 794
Transfer of sales from the previous contract (MAY 2021)

Soybeans - Short IdeaI see price has had a great run up, this is the 4H chart but the daily is speaking to me. Price has confirmed by a small pullback and now showing rejection at the 50-61.8% Fib levels, price showing an engulfing pattern at those levels.
Soybeans is a touchy commodity, I would think.. like all commodities right now, more upside.. but certainly room for a relaxation of price here, 2:1 tucked in before hitting the 4H 200 EMA.
Its a solid short setup... that is all we can do, take good setups and manage risk...rinse & repeat.
1% Risk.


Soybeans - Short IdeaLove me some Soy.
I see the short, price has rolled over, price did pop really strongly, I would not have longed, the technical picture has advanced and I see the doji on the weekly chart.
The short 2:1 can be tucked in here on the retest of that support area. Let's see what we get here.
Remember, break even is still a good trade.
1% risked.
-Happy Trading!


Commodities🥜Wolves🔥
We have found new instruments to trade and make money on it for you.
There is an ascending triangle formation on Soybean(commodities).
There was a strong bullish sentiment before. So this formation may become a confirmation of trend continuation.
According to Elliott Waves theory Wave D is done and the price is heading to Wave E.
So follow the chart and look for the breakout.
If you enjoy my FREE Technical Analysis , support the idea with a big LIKE👍 and don't forget to SUBSCRIBE my channel, you won't miss anything!
Feel free to leave comments✉️
And always remember: "we don't predict, we react".

Sell Soybean futures (MAY 2021)Sell from 1433 and 1546, stop 1635.25, target 794
Transfer of sales from the previous contract (MARCH 2021)


SoyBeans (ZS1!) LONG; Long term BUYCBOT:ZS1!
.
Looks like it's headed >$15000, rather relentlessly.
This very well could get up there something like this;

Sell Soybean (MAR2021)Sell from current and 1340.00, stop 1400.00, target 892.50
Transfer of position c (ZSF2021), due to the short expiration time of the contract.


Soybean huge uptrendThis is the type of uptrend that I love. Three good strong up-legs on soybean 4hr. Would have been great trading calls on this. I was too nervous about the liquidity to buy calls on it.

Soybeans - Short IdeaI have "bean" watching Soybeans for sometime now. I see price has entered an area of resistance, has hit a whole number of $12 and my heatmap indicator is showing divergence.
Price has fallen through my trendline.
I will be going short.
On the daily charts, a couple of shooting stars are present.
Enjoy!

Soybeans - Watching.Weekly Chart
I'm watching this chart for a fade in the future. A serious run up, caught some upside on this one. previously post.

Weekend Update – 18 Oct 20 | FCPO, Soybean, Soybean Oil, FXWeekend Market Update – 18 Oct 2020 | FCPO, Soybean, Soybean Oil, Currencies and Others
Take note that the updates here are 2 days late. If you would like the latest updates, please visit palmanalysis dot com
Review
Let’s start the report with a review of the past 2 weeks.
1) In my last update on the 4th Oct, I expected:
On Soybean
i. On Point 13 ii, I favored slightly higher Soybean prices due to the relative strength, and we did see higher prices in the 3rd week of Oct, and prices had a pullback last week.
On Soybean Oil
ii. On Point 46 ii, for Soybean oil to complete its second leg down and if the support at 31-29 holds and to see the strength in the subsequent bounce
iia. Price found support at 31.50 and had a good bounce. It then had a slight pullback last week.
On FCPO
iii. On Point 46 iii, To see FCPO 2 legged pullback to 2800-2650-00, and then a re-test higher, and would want to see if the re-test of the highs is strong or weak .
iiia. Price found support at 2690, and the first leg of the re-test was quite strong going back up to 3000 by the 12/13th of Oct. It has pulled back slightly since then.
On RMB and INR
iv. On Point 46 iv, I want to see RMB and INR strengthen – We have that in RMB but INR is Flat
On Dollar Index
v. I expected the Dollar Index to find support around 93-93.50 – Price found support at 93 and had a bounce last week.
You can refer to the Weekend Updates – 4 Oct 2020 | CPO, Soybean, Soybean Oil & Currencies here.
What’s up ahead?
Soybean Monthly
2) In my last update On Point 6, I said that price would attempt to break above the highs of Sept and test the top of the trading range around 1080-1100.
i. Price tested very close with a high in Oct at 1079. Price has pulled back since and price is currently trading in the middle of the month’s range with another half a month to go.
3. i. Bears wants price to close below the middle of the month or as low as possible and to have a candle with a bear body.
ii. Bull on the other hand wants a strong retest of the 1080-1100 top of the multiyear trading range and break strongly above it to test the highs of 2016 around 1170-1200.
Let’s look at the weekly chart.
Soybean Weekly
4) So far prices is still in a tight bull channel which is strength in the buyers.
i. It looks to me that we are forming a spike and channel bull trend, and in the process of forming a wedge push up – with second Oct week push being the second push up in the wedge.
ii. If this is true, we could see another push up in the next 1-2 weeks – the bulls wants a strong close above the 1080 top of the multiyear trading range;
iii. The bears on the other hand wants price to fail at the top of the trading range and reverse down instead.
iv. The current bar is a bear bar but with a big tail below, which is a weak sell signal bar. If price trade below last week’s low, we may see more buyers than sellers below.
5) I do feel the overall global picture is a bit murky at this moment due the the following factors
i. If we have dollar start strengthening in the next 1-2 weeks, it is generally bad for equities and commodities.
ii. However we have to take note that in Sept, the Dollar strengthened and equities fell, but Soybean bucked the trend and went up instead, which is showing relative strength. The story behind the up move was strong demand from China.
iii. So we have to monitor whether a) Dollar continue to strengthen or weaken (weaken is good for commodities like Soybean/ Soybean Oil / Palm) or Strengthen, and b) if strengthen, will Soybean follow into weakness or buck the trend yet again like Sept?
6) For now, as price is still in a tight bull channel, I suspect we may see a little bit more pull back, and then a 3rd leg up to form for the wedge pattern.
Daily Soybean
7) On the Daily chart, we see price consolidating in a small sideways trading range between 1030-1080 in the last 1 and half week.
i. This potentially sets up a final bull flag – which if true, means there should be another small sideways to up leg from here.
8) We do see some bear bar, but no significant selling pressure as there were no consecutive bear bears since Oct started.
i. We will have to monitor on this point to see if selling pressure develops next week.
Soybean Oil Monthly
9) So far Oct is the first pullback following a 5 month micro bull channel. The monthly chart so far is a doji bar which means the bulls and bears are currently in balance around these prices.
i. Notice last month was also a doji bar which means balance around these prices of 32.70-33.30 range.
ii. The bulls wants the monthly bar to close above the middle of the bar, as high as possible, while the bear on the other hand wants prices to close below the middle of the bar and as low as possible.
iii. With 2 more weeks to go, the bars can look very different by the end of the month.
Soybean Oil Weekly
10. Last week closed as a bear bar, which is a sell signal bar for the bears.
i. I think it is fair to say we will see bears attempt to push prices below the low of last week to attempt the second leg down for Soybean Oil which started in Sept. Will they succeed? We have to look at a few other factors such as:
ia. The Dollar
1b. How strong soybean is holding up
ii. If the bears get their way, we may see SBO test back the 31.50.
iii. The bulls on the other hand wants to see the breakout below last week’s low to fail, and then reverse up for a second leg up which started in the second week of Oct.
Soybean Oil Daily
11) So far on the daily chart, it looks to me that the whole of last week was a 2 legged pullback against the stronger 2 legged bull leg which started in Oct 5 to Oct 9.
i. Price is currently consolidating around the 20ema area, which is the average price traders are looking at. Notice that the bounce during the end of Sept also tested this area of 33.
12) Both the bulls and bears look like they each have credible setup.
i. The bears have a double top second leg down sell setup, while;
ii. The bulls have a second leg up from the Oct 5-9 bull leg.
iii. With credible setup for both the bulls and bears, this is classic indication for trading range price action. Neither the bulls nor the bears have a strong edge at the moment.
iv. We will have to look at other factors to give us slightly more information which we will cover below.
Dalian Palm Olein Monthly
13) On the Dalian Palm Olein Chart, so far the monthly chart, price is trading near the lows after gaping up after the long holiday break.
i. Price has a prominent tail above, which also indicates profit taking towards the higher prices traded. Notice last month also had a prominent tail above. It indicates that prices are finding sellers near the high of the multiyear trading range.
ii. With 2 weeks to go, the monthly chart could still look very different from now.
iii. The bears wants price to trade lower and for prices to close with a bear body and a big tail above. That would setup a strong sell for Nov.
iv. Then bulls on the other hand wants the trend which started in May to continue as price is still trading in a bull micro channel.
Let’s look at the weekly chart.
Dalian Palm Olein Weekly
14) Last week closed as a doji looking bar with a small bear body with prominent tails above and below the bar.
i. So far, the bull channel is quite tight, but prices are trading near the top of the multi year trading range.
ii. Price is currently trading near in the middle of the 4-5 weeks sideways trading range which is a sign of balance.
iii. When prices are in a trading range, traders reverse from buying to selling every few days, and credible setup tends to disappoint both the bull and bears.
Not much clarity on the weekly chart too. Let’s see what’s up on the Daily Chart.
Dalian Palm Olein Daily
15) On the daily chart, last Friday traded lower, then back up and closed the day with a prominent tail below.
i. The bulls will be asking if this is the pullback from the Oct leg up, which will be followed by another leg up?
ii. While the bears on the other hand are asking if this is the continuation down for the second leg which started at 22 Sept?
16) I think we need another few more days price action to have more clarity on this.
i. Should price trade back up from here, traders will assume that the sell off from last week was simply a pullback which will be followed with a second leg up.
ii. If price continue to trade lower, then traders will assume that the second leg down from the Sept sell off is resuming.
17) With both a credible buy and sell setup, this is classic trading range price action – the price action disappoint the bulls and bears every few days.
i. I am slightly more leaning towards the bullish case due to the lower palm production this month.
Not much clarity here either. Let’s look at FCPO below.
FCPO Monthly
18) So far on the monthly chart, Oct traded below the low of Sept early in the month and found buyers there.
i. Price is still trading above its middle of the bar, and has a bull body with a tail above. Currently price still slightly favors the bulls.
ii. With 2 more weeks to go, the bar could look very different by the end of the month.
iii. Price still remained in a tight bull channel for now which is a sign of strength for the buyers.
Weekly FCPO
19) Price closed this week as a bear bar, which is a sell signal bar for next week.
i. The bears are looking at last week’s bear bar as the sell signal bar for a second leg down from a double top with Sept’s high.
ii. The bulls on the other hand sees last week’s pullback as the pullback for a second leg up.
iii. Both the bulls and the bears have a credible setup, which is classic trading range price action.
Daily FCPO
20) Price closed as a small bull bar with a prominent tail above.
i. The bears see the 15 Oct sell of as the start of the second leg down from the end of Sept sell off. Another few more day’s price action should give us the clarity we need to see if this second leg fails.
ii. The bulls on the other hand sees last week’s sell of as the pullback from the strong Oct 5 to Oct 12 leg up, and should the bears fail to resume their second leg down next week, the bull will assume their case has more merits and will buy the pullback for a second leg up to retest the highs of the trading range.
Other issues effecting Palm Oil.
21 i. Production trend looks like it is heading lower this month between the range of -5% to -10% or more. This is a bullish factor for the bulls.
ii. Exports for the first 15 days shows slightly down -2% to -3% against Sept, but you have to remember, Sept was up 12-13% against Aug. This means, the exports for Oct is not that bad if compared to Aug levels, just slightly lower than last month.
iii. So far, no significant rain nor flood effecting palm.
Let’s look at the currencies.
Dollar Index – DXY
22) So far the Dollar continued its pullback to 93-93.50 as we have expected. It then bounce last week, trading slightly above 93.50.
i. As I have said previously, a strong dollar is bad for commodities such as SB, SBO, Palm.
ii. Price is currently trading at the bear trend line and I will be monitoring if there is another leg down to test 93 again, before we have a big strong bounce up to 95-96 area, or,
iii. If prices continue to trade up from here. Remember, a strong Dollar is bad for SB, SBO, Palm.
23) In my last update on Point 47) I wrote that – is it possible where we see the Dollar Index strengthen but Palm prices still holds and not drop much?
Answer is yes, its possible. Why?
i. What if production levels drops off significantly? This is good for bulls.
ii. What if it starts to rain at any moment, we see severe flooding in ffb production states and disrupts harvest? This is good for bulls. (though there are no signs of this right now)
iii. What if exports figures are good? This is good for bulls. (So far exports are slightly lower than Sept, but still much higher than Aug)
iv. What if the Dollar index strengthen against other currencies, but remains weak against RMB and INR? This is also good for SB/SBO/Palm.
iv. So a strengthening Dollar Index does not necessarily equals lower Palm Prices. We need to see it in relation to the RMB, INR, local productions, demand and related factors.
So I will be monitoring the Dollar in conjunction with Point 23 above.
USD/Chinese Yuan
24) Happy note for Chinese Soybean buyers. The RMB continues to strengthen against the Dollar. This is supportive for Soybean purchases.
i. I would like to see the RMB continue to strengthen or at least stays flat and not weaken against the USD.
Indian Rupee/USD
25) The Indian rupee mostly traded sideways – flat.
i. I would like to see an INR that is strengthening or at least flat and not weakening against the USD.
USD/MYR
26) The Ringgit was mostly flat in the month of Oct, it strengthened very slightly.
i. I would like to see a Ringgit that is weakening or at least stays flat against the Dollar.
ii. If the Ringgit is strengthening against the Dollar, then I would like to see the RMB & INR also strengthening as much or more relatively.
Other Factors to look at:
Crude Oil
27) In my last update, I said that I would like to see Crude start ticking higher after testing support around 36 – 34 area.
i. Price held around the 36.60 area and didn’t trade lower and bounce from there.
ii. Price is trading around the 41 area which is the high of the recent trading range area.
iii. Price attempted to sell off 2 times on last Thurs and Friday, but reversed back up, with large prominent tail below.
28) I would like to see crude continue to trade higher as it indicates a stronger overall world economic conditions – more cars on the road, more flying, more energy usage for economic output. A weaker crude oil is generally not supportive for commodities prices such as SBO and Palm.
Other, Other Factors to look at:
28) There is a presidential election in the USA in the 3rd Nov.
i. We have to keep this date in mind because it could move the Dollar in either direction which will effect commodities prices.
28a. On Covid Cases.
i. The western world in heading into the fall/winter months which experts believe Covid cases will increase due to people spending more time indoors.
ii. We are already seeing spikes in cases in France, Spain and other countries.
iii. Remember we had a state election in Sabah, and cases in Malaysia just boomed?
iv. Well, the USA election is on the 3rd Nov. What if it happened like Sabah, and the election in USA caused cases to spike uncontrollably to 100k to 200k or more daily cases? Something to watch out for.
Summary
29) So far from the charts, this week, prices are much more murky and unclear than previous few weeks.
i. There are credible buy and sell setup for the bulls and bears, with each not having a large edge against the other.
ii. This is classic trading range price action – in trading range, people sell high, and buy low of the trading ranges.
iii. The currencies offer slightly better picture because RMB is strengthening against the USD, and we will monitor if this will support SB prices next week.
iiia. We have to also monitor if RMB can continue to maintain these levels or if it weakens back against the USD. A weakening RMB I think will not be supportive of Soybean Prices.
iv. Not much to see from Indian Rupee as it has been trading Flat against the USD – just slightly higher
v. Ringgit strengthen slightly against the USD also – I prefer to see a weaker Ringgit in the next 1-2 weeks.
30) What I am monitoring:
i. If Dollar have another small leg down to create a double bottom at 93 before rallying – (if it rallies at all)
ii. FCPO – Whether the selling price action from last week was merely just a pullback before a second leg up.
iia. With production being so tight, there is a chance of this happening – even against a strengthening dollar.
iii. Soybean – If we see another leg up to complete the 3rd leg of the wedge pattern to retest the 1080-1100 top of the trading range.
iv. Soybean Oil – whether the sell of last week was merely just a 2 legged pullback, before the second leg up in Oct resumes.
We should have more clarity with a few more day’s price action.
I am slightly leaning towards the bulls case for a small sideways to up move in the next 1-2 weeks. With more information, I may change this stance and will update accordingly.
From the above, it should more or less give you some context to the current state of the market conditions.
Should there be no major changes from my analysis above, I will update again next weekend.
Trade safe, and I welcome any feedback from you.
Best Regards,
Tech Trader


Weekend Updates – 4 Oct 2020 | CPO, Soybean, Soybean Oil & FXWeekend Market Updates & Analysis 4 Oct 2020
What Happened
1) FCPO opened higher Monday and then traded lower by Friday, closing near the low of the week.
Recap from last Weekend’s update.
You can read last week’s update here: Weekend Updates – 27 Sept 2020 | CPO, Soybean, Soybean Oil & Currencies
2) On Point: 58, 59, 60: In my last update, I have said that the odds favor a second leg down before we see a retest of the highs. So far we have the second leg down. Will it continue lower? We will look at these questions below.
On Soybean
3) On Point 26, I said that the bear inside bar closed at the lows, but followed a tight bull micro-channel. Sellers will try to push below the low, but will likely find more buyers below.
i. Prices did push below the low of the previous week, and did indeed find more buyers below, and reversed sharply on Wednesday (believed to be due to lower than expected Soybean stock report) and closed the week as a bull bar with a tail above.
On Soybean Oil
4) On Point 37, I said the bears are looking for a second leg down after a brief bounce and chances are they will likely get it in the next 1-2 weeks.
i. Market held steady for the first 3 days and sold off into the weekend for the second leg down to close the week as a bear bar closing at its low.
On Dollar Index – DXY
5) On Point 53, 55, I said that prices was trading at a trend line resistance at 94.50, and that we may see price pullback before deciding if it there will be another push up to test resistance.
i. So far we have the pullback to support at 93.50
ii. Market is still deciding if this support will hold, and if we will get the 3rd leg bounce up. We should find out by next week.
What’s up ahead?
Soybean Monthly
6) Soybean monthly closed back as a bull bar with a moderate tail above. Price is just within a touch of the multi year trading highs around 1080-1100 level.
i. This makes Sept bull bar as a buy signal bar for the bulls, and we will likely see an attempt to break above the highs of Sept.
ii. Should the bulls get it, we would then ask if the price can continue up to the top of the trading range around 1080-1100, and if prices can break strongly above it.
7) These areas tends to be magnet and target for the bulls. Will prices get there? Here are some of the things we need to look at:
i. China is now on holiday, and will be back to the markets on the 9th which is Friday of next week. Will they continue to buy more Soybeans?
ii. I think if we see a weakening of USD moving forward, I do not see why not because China still have a trade deal to fulfill and they would want to be seen as a credible trading partner holding up to their part of the Phase One trade deal in the eyes of the International community, .
iii. Also, should the stock levels for Soybean and production continues to decline, these are supportive for the market too.
iv. So we will need to monitor these accordingly.
Soybean Weekly
8) Soybean found more buyers after a failed break below last week’s low. This week closed as a bull bar but with a prominent tail above and below.
i. This is poor follow through from the bears and this is a positive point for the bulls. A consecutive bear bar would have made the bear’s case slightly stronger, but they were not able to create it. This week’s bar is a slightly weaker buy signal bar for next week due to the tail above.
9) So essentially, price has been trading sideways for the last 3 weeks between 985 to 1046 with this bounce.
i. Is price forming a potential Final Bull Flag?
ii. There is a potential for this, especially after an extensive run up, price is trading just below the multi year trading range highs and resistance around 1080.
iii. If this is true, it means that price may continue to consolidate here for a bit more, and then have at least another leg up into the top of the trading range attempting to break above the trading range and make new highs.
10) Can price trade down from here? Let’s look at the Daily Chart.
Daily Soybean
11) Soybean tested the support levels that we highlighted last week around 988 which is the 20ema on the Daily Chart.
12) The support held, and price has bounce to trade near the recent highs currently. Can price trade higher from here?
13) So far these are my thoughts:
i. The USD is generally strengthening in the last few weeks, “theoretically”, we should be seeing a lower Soybean price like Soybean Oil. The fact that prices is back trading near the recent highs is telling me the relative strength of Soybeans is there and is bucking the general market trends.
ii. We still need to see what Soybean does from here, but currently from its relative strength, I would favor slightly higher prices.
Soybean Oil Monthly
14) The monthly Sept soybean oil chart closed below the middle the bar, has a small bull body, has a large prominent tail above, and a noticeable tail below.
15) In my last update on Point 33, I said that “Should the bears fail to create a strong bear close for the month, but price still close below the middle of the month, it is still a sell signal bar for Oct, but a weaker one and we may find more buyers than sellers below Sept lows at support areas” primarily because this is the first pullback following a 5 month bull micro channel. Support areas that I am looking at is the 31, and 29 area.
16) On Point 37, I also said that the bears are looking for a second leg down and they are likely to get it in the next 1-2 weeks. So far the bears have managed to push below the lows of Sept, and currently the bar is a bear bar.
i. But because it is still very early in the month, by the end of the month, the bar can look very different that what it is now.
17) I have also said due to the 4-5 bull micro channel on the monthly chart, we will likely find more buyers below at support areas, because the bulls are likely to buy the 1-3 month pullback.
i. So I will be monitoring the 31 to 29 level as support areas for Soybean Oil.
Soybean Oil Weekly
18) In my update last week on Point 37 i, I said that the bears would be looking for a second leg down and they are likely to get it in the next 1-2 weeks
19) On Point 38, I said that “After the pullback is completed, we should see the attempt to rest the recent highs and if the re-test is weak and choppy, and stalls before reaching the highs, traders will conclude that the trend is over and prices will reverse at a lower high or at some sort of double top.”
i. This view still remain the same.
20) I will be monitoring if the levels 31 holds as a support, and if not, probably around the level 30-29.
Daily Soybean Oil
20) So far we are looking at the second leg down for Soybean Oil.
21) My views this week remains the same as last week and as I have summarized in point 19 above.
22) I will be monitoring if prices test the support levels between 31 to 29 and whether these support areas can hold for the re-test of the highs to happen.
Dalian Palm Olein (Monthly, Weekly, Daily)
23) I will not be updating on the Dalian Palm Olein market as China is still in a trading holiday until the 8th and their market will open on Friday of next week.
FCPO Monthly
24) In my update last week, I said that the bears would want to close the monthly bar near the lows, which makes at least slightly lower prices likely this week.
i. The bears manage to get that by Wednesday, and prices bounce slightly in the new month bar and then traded below Sept lows on Friday.
25) Last week I talk about the bears are likely to get their second leg down, and that the areas of 2800 and 2650-00 would be the support areas I will be looking at to see if it holds so that prices can create the attempted re-test higher.
26) The monthly bar has just started and is currently a bear bar. The bar could look very different by the end of the month.
Weekly FCPO
27) Last week I said we may potentially get an inside bar, which means prices trade at a small range – this is a common pattern following an inside-outside bar.
28) But I also said that the bears are looking for a second leg down, which they will likely get as the odds favor that, and thereafter, to monitor 2800 and 2650-00 areas as support areas as I suspect there will be more buyers than sellers below due to the strong trend up since May.
29) So far the bears are getting their second leg down. Price closed the week at 2708, and it is a bear bar, which makes slightly lower price next week a possibility.
30) I will be monitoring if we see strong profit taking from the shorts at the support areas that I have highlighted, and if the support areas hold, to see an attempt to re-test the recent highs.
i. We also have to monitor prices against other factors such as how Soybean, Soybean Oil, and the currencies are doing to make an assessment on how prices will behave moving forward.
Daily FCPO
31) On the daily chart, we can see prices resuming the second leg down, but the strength of the second leg is not as strong as the first leg as we can see the overlapping bars and choppy trade.
32) Price is still in the process to complete the second leg down and I will be monitoring the 2800-2650-00 areas and see if prices holds there.
i. Once the second leg is completed, I do expect to see an attempt to re-test the recent highs.
ii. The manner of the attempt (bounce) will tell us a lot about prices moving forward.
iii. A strong re-test of the highs with very strong buying pressure indicates that prices will attempt higher prices and try to break out of the 3150-3200 level, while;
iv. A weak re-test of the highs with weak buying pressure likely indicate that the bull move and test of the multi-year trading highs has ended and the re-test will likely be a lower high where bears sell the bear rally.
33) Take note that we have to look at the above together with these factors below also:
i. How is the Production in Oct? Rising? Decreasing?
ii. Is the expected rainy season happening causing massive flood and harvest disruption?
iii. Is the Covid situation in Malaysia worsening, and causing new strict Movement Control Order where businesses are not allowed to open again? (This will hurt confidence and demand)
iv. How is the USD as measured by the Dollar Index trading? A strengthening Dollar is bad for Palm, SB, SBO.
v. How is the Chinese Yuan and Indian Rupee trading in relations to the USD? (we will look at these below)
USD/Chinese Yuan
34) The USD has been steadily weakening against the RMB/Chinese Yuan since May. We saw the USD strengthened slightly last week, but this week, traded slightly lower again against the RMB.
35) As we have seen in the Dollar Index, the USD is attempting a bounce, but so far have just managed a 2 legged bounce and currently is in the pullback of the second leg. Should the USD create a weak bounce and then continue to weaken, that would be bullish for the RMB, which is bullish for Soybean/Soybean Oil, which is bullish for Palm.
36) So far from the USD/CNY chart above, the USD is weakening steadily in a tight bear micro channel – but prices is now sideways in the last 3 weeks, which indicates a small trading range around 6.8300 to 6.7500 area.
37) Can the RMB continue to strengthen against the USD? Looking at the tight bear channel, it certainly looks likely. At the very least, this sideways consolidation could be building at least as a Final Bear Flag, which means at least slightly lower prices are likely.
38) So we have to monitor this closely as a stronger RMB against the USD is good for commodities (Soybean/Soybean Oil) which is also good for Palm.
Indian Rupee/USD
39) I would also be looking at the Indian Rupee(INR) versus the USD. I believe logically that a stronger Indian Rupee against the dollar is favorable to Palm prices.
40) Why? Because all palm exports are traded based on USD, and with that view in mind, a stronger INR will be favorable to Palm exports because you can get more USD with less INR.
i. Alternatively, think of it this way: Can you imagine a situation where we have a weakening INR vs UDS (Cost more Rupee to buy USD, and then, a stronger MYR vs USD (Cost more USD to buy MYR?). Bad + Bad. Can’t be good.
41) So far there was a weakening of the INR vs USD in the month of Sept, but currently we are looking at the INR ticking higher last week and closed as a bull bar, but with a tail above. I think we should see slightly stronger INR in the next 1-2 weeks.
Dollar Index – DXY
42) So far, the Dollar Index has had a 2 legged bounce to the bear trend line, and last week pulled back to the 20ema on the daily chart which is support. There is also a lower trend line below as support around the areas of 93.50.
43) Currently, markets are watching if we will get a prominent 3rd leg up to test around the 95-96 area – a wedge push up or better.
i. Why I say prominent – because sometimes, the 3rd leg up can be very inconspicuous and may just be a 1 bar up, and reverse down.
ii. In this case, then the market will likely conclude that this bounce from Sept is likely just a bear rally, and will sell the bounce for a 3rd leg down to to test 92 area (recent lows) and then 88-90 area as I have discussed in my previous 2 reports.
44) So I think the next 1-2 weeks are crucial to monitor the movements of DXY. A stronger dollar is bad for commodities prices namely Soybean/Soybean Oil/ Palm and vice versa.
45) Personally, I think we are going to see slightly higher prices in DXY to around 95-96 in the next 1-2 weeks (which is temporary not good for commodities), and I will be looking at the buying pressure of the bounce. A weak 3rd leg up indicate that it is just a wedge bear rally and we will likely see a weaker dollar in the near future.
i. I will be monitoring the Dollar as per the above accordingly.
Summary
46) We have covered a lot of grounds and these will be what I will be looking at:
i. Soybean traded back near the highs. – is price consolidating sideways, and preparing for another move up? Or is price trading lower next week? First is good for the bulls, while the second is good for the bears.
ii. Soybean oil to complete its second leg down, and to monitor if 31-29 area holds as support – and if support holds, to monitor the strength of the bounce from there. A strong bounce = good for the bulls while a weak bounce is good for the bears.
iii. FCPO is currently also forming its second leg down. I will be monitoring if the areas between 2800-2650-00 area holds as support for prices, and if yes, to monitor the strength of the bounce from there. A strong bounce = good for the bulls while a weak bounce is good for the bears.
iv. Generally I can see the RMB and the INR is strengthening against the USD. I would like to see this continue which is favorable to the bulls, or at least sideways. A significant weakening of RMB and INR against the USD I think will definitely not be a good factor for SB/SBO/Palm.
v. I think the Dollar is trying to find support around the areas of 93-93.50, and if the dollar finds support and bounces in the next 1-2 weeks to 95-96, this will not be favorable for commodities prices at least temporarily. I will also be monitoring for an inconspicuous 3rd leg up – maybe a 1-2 bar up, then reverse down. If this happens, I think the market will believe this recent bounce is just a wedge rally and sell it.
47) As I have highlighted last week in Point 63 of last week’s report, is it possible where we see the Dollar Index strengthen but Palm prices still holds and not drop much?
Answer is yes, its possible. Why?
i. What if production levels drops off significantly? This is good for bulls.
ii. What if it starts to rain at any moment, we see severe flooding in ffb production states and disrupts harvest? This is good for bulls.
iii. What if exports figures are good? This is good for bulls.
iv. What if the Dollar index strengthen against other currencies, but remains weak against RMB and INR? This is also good for SB/SBO/Palm.
iv. So a strengthening Dollar Index does not necessarily equals lower Palm Prices. We need to see it in relation to the RMB, INR, local productions, demand and related factors.
48) So for next week, things are status quo as per last week’s update. I will be monitoring:
i. How strong the current leg down in FCPO is (not very strong currently);
ii. Whether the areas of 2800-2650-00 area holds for a re-test higher;
iii. and if we get the re-test higher, how strong is the re-test? Strong = good for bulls.
iv. At the same time, to monitor if we have a a weakening or strengthening Dollar against CNY & INR.
49) Can prices continue to drop off to say, 2400 non-stop?
i. While there is always such a possibility, currently I would say the probability of this happening is lower than prices having at least a small sideways to up re-test of the highs after holding at support.
ii. The reason for this view is that we can see Soybean currently traded back to near its highs; and
iii. We do not have a firm strengthening of the Dollar – Its just a bounce at this point.
iv. Unless Soybean suddenly sells off aggressively, then I would start to be worried about Palm too.
Other Black Swan Factors To Watch
50) i. Covid cases is ticking up in Malaysia. If we get another strict Movement Control Order, it might hurt confidence and consumption.
ii. The leader of the freeworld is sticken with Covid. He should get the best medical care in the world. But (*touch wood) in case he kicks the bucket, this will likely cause a shock to the world markets and we may see big movements in all instruments such as commodities and equities (big gap down likely).
iii. Even if he doesn’t kick the bucket, he might emerge from this sickness being more resolute to fight the disease he has been writing off until recently, and we may see potentially drastic action from him (though unlikely – just something to watch out for)
What Did I miss out?
51) I also want to touch a bit on Crude Oil.
52) Crude is currently forming the second leg down – which looks like just like a technical correction since the big sell of in April.
53) Preferably, I would like to see Crude start ticking higher after testing support around 36 – 34 area. Lower crude price is generally not so favarable to commodities prices because it can indicate:
i. General world demand and thus economy not doing very well. Why? A strong world economy with strong consumption of energy for economic production, automobiles and flying should cause higher crude prices.
ii. So if crude continues to trade lower and lower, that does that tell you?
iii. Well it tells us that demand is not as strong.
i.e. Less airplanes flying, people driving less due to lockdowns, industries buying less energy for their production usage while output for crude oil can be expanded at any time (Opec and other producing countries are already cutting down their production which can be increased at any time).
So I will be keeping an eye out for Crude as well as a general barometer for world economic health. If we see more and more countries resort to strict lockdown globally as we enter the colder seasons and potentially 2nd and 3rd wave of Covid cases, this will be negative for Crude, and hence, general sentiments and confidence.
I think that’s it for now. It is likely that there will not be an update from me next weekend as I will be away for a personal matter. So unless there are big changes to my analysis this week, I may publish a short quick update on the major changes. Otherwise, expect no updates from me next week.
Wishing you well, trade safe, and as always, if you have any feedback, do get in touch with me.
Thanks for reading.
Best Regards,
Tech Trader

We are getting close to trend changeIt has been a long time since my last Soybean forecast. It is time to pay attention to this market. It is setting up for the decline. Commercials are heavily selling, the seasonal tendency is to the downside, and Insider Accumulation is turning bearish. So, if on Monday we get below Friday’s low, that will be a sell signal. However, it seems like it will take more time to form some pattern. We may see a very short-term rally followed by a sell signal formation. Don’t hurry and wait for confirmation. We have a good setup, but timing matters a lot in this business.
