SPYCurrent bounce spot is here.. 388-390 is that level. Sell through it and we see plentiful more downside to come on it.
Would think 406 is still possible to the upside if it can get bought up although I'm not buying this myself.
SP

SPX SP500 Bottom predictionHere is my prediction of the SP market bottom.
How do we get here. well currently the small and medium stocks that were overpriced have been smashed, I'm talking about all specs the poster child of the 2020 run, all speculation stocks lemonade, zoom, peloton and other retail favourites have been killed.
Ive always said the market will bottom when the big names finally give way, I'm talking about apple Tesla Nvidia has already started. eventually the market masters want to buy at prices they always want to buy at, cheap. when Tesla finally comes from 100 PE ratio to 40, apple back to 20 nvidias down to 25 that's when the market bottoms. its always the big stocks that hold the market up last and right now we are in that phase.
keep your eye on Apple its currently around 158/160. this could easily collapse to 130 again if not lower Tesla down to 180/200. this will be the time to load up for the next 5 -10 years. patience is key here don't fight the fed, trend is your friend and no real reversal is in play imo until demand destruction has happened, recession is here, unemployment comes up to 7/8%, interest rates continue to raise higher causing new mortgages to come to a stand still as people won't be able to afford to buy, housing starts coming down again all of this is definitely possible in my opinion. don't forget loads of other macro events too.

MESU LongCME_MINI:MESU2022
Current market structure, sell-side was taken with a displacement to the upside. Entering long after 8:30am on a return to a discount relative to the current trading range. Stop placement below 3903.25, targeting previous day high. Keeping the risk low because of non-farm payroll. Anything can happen!

Update on $ES1!Opinion:
- ES1 tested demand zone and successfully bounced from it.
- Break Above 150D MA showing bullish momentum
Strat:
- Sit
- Assess
Notes on how I personally use my charts/NFA:
Each level L1-L3 and TP1-TP3 has a deployment percentage. The idea is to flag these levels so I can buy 11% at L1 , 28% at L2 and if L3 deploy 61% of assigned dry powder. The same in reverse goes for TP. TP1: 61%, TP2:28% and TP3:11%. If chart pivots between TP's and L's these percentages are still respected. I like to use the trading range to accumulate by using this tactic.
Just my personal way of using this. This is not intended or made to constitute any financial advice.
This is not intended or made to constitute any financial advice.
FED Macro Situation Consideration:
All TP's are drawn within the context of a return to FED neutral policy. I do not expect these levels to be reached before tightening is over.
NOT INVESTMENT ADVICE
I am not a financial advisor.
The Content in this TradingView Idea is for informational purposes only, you should not construe any such information or other material as legal, tax, investment, financial, or other advice. Nothing contained within this idea constitutes a solicitation, recommendation, endorsement, or offer to buy or sell any securities or other financial instruments in this or in in any other jurisdiction in which such solicitation or offer would be unlawful under the securities laws of such jurisdiction.
All Content on this idea post is information of a general nature and does not address the circumstances of any particular individual or entity. Nothing in the idea/post constitutes professional and/or financial advice, nor does any information on the idea/post constitute a comprehensive or complete statement of the matters discussed or the law relating thereto. You alone assume the sole responsibility of evaluating the merits and risks associated with the use of any information or other Content on the idea/post before making any decisions based on such information.

SP500 Wave StructureThis is a follow up to my previous SPS500 analysis. Have a look at the idea mentioned below to check the wave structure on Daily Chart:
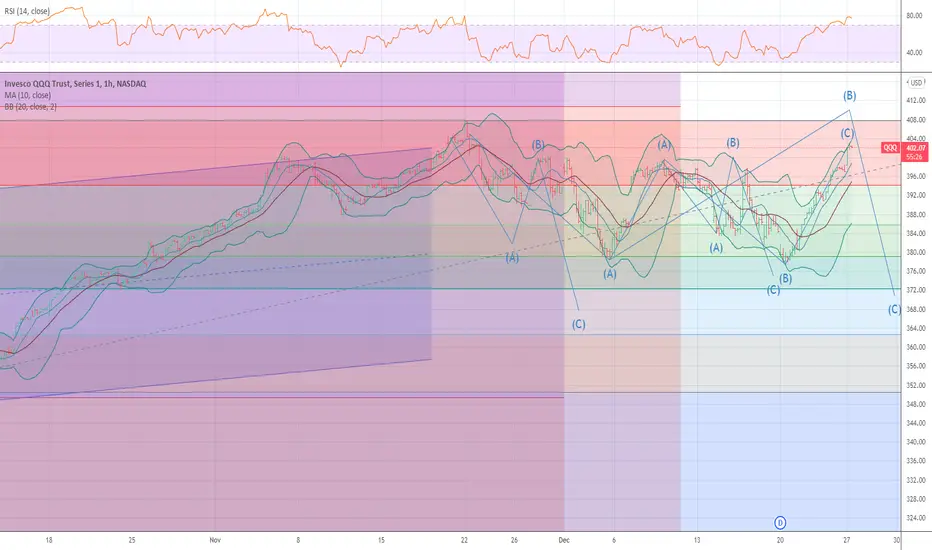
Currently we are in B wave which due to bullish sentiments in the market expanded above the start price of Wave A. Similar to NAS, I am anticipating the converging diagonals on SP as well while expecting the drop in prices by next week.

S&P Daily OutlookWe saw nice pump on Friday before market closing and an upward gap upon market open showing that the bears are getting hammered. In meantime, I would like to point out on the overall outlook on S&P according to daily time-frame. As you can see the correction shown on daily time-frame which consist of simple WXY waves are still underway. I am currently projecting the Y wave to end around 200% of W wave, in order for me to consider the possibility that the Y wave has ended already, I would need to see price action closing above 3887$ this week. Currently I am not seeing much hope for the current bullish move to continue much further.

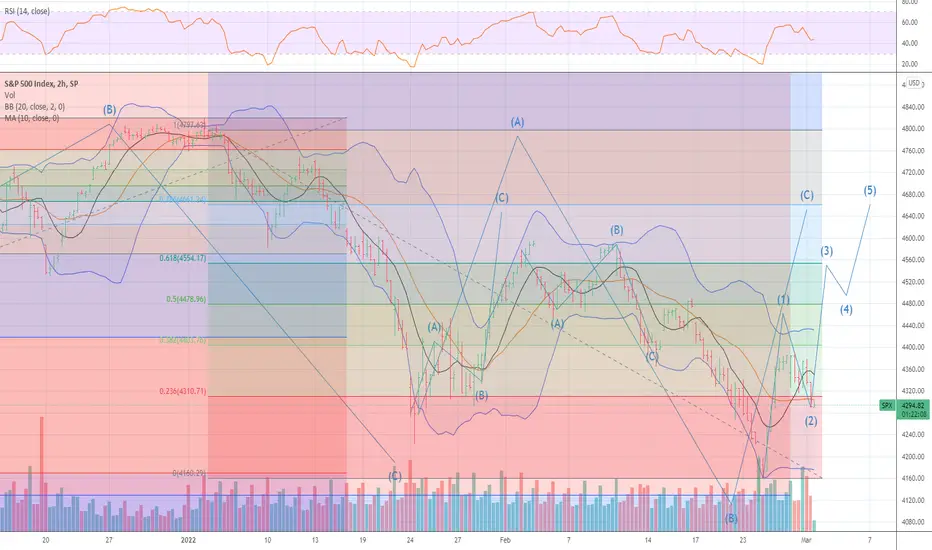
FOMO with cautionAlmost 80% of the market has turned bullish at this time. So I would like to point out a Bearish case on SP500 today. Similar to my BTC outlook, this also involves formation of Expanding Diagonal Waves.
Even though we broke upward from the trendline, this does not implies that we have invalidated the bearish PA (at-least not yet). We are currently at a critical level. In-case we fail the retest, the longs can get swept real fast.

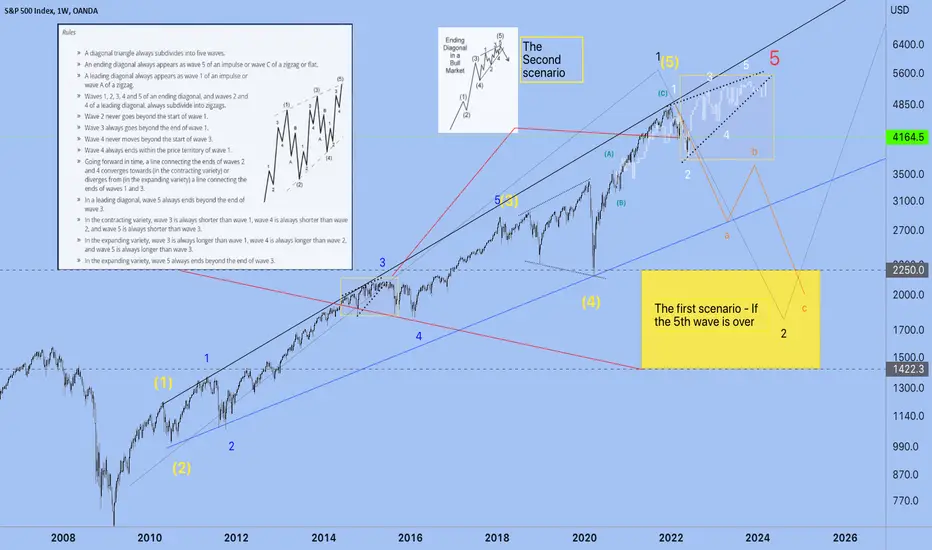
Two scenarios for the S&P500 index for 2022-2023
More theory
A diagonal triangle is always subdivided into five waves.
An ending diagonal always appears as wave 5 of an impulse or wave C of a zigzag or flat.
A leading diagonal always appears as wave 1 of an impulse or wave A of a zigzag.
Waves 1, 2, 3, 4, and 5 of an ending diagonal, and waves 2 and 4 of a leading diagonal, always subdivide into zigzags.
Wave 2 never goes beyond the start of wave 1.
Wave 3 always goes beyond the end of wave 1.
Wave 4 never moves beyond the start of wave 3.
Wave 4 always ends within the price territory of wave 1.
Going forward in time, a line connecting the ends of waves 2 and 4 converges towards (in the contracting variety) or diverges from (in the expanding variety) a line connecting the ends of waves 1 and 3.
In a leading diagonal, wave 5 always ends beyond the end of wave 3.
In the contracting variety, wave 3 is always shorter than wave 1, wave 4 is always shorter than wave 2, and wave 5 is always shorter than wave 3.
In the expanding variety, wave 3 is always longer than wave 1, wave 4 is always longer than wave 2, and wave 5 is always longer than wave 3.
In the expanding variety, wave 5 always ends beyond the end of wave 3.
Best regards EXCAVO
S&P, H4 Potential bearish momentumWith price expected to reverse off the stochastics indicator, we have a bearish bias that price will drop from our entry where the horizontal swing high resistance is to our take profit where horizontal overlap support is. Alternatively, price may head to our take profit where the 78.6% Fibonacci retracement, 127.2% Fibonacci extension and 100% Fibonacci projection is.
Please be advised that the information presented on TradingView is provided to Vantage (‘Vantage Global Limited’, ‘we’) by a third-party provider (‘Everest Fortune Group’). Please be reminded that you are solely responsible for the trading decisions on your account. There is a very high degree of risk involved in trading. Any information and/or content is intended entirely for research, educational and informational purposes only and does not constitute investment or consultation advice or investment strategy. The information is not tailored to the investment needs of any specific person and therefore does not involve a consideration of any of the investment objectives, financial situation or needs of any viewer that may receive it. Kindly also note that past performance is not a reliable indicator of future results. Actual results may differ materially from those anticipated in forward-looking or past performance statements. We assume no liability as to the accuracy or completeness of any of the information and/or content provided herein and the Company cannot be held responsible for any omission, mistake nor for any loss or damage including without limitation to any loss of profit which may arise from reliance on any information supplied by Everest Fortune Group.

TOP WAVE STRUCTURE SP 500 THE YEAR OF THE BEARThe chart posted is the best wave structure to stay with .I feel based on the fib and spirals cycle that I have been posting . and the fact we peaked into 2.618 at 4711 /4718 target that the only aly was a cluster at 4917 plus or minus 2 . . But with us breaking down in IWM and NYA . I feel that the cycles would be hard down into jan 6/20 focus date jan 10 plus or minus 1 day . and I feel that would only be WAVE A within my 4 10 and 20 year cycles which are down to oct 10 but I DID POST WE WILL HAVE A MAJOR LOW IN MAY NEAR THE 10 TH I stand by that for now . BEST OF TRADES WAVETIMER
S&P500 2008 and 2022Technically, we are repeating the same movement as in 2008. Breakout the trend line - test - and continuation of the fall.
Fundamentally - the war in the center of Europe. The potential risks of aggravation of the situation and involvement of other countries. The probable default of many countries and sanctions that hit on both sides. Rising prices for oil and gas. Many predict hunger, lack of products, and as a result - an even greater rise in food prices.
Best regards,
EXCAVO

SPX critical channelsSitting right on the parallel channel from the swing high. A break here could be very serious.
I'm sure everyone already saw this though, right?
Good luck out there!

GOLDEN RATIO TURNS PAST AND FUTURE 2022 All turns past to present and including the PANIC CYCLE FOCUS DATE MARCH 18/21 2020 are moving forward and all within 2 to 13 days on long term basis .I see a rally to a new high if we can hold 21 % decline within the sp 500 this rally will be a min of 14% but no more than 19.8 to 20.5 % from this low . Fractals second basis other than the Golden Ratio and SPRIALS are pointing in the same patterns It will see a very good low on oct 4-10 plus or minus 6 days at most best of trades ! WAVETIMER

Interesting position relative to 1.618 Fib ChannelsNot making a prediction here, just looking at the fib channels and the recent price action. Looks like a little retest at EOD yesterday. This morning will be telling.

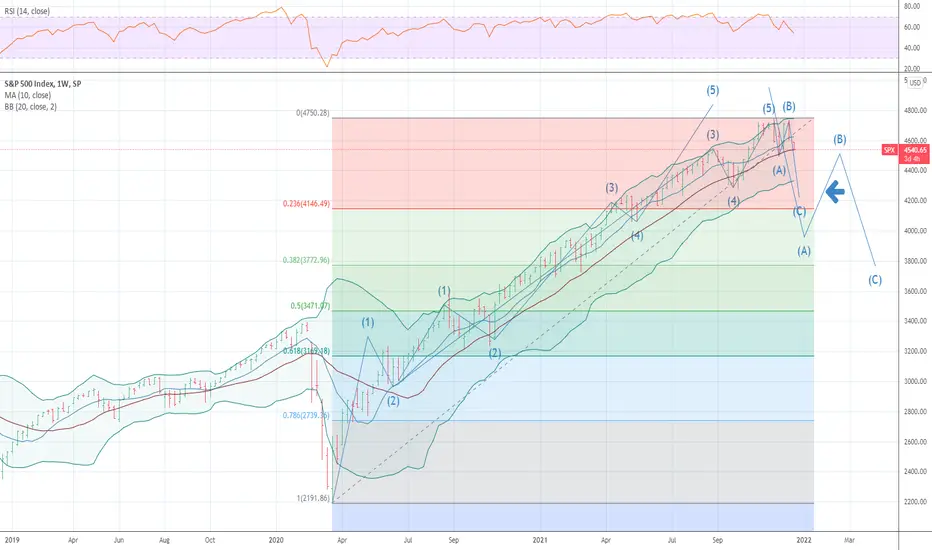
S&P Ready For A BounceGetting buy signals and very bullish momentum on every chart here. The S&P has potentially completed a zigzag starting at the highs. This zigzag does not tell us much about where price is heading but we should be up from here. It could just partial retrace and get a b-wave, or it could full retrace and make new all time highs. Either way this will probably go back to at least 4600. The max target would be this is just the bear trap before we see the "real" bubble which could take the S&P over 10000 in a few years, which fits with my ultra bullish Bitcoin thesis.
Wave-c appears to be a terminal impulse so it should be retraced in less than 50% of the time it was formed, and likely the whole zigzag will be retraced because wave-c is smaller than wave-a, meaning this is likely heading back to all time highs from here.

SP 500 BUYING NOW TO 85% NET LONG ADDING AT 4298 We should be ending a wave C down now for an abc down I will move to a 90 % by adding a 5% on stop at4399
DAX THREE PEAKS N DOOMED HOUSE PT 21We JUST ENDED PT 20 We now see a rather strong up leg to peak in pt 21 near or just above the old high . Use this to sell long term holds into Oct 4 2022 is 6/7spirals and it is also 5 to 6 long term cycles low due oct 2022

ES - Daily / Structure Termination Points to Decline AheadThe ES remains constructive within the current Daily Indications, for now.
Subject to change as this Week will shape the beginning of IT 3/5 Lower.
Will it occur on a break of the Count or is there a complexity to 2C yet to
reveal itself. The same can be said of 3A Lower.
Price need to provide more information and this is the trouble with reversals
@ Price - the Ranges are simply extremely large - an error in Judgement can
be costly in the extreme.
_________________________________________________________________
Instability has been our Thesis since the November Highs for NQ, the ES took
its time grinding out the Follow-On Highs.
Since the ES made its ATHs and completed its own unique Distribution pattern
the process of tight correlation began with IT 1A Downtrend. It has stuck with
us ever since and has only been slightly divergent Intra-Day for mere moments.
In reaching its .618 for 2C the NQ failed to exceed it .500 by more than a handful
of Points. The Leader, leads and the ES has dragged the NQ around by its nose during
RTH - Globex has been the NQ time for sillyness.
___________________________________________________________________
I believe there are two possible outcomes this Week:
1. Given the complexity of 2C (much as 2B tossed everyone repeatedly) we can anticipate
much more of the same.
2. An ST trading Range between 4400 and 4591 will remain in trade for now with the
Full range continuing to Trade until it breaks rather violently.
____________________________________________________________________
Patience, an abundance is required early this week.

sp500 is in way to 5000 so looking for buy in deep above green arrow dont fear pick buy and hold 10 day to new high
we predict bul market in 2022 too so 90% looking for buy in deep then hold it to new high
if pinbar low break , next buylimit place is EMA200 daily (all sl under low or support)
if you have sell , 100% put sl on day high
if you have buy, dont fear ,main trend on daily chart is +++ ,just put hedge sellstop in pinbar low
good luck

ALT SP 500 WAVE STRUCTURE IS STILL VALID So I posted this about aweek ago and should be one of the two top bullish patterns I will know within 10 td

I NOW HAVE A PROJECT IN THE SP 500 4408/4384 The min downside target is 4400 area plus or minus 20 If we break 4380 I will be able to project a new target . But the last time we had a signal like this in the a/d line 11.8 % drop over 2 weeks and 20.2% over 7 weeks and 38% over 5.6 weeks

WAVE B TOP ?? ALT WAVE 1 UP OF 5 Based on a PCT wave a and C up are equal in the sp 4772 in the sp 500 And in QQQ at 403 area I do not feel the long side is valid Based on the charts of VT WORLD INDEX and IWM I will not be short as started . As the bullish alt also can be counted as a double ZIG ZAG down and the nysi reached near the target of a move 950 to 1100 . I will post ASAP if I SEE the best count .BEST OF TRADES . WAVETIMER
EUR/JPY | Bearish H&S | Structural Continuation- Bearish Bias |The EUR/JPY's recent rally appears to be coming to an end, with a wedge on the 4-hour chart beginning to give way to the downside. Wedge patterns that rise during a downturn indicate that investors are losing confidence and serve as corrective patterns. In order to position their stop sufficiently above the previous week's high of 13056, shorts should aim for the most recent swing-low of 12859 and the 200-day moving average, which is confluent at 12862. With a current price of a little more than 130.00, this could result in a significantly skewed risk/reward ratio for the investor in question. At support, traders may wish to take profits, or at the very least partial profits, and employ the trailing stop method if momentum appears to be pushing the market towards a new swing-low beneath support.
