$SPX breakdown on hourly more pain to follow Downside 4200 PT possible for bears if stays below 4500 level.
Sp500idea

SPX Zig Zag ABC for Cycle Wave 4Hi everyone, SPX is currently playing Impulse Intermediate wave 5 of a Main A Wave. Most probable targets for this Wave 5 are 4212 and 3976. Because last Wave 2 (in blue) was very strong, im expected at least a troncated wave 5 at 4212. 4358 (100% of fobonnacci) is the 1st possible Wave 5 target but i would be very surprised if the market makers are not bringing the market down to 4212 because a double bottom would provide us a better bounce back for the next B wave and can at the same time create a bullish divergence on lower timeframes like the 4 hours or 1 day chart. We should not forget that the last january 04rt SPX began a Cycle wave 4 retracement. Here are the most probable targets for this full Cycle Wave 4 Retracement :
0.24% = 3878.24
0.30% = 3643.26
0.382% = 3322.12
0.50% = 2860
0.618% = Golden fib at 2398
We must keep in mind Cycle Wave 2 of SPX was pretty strong in March 200, which make this Cycle Wave 4 more chance to be light. Usually most probable target for a W4 is in between 0.3% and 0.5%. With inflation currently slowly stablizing a little , 3643.26 or even 3878.24 are on the table and pretty realistic.
For now im projecting the next B Wave in between 4443.89 and 4729.88.

S&P500: “Excellent…”“Excellent…”, we mutter slowly, steepling our fingertips while watching S&P500 move. In an exemplary manner, the index has finalized wave in turquoise in our turquoise target zone and is now in the middle of the countermovement we predicted. However, other than Mr. Burns from “The Simpsons”, whose trademark expression we borrow here, our next plan for the index is not evil. After it has completed the current countermovement with wave in turquoise within the lower turquoise strip between 4463 and 4426 points, we expect S&P500 to rise until the upper edge of the green zone between 4599 and 4675 points or even higher until the upper turquoise strip between 4683 and 4710 points above to finish wave in turquoise as well as wave 3 in green.
Still, there is a 30% chance that S&P500 does not abide by our primary plan and makes a detour below 4230 points instead. In that case, the index should fall into the magenta zone between 4126 and 4035 points before rising up again. If it manages to get back above 4230 points, a long-term rise is imminent.

SP500- New ATH soon?Last week, SP500 found strong support in 4500 zone and reversed strongly and with a big impulse.
Now the index is in a small correction of this first impulse up and we can have a new leg up pretty soon.
4630-4650 zone is support at this moment and dips around here should be bought.
A drop under 4600 would negate this scenario and would put SP500 in no men's land

SP500 found strong supportWhat has started like a healthy and meaningful correction, has proven to be an anemic not even 10% drop for SP500.
The index found strong support at this moment in 4300 zone and as long as this area is intact we can see it challenge the all-time high in the next trading sessions.
I will look to buy dips in search of a good R:R for my trade

SP500 forecasting, 1W, review 09.29.2021. Bull market is over.Bull market is over. End of X-wave pattern. This pattern begin very violent downside action, which could push the S&P down 35-40%.
Stock market conditions will be extremely treacherous for the next period - please be careful.

SP500 Monthly Chart ShortHi All
SP500 is super high at the moment, since 2021 started we didn't see some big down move since the FED is pump support.
All my tools show me that this month need to end a Red Monthly candle or at least be the last small blue, I add this trade since it's a safe one that can hold a sneak attack if come, you can split your positions to short every 16 points of an up move (X9 pending orders) and take profit when falling 64 points, close only 70% and let the 30% run to take profit 1+2.
Or keep it simple and just do like the photo show.
Trade small size so you don't risk too much, this is my idea anyway.


Big move incoming in the coming weeksThe S&P 500 Vanguard Euronext is about to make a big move in the coming weeks. Target 62.4 euro (bottom of the wedge) in the bearish scenario and 68.5 euro in the bullish scenario.

SP500 Lifetime OpportunityHi there,
SP500 at the moment is a clear buy with target above 4000
If we pay attention to the DXY chart, we are starting a uptrend but still on sideways moment, which SP500 due to many retails shorting it, has been making new highs every week, as long as dollar is weak it will keep doing it, but dollar is soon ending this sideways market to start an uptrend.
SP500 then will top at that moment
If we look at the elliot wave theory, we are in the final phase, Blow off, close to a top to begin then a new trend.
This is a long term view, if your looking to sell it, sell only at the mentioned wave 5, near it.
Good luck

SPX's P/E Probability game Average crash 42 % Median crash 37 %All Major crashes since 1902:
-------------------------------------------------------------------------------------
Year % Crash P/E@ Beg. P/E@ End Days lasted
2020 35 % 26 19 28
2007 57% 21 120 490
2000 50% 27 29!!! 763
1987 36% 21 13.7 28
1980 28% 9 9 609
1973 49% 18 7 609
1968 37% 18 13 483
1961 29% 22 16 147
1937 57% 16 8 1855
1929 84% 18 9 973
1916 37% 7 !!! 14! 1708
1909 28% 13.65 14.54 1764
1906 37% 13 9 637
1902 29 14 11 364
--------------------------------------------------------------------------------
Extra Info:
All reading Above 21 P/E
-------------------------------------------
April, 19 - Presents
March, 15 - October, 18 crash
November, 07 November , 09 crash
June , 97 January , 04 bull
August, 91 November, 93 bull
July 87 July 87 crash
March, 61 November 61 crash
April 46 July 46 crash
May 33 March 34 correction
October 21 December 21 bull
--------------------------------------
statistic wise, 66.33 we will crash/correct
33.33 bull market (Excluding present time)
----------------------------------------------------------------------------------------
Tips:
***Only 2 times in history we got reading
as high as now.
1/ Current reading is 37 P/E
2/ similar reading
A. October , 2008- December 2009 End of a crash
B. October 2001 - May 2002 last 1/3 of a crash
-----------------------------------------------------------------------------------------
summary:
Probability game is :
Average crash 42 %
Median crash 37 %

S&P500 - The "Mayan Calendar" Chart Fearing an upcoming crash / correction I've been looking at all the key indexes etc, and this was one of my earlier explorations using Fibonacci.
I look at this chart with a large pinch of salt, more a fascinating oddity than something scientific (maybe!), but I do find all the correlations very interesting.
Ultimately this connects well with my Vix & Gold charts in regards to overall cycles so I do pay attention to this and it's progression.
Time will tell! Enjoy this "Mayan Calendar" chart as it was jestingly called on Twitter ;)

SP500 could correct to 3500, I'm waiting for confirmationSince the "election all-time high" just under 3700, SP500 continued its rise, but this is anemic to say the least with the index gaining around 3% in the past 2 months.
The rise is in a tight channel which for me is an indication of an imminent reversal.
A break under this channel's support can be the signal for sellers and 3500 is a very modest target for this trade(I believe it will drop harder)

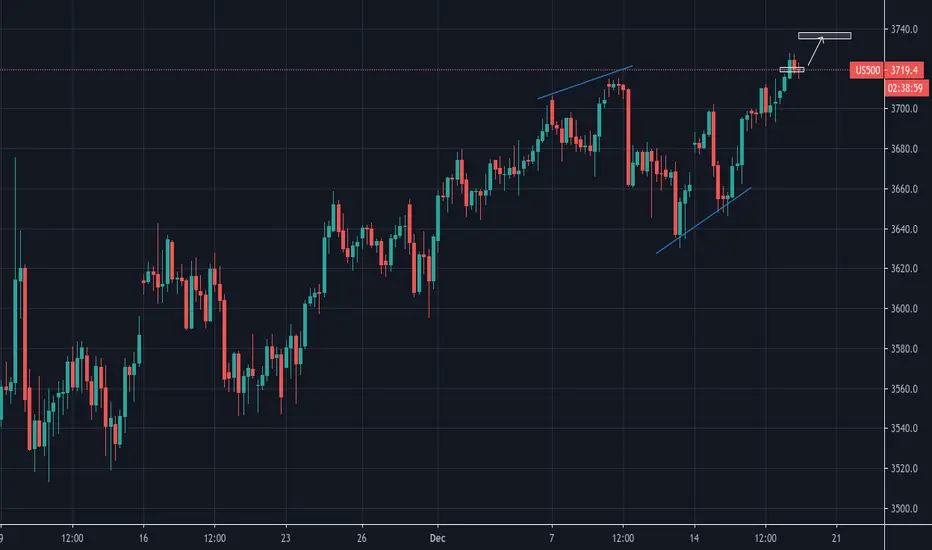

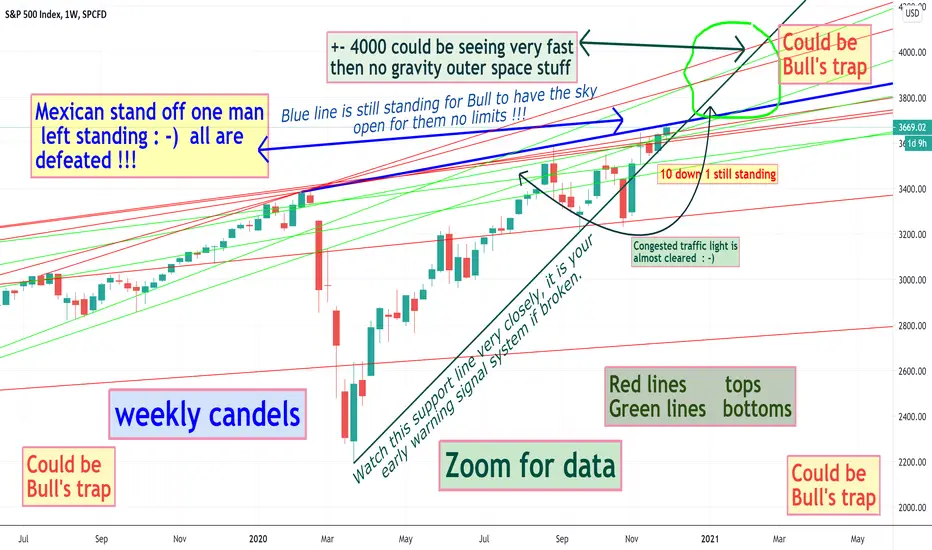
SPX Mexican stand off one man still standing for bull to have the sky limit for them. Or may night and it turns to be a bulls trap !!! time will tell
wish you all the best.
S&P 500-Ending Diagonal patternIn some cases we can't offer long-term analysis,we have to take short term targets in to our consideration.In presented chart everything is clear , according to the Diagonal pattern the probability of down trend formation up to the determined line is existing

SP500- Hanging man in resistance, a warning for bullsAfter a nice Pin Bar in support followed by a 4 days uprun is time for the "hanging man" to give us a warning...
Friday's session was dominated by NFP's volatility and I wouldn't have paid much attention to this candle if it hadn't been in resistance.
I expect 3500 zone to be a hard zone to pass by bulls and the index could fall to at least 3200 in the next 2-3 weeks.
I'm looking for selling opportunities.

SP500- I maintain my target of 3kAs I said in my previous SP500 analysis, 3500 should be a great sell zone for bears.
The index reached that zone, has reversed and now is trading just above 3250 support zone.
A small rally should be expected now and bears have a new opportunity for opening trades around 3400
I maintain my target of 3k for this index and only a new all-time high would change my perspective

SP500 Well... We have news today that Trump is positive.
He is always positive, so now he have a time to trade, so...
My fundamental opinion is that he and his comrades will pump the market near resistence area.
Also it depends on DXY value, but with all that printing... I'm not an optimist.

S&P 500 BROKE AND RETEST PLAY - UpdateSP 500
Has managed to broke the upside trendline yesterday.From 3212.00 level it has rejected twice and makes a minor double bottom pattern and bounced after the primary touch in lower trendline.And managed broke the upside barrier
we are expecting broke and Retest towards the lowerside support level comes around 3277.00 which is coordinating with trendline.From this level we can expect some buying activities and the potential target would be 3450.00 within this range 50% Fibonacci retracement level will act as testing ground for both the bull and bear
The bigger dissimilar falling wedge pattern has formed too which is a clear sign of bulls taking some rest to move further towards north..It's a September midterm correction as the end starts the Bull is awake and ready to bounce back towards 3600.00
USA Presidential election will Influence the direction of market we can expect unusual market volatility in coming days
Give a like if u love our work..

It's Monday, not doomsday! ☕
Starting the week, the S&P500 continues the primary expectation and reaches the first target area for the current decline. On Sunday, the U.S. reported 32,186 new coronavirus cases, and several European countries have also seen a steady increase in COVID 19 cases over the past 24 hours spreading pessimism amongst investors. The World Health Organization predicts that daily coronavirus deaths in Europe will increase in October and November, raising concerns about a possible second lockdown in Europe. Meanwhile, several major banks have reportedly transferred large amounts of illegal funds over a period of almost two decades. HSBC, JPMorgan, Deutsche Bank, Standard Chartered, and Bank of New York Mellon are among the banks involved in the report.
The minimum target for the current decline remains within the range of 3200 points. Below 3049 points, the way is paved for significantly lower quotations in the range of 2800 points. Since we expect new all-time highs in the long term, we will use the current drop to open long positions and thus position ourselves for the next rally.
In conclusion, we expect the current drop to reach the area of 3200 points before a bounce can be expected. We give the alternative scenario a 38% probability. The primary expectation remains that the index will reach a lower level of 2800 points, which is confirmed below 3049 points. However, in both scenarios, we expect at least a corrective bounce from the yellow target box, which will push the market back up towards 3440 points.
Grab some coffee, be awesome, and enjoy your trading day!

SP500 get ready for Deflation Strong dollar is comming off and Big Bubble at the markets at the moment getting ready for a recession, february wasnt the true recession as many think we still need another deflation move before inflation truly begins, market is not healthy when its moving up without any wave down or pullback
Watch price action on lower timeframes to short it after a retest~
Good luck
