S&P500 push to another ATH?Momentum & Leadership:
The index hit another record high yesterday (+0.44%), with strength again concentrated in tech and the Magnificent 7. Nvidia’s AI-driven deal with OpenAI (+3.93%) fuelled risk appetite and extended the rally. YTD gains show a narrow breadth: S&P 500 +13.8% vs equal-weighted S&P +7.7%.
Macro Data Today:
PMIs (US, UK, Eurozone, Germany, France): Watch for signs of resilience in services vs persistent weakness in manufacturing. A softening read could weigh on cyclicals but leave tech defensives relatively insulated.
US regional activity (Philly Fed services, Richmond Fed manufacturing, business conditions): Key for growth sentiment after mixed signals in recent weeks.
Q2 current account balance: Low market impact.
Central Banks:
Fed Chair Powell, Bowman, Bostic: Powell’s remarks could influence rate cut expectations post-FOMC. A cautious tone might temper equity momentum, while dovish signals could extend the rally.
Trading Implications:
The S&P’s rally remains narrowly led by tech/AI, leaving breadth weak.
Today’s PMI prints and Powell’s speech are the main potential volatility drivers – stronger growth data may challenge Fed easing expectations (pressuring valuations), while softer data could reinforce rate-cut hopes and keep the rally alive.
Watch semiconductors and Mag-7 for leadership; broader market participation is still lagging.
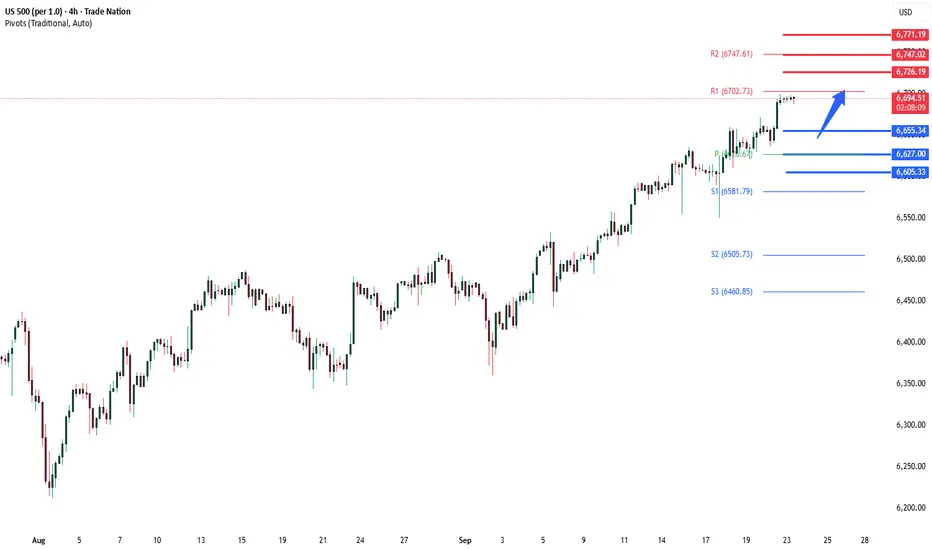
Key Support and Resistance Levels
Resistance Level 1: 6726
Resistance Level 2: 6747
Resistance Level 3: 6770
Support Level 1: 6655
Support Level 2: 6627
Support Level 3: 6605
This communication is for informational purposes only and should not be viewed as any form of recommendation as to a particular course of action or as investment advice. It is not intended as an offer or solicitation for the purchase or sale of any financial instrument or as an official confirmation of any transaction. Opinions, estimates and assumptions expressed herein are made as of the date of this communication and are subject to change without notice. This communication has been prepared based upon information, including market prices, data and other information, believed to be reliable; however, Trade Nation does not warrant its completeness or accuracy. All market prices and market data contained in or attached to this communication are indicative and subject to change without notice.
S&P 500 (SPX500)
Weekly Analysis of the S&P 500 (ES) - Sep 22 - 26 - Fundamental Bias
So, here's the deal: we're still on an upward trend, but price is pushing against a "ceiling cluster" just above us. Expect a slow climb for now until something changes.
As long as we stay above 6,700–6,705, dip buyers will probably step in and try to push things back up to the 6,73x/6,75x range.
When we hit 6,745–6,760, we might see some stalls or rejections because there’s not much support there. If we can get above 6,760 and hold it for 15 minutes, we could squeeze up to around 6,798.
On the flip side, if we drop below 6,700–6,705 and stay there for 15 minutes, the vibe could switch to a downward trend, with potential targets around 6,693 and then about 6,660.
In short: I'm feeling slightly bullish as long as we’re above 6,700. Watch for some action around 6,745–6,760, and consider going long only if we cleanly break above 6,760.
Quick game plan for tomorrow (NY kill-zones 9:30–11:00 & 13:30–16:00 ET)
Open > 6,710 and < 6,731: Buy dips into 6,720/6,710 aiming back to 6,731 → 6,745.
Gap/push into 6,745–6,760 early: Look for a 15m rejection to fade back toward 6,731/6,720. Accept > 6,760? Switch long and target 6,798.
Break and hold < 6,700–6,705: Stand down on longs; hunt bounces to sell toward 6,693 → 6,660.
Use Key Levels as a map.
Week-ahead fundamentals (ET) — what can move ES
Mon 9/22 — CFNAI (Chicago Fed) 8:30a. Tracks broad U.S. activity; August print due.
Tue 9/23 — S&P Global “flash” PMIs (Mfg/Services) 9:45a indicative timing; S&P’s week-ahead notes flash PMI on the 23rd.
Wed 9/24 — New Home Sales (Aug) 10:00a. Census’ July release notes the Aug report is scheduled Sep 24.
Thu 9/25 — Q2 GDP (third) 8:30a (BEA), Durable Goods (Aug) 8:30a (Census), Weekly Jobless Claims 8:30a (DOL).
Fri 9/26 — PCE & Core PCE (Aug) 8:30a (BEA) and U. Michigan sentiment (final Sep) 10:00a.
Fed speakers (mid-day risk): Mon 12:00p Gov. Miran; Tue 12:35p Powell; Thu 9:00a/1:00p Bowman/Barr; Fri 10:00a Bowman.
Treasury supply: 13- & 26-wk bill auctions Mon 9/22; 6-wk bill Tue 9/23; 2-yr FRN reopen Wed 9/24 (tentative schedule).
Earnings to note (Thu): Costco Q4 FY25 call Thu 9/25 2:00 pm PT; broader week list light otherwise.

Weekly Analysis of the S&P 500 (ES) - Sep 22 - 26 - UpdatedThe analysis for the upcoming week contained an error in the drawing. I have updated it, so this version is correct.
Bias
So, here's the deal: we're still on an upward trend, but price is pushing against a "ceiling cluster" just above us. Expect a slow climb for now until something changes.
As long as we stay above 6,700–6,705, dip buyers will probably step in and try to push things back up to the 6,73x/6,75x range.
When we hit 6,745–6,760, we might see some stalls or rejections because there’s not much support there. If we can get above 6,760 and hold it for 15 minutes, we could squeeze up to around 6,798.
On the flip side, if we drop below 6,700–6,705 and stay there for 15 minutes, the vibe could switch to a downward trend, with potential targets around 6,693 and then about 6,660.
In short: I'm feeling slightly bullish as long as we’re above 6,700. Watch for some action around 6,745–6,760, and consider going long only if we cleanly break above 6,760.
Quick game plan for tomorrow (NY kill-zones 9:30–11:00 & 13:30–16:00 ET)
Open > 6,710 and < 6,731: Buy dips into 6,720/6,710 aiming back to 6,731 → 6,745.
Gap/push into 6,745–6,760 early: Look for a 15m rejection to fade back toward 6,731/6,720. Accept > 6,760? Switch long and target 6,798.
Break and hold < 6,700–6,705: Stand down on longs; hunt bounces to sell toward 6,693 → 6,660.
Use Key Levels as a map.
Week-ahead fundamentals (ET) — what can move ES
Mon 9/22 — CFNAI (Chicago Fed) 8:30a. Tracks broad U.S. activity; August print due.
Tue 9/23 — S&P Global “flash” PMIs (Mfg/Services) 9:45a indicative timing; S&P’s week-ahead notes flash PMI on the 23rd.
Wed 9/24 — New Home Sales (Aug) 10:00a. Census’ July release notes the Aug report is scheduled Sep 24.
Thu 9/25 — Q2 GDP (third) 8:30a (BEA), Durable Goods (Aug) 8:30a (Census), Weekly Jobless Claims 8:30a (DOL).
Fri 9/26 — PCE & Core PCE (Aug) 8:30a (BEA) and U. Michigan sentiment (final Sep) 10:00a.
Fed speakers (mid-day risk): Mon 12:00p Gov. Miran; Tue 12:35p Powell; Thu 9:00a/1:00p Bowman/Barr; Fri 10:00a Bowman.
Treasury supply: 13- & 26-wk bill auctions Mon 9/22; 6-wk bill Tue 9/23; 2-yr FRN reopen Wed 9/24 (tentative schedule).
Earnings to note (Thu): Costco Q4 FY25 call Thu 9/25 2:00 pm PT; broader week list light otherwise.

UPDATE: US500 has rallied to its near short term target at 6,747Cup and Handle formed on US 500 since we sent the last analysis.
And now it's that time of month where we need to send the update and where we can see the market moving next.
They are expecting more rate cuts to come in the year and with the last 25 BPS cut, means people will have more disposable money to take out of the bank and into stocks.
So this is probably one of the main reasons for the upside to come.
The target is on par to 6,747
Price>20 and 200MA
Target 6,747
Disclosure: I am part of Trade Nation's Influencer program and receive a monthly fee for using their TradingView charts in my analysis.

SPX500 – Fed Speeches to Drive Next BreakoutSPX500 – Technical Outlook
Markets remain focused on Fed policy signals after last week’s rate cut and a wave of upcoming Fedspeak, while shrugging off the Trump administration’s H-1B visa crackdown. With traders pricing in further easing by year-end, comments from Fed officials will drive sentiment and could trigger sharp moves in U.S. indices.
Price Action
SPX500 is currently showing bearish momentum while trading below the pivot zone, reflecting investor caution ahead of key Fed speeches.
Bearish Path:
As long as price remains below the 6,663 pivot, downside pressure persists toward 6,634.
A confirmed 1H close below 6,634 would open the way for deeper losses toward 6,590.
Bullish Path:
A confirmed 1H candle above 6,684 would invalidate the bearish bias and signal fresh bullish momentum, targeting 6,700 → 6,742.
Key Levels
Pivot: 6,663
Resistance: 6,684 – 6,700 – 6,742
Support: 6,634 – 6,619 – 6,590

DXY 4H Outlook – Key Levels & Potential Scenarios💡 DXY 4H Outlook – Key Levels & Potential Scenarios
Price is currently testing an important supply zone (97.7 – 98.0) after showing a strong recovery. From here, I’m watching two possible outcomes:
🔼 Bullish Scenario
If buyers manage to hold above the 97.7 – 98.0 supply zone, we could see continuation toward the next major resistance between 98.2 – 98.6.
Break & retest of 98.0 would be a strong confirmation for buyers.
🔽 Bearish Scenario
If the 97.7 – 98.0 area rejects strongly, price could reverse back down toward the demand zone (96.4 – 96.6) for liquidity grab.
This zone has previously acted as a strong reaction point.
⚔️ Key Levels to Watch
Resistance: 98.0 | 98.2 | 98.6
Support: 97.4 | 96.6
📊 This setup gives both bulls and bears opportunities depending on how price reacts at these zones.
✅ If you enjoy this type of analysis, make sure to follow me so you don’t miss the next updates.
💼 For those who want account management services (personal or funded accounts), feel free to reach out – I can help you grow consistently with risk management and proven strategies.
Hellena | SPX500 (4H): LONG to resistance area of 6700.Colleagues, I think we should expect the upward movement to continue. The upward impulse is not over yet, but I think we may see a correction to the 6500 area, then I expect the upward movement to continue to the 6700 area, which is a pretty strong psychological level and is the area of 50% levels of Fibonacci extension.
Manage your capital correctly and competently! Only enter trades based on reliable patterns!

S&P 500 (ES1!): Bullish! Buy The Dip! Keep It Simple!Welcome back to the Weekly Forex Forecast for the week of Sept 22 - 26th.
In this video, we will analyze the following FX market: S&P 500 (ES1!)
The S&P500 is still bullish, and there is no reason to short it.
Wait for price to pullback to a +FVG, and then look for valid buy setups on your entry TFs.
Don't jump into sells! They are against the trend and lower probability!
Enjoy!
May profits be upon you.
Leave any questions or comments in the comment section.
I appreciate any feedback from my viewers!
Like and/or subscribe if you want more accurate analysis.
Thank you so much!
Disclaimer:
I do not provide personal investment advice and I am not a qualified licensed investment advisor.
All information found here, including any ideas, opinions, views, predictions, forecasts, commentaries, suggestions, expressed or implied herein, are for informational, entertainment or educational purposes only and should not be construed as personal investment advice. While the information provided is believed to be accurate, it may include errors or inaccuracies.
I will not and cannot be held liable for any actions you take as a result of anything you read here.
Conduct your own due diligence, or consult a licensed financial advisor or broker before making any and all investment decisions. Any investments, trades, speculations, or decisions made on the basis of any information found on this channel, expressed or implied herein, are committed at your own risk, financial or otherwise.

Stock market pullback aheadIt’s an incredible time for retail investors: the market is pumping non-stop, and it seems like it could continue indefinitely.
However, the charts are signaling a different scenario as we approach October.
MACD is at the top of its range
RSI is at the top of its range
Stochastic is at the top of its range
While liquidity remains high and rate cuts appear increasingly likely, history shows that when these indicators reach such extremes on the 1-week timeframe, a market correction often occurs. This reset can pave the way for further growth.
In short, we may see a correction, sideways movement, or a pause, most likely starting in October.
Anything is possible, but the charts don’t lie—even if sentiment can be misleading.
Monitor the situation closely: a market correction can also be a great opportunity to buy at lower prices.
DYOR.

SPX: rate cut fuels market rallyThe Fed finally made a long awaited move and cut interest rates by 25 basis points, for the first time during this year. Additional cuts are possible during the Q4, however, they will depend on the economic data, not on expectations from markets. Fed Chair Powell stressed that risks are now switched to the jobs market from the inflation, which moved relatively stable during the past period, although still modestly above the Fed's target of 2%.
The US equity markets continue to react positively to new macro developments, with S&P500 reaching another new all time highest level as of the end of the week at 6.665. The market also continues to move within a highly overbought range. Some analysts are beginning to stress that current S&P 500 levels are trading at 22 times forward earnings, noting that a period of consolidation would be a healthy period.
The rise in the S&P500 was helped by a sharp jump in Intel shares, which surged nearly 23% following Nvidia’s $5 billion investment and their plan to collaborate on AI-chips. Other top contributors included Nvidia, which recovered earlier losses despite concerns over Chinese tech regulations. Meanwhile, some S&P 500 stocks lagged: Darden Restaurants fell after disappointing earnings, and CrowdStrike saw gains after broker upgrades.

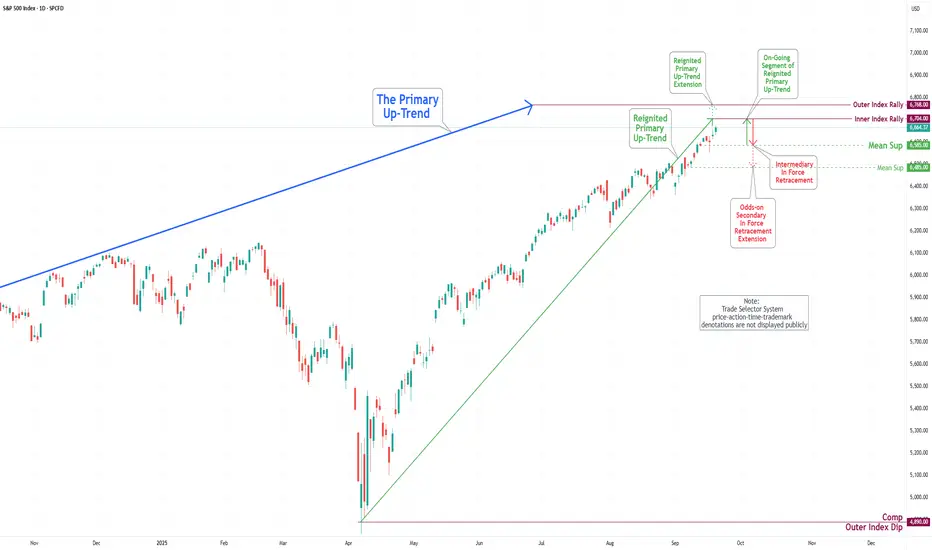
S&P 500 Daily Chart Analysis For Week of Sep 19, 2025Technical Analysis and Outlook:
In the trading session of the previous week, the S&P 500 Index demonstrated a significant upward price movement following a severe drawdown on Tuesday. The index successfully reached the Outer Index Rally level of 6620 and is currently progressing towards the established target of the Inner Index Rally at 6704, with the potential for further upward momentum to extend to the Outer Index Rally level of 6768.
It is essential to acknowledge that upon achieving the target of the Inner Index Rally at 6704, the expected price action is likely to initiate a substantial pullback, which is projected to aim for the target Mean Support level of 6585 and may extend to the Mean Support at 6485. Nonetheless, this primary segment of intermediary In Force Retracement pullback is likely to facilitate a considerable rebound, allowing for a subsequent retest of the Outer Index Rally level of 6704.
S&P 500 (ES1!): Wait For Longs! Buy The Dip!Welcome back to the Weekly Forex Forecast for the week of Sept 15 - 19h.
In this video, we will analyze the following FX market: S&P 500 (ES1!)
The S&P500 is still bullish, and there is no reason to short it. The Bulls are clearly in control.
As price moves from ERL to IRL, the untouched +FVG below is a great place to look for a high probability long setup.
Enjoy!
May profits be upon you.
Leave any questions or comments in the comment section.
I appreciate any feedback from my viewers!
Like and/or subscribe if you want more accurate analysis.
Thank you so much!
Disclaimer:
I do not provide personal investment advice and I am not a qualified licensed investment advisor.
All information found here, including any ideas, opinions, views, predictions, forecasts, commentaries, suggestions, expressed or implied herein, are for informational, entertainment or educational purposes only and should not be construed as personal investment advice. While the information provided is believed to be accurate, it may include errors or inaccuracies.
I will not and cannot be held liable for any actions you take as a result of anything you read here.
Conduct your own due diligence, or consult a licensed financial advisor or broker before making any and all investment decisions. Any investments, trades, speculations, or decisions made on the basis of any information found on this channel, expressed or implied herein, are committed at your own risk, financial or otherwise.

S&P reaching 6666...what could ever go wrong?There's a healthy does of bullishness as tech companies buy from their neighbors with CAPEX (100% depreciation) and short term rate cuts. The stock market is at the most expensive level, ever, blowing out PE and CAPE ratios. While I hope the economy does better, a pull back is healthy. Many of the leading indicators show bright red, and some are choosing to ignore. I guess time will tell! Best of luck and keep an eye on VIX (UVIX). There's a Volmageddon 2.0 in the making.....

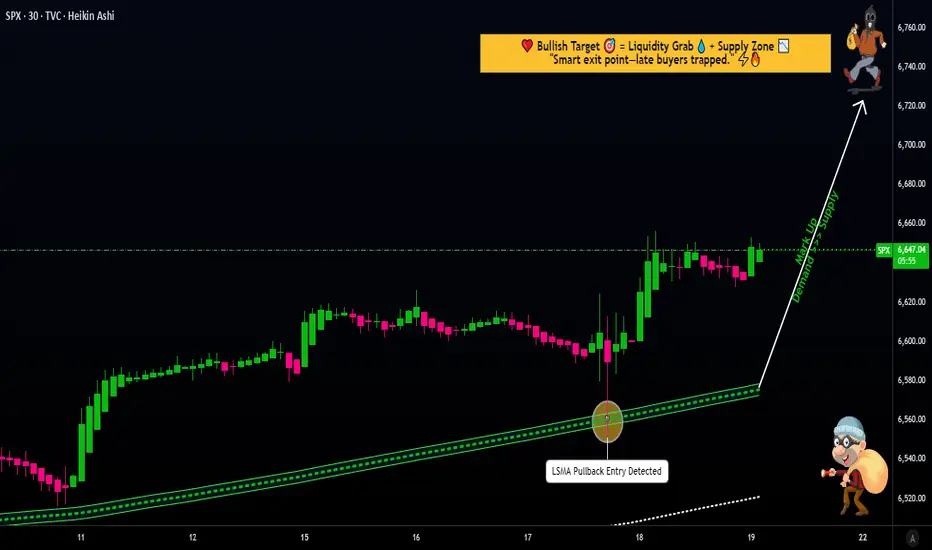
SPX500 Trading Strategy Explained: From Entry to Exit⚡ SPX500 “STANDARD & POOR” Indices Market Wealth Strategy Map ⚡
(Swing / Day Trade Plan – Thief OG Style)
🧭 Plan
📈 Bias: Bullish confirmed with 30m LSMA pullback + 0.786 Fibonacci-based MA confluence.
💡 Entry Approach (Thief Layering Strategy™):
Instead of one-shot entry, I place multiple buy-limit layers to average into strength. Example setup:
Buy limit: 6600
Buy limit: 6620
Buy limit: 6640
👉 You can extend or adjust the layering based on your own strategy.
🎯 Stop Loss (SL)
This is my Thief SL @6560.
⚠️ Note to Ladies & Gentlemen (Thief OG’s): This SL is not a recommendation. Use your own judgment — protect your loot at your own risk.
💰 Target (TP)
📌 6750 — sitting at strong resistance + overbought zone + possible bull-trap.
⚠️ Again, OG’s — this is not financial advice. Take profit when it fits your plan. Secure the bag, then enjoy the loot!
🔍 Related Pairs to Watch
Keep an eye on these correlated assets to confirm the SPX500’s move:
NASDAQ:NDX (Nasdaq 100): Tech-heavy index with strong correlation to SPX500. If tech stocks are pumping, it’s a bullish signal for our trade. 📊
TVC:DXY (US Dollar Index): A weaker dollar often boosts equities. Watch for inverse correlation—DXY dropping could mean SPX500 is ready to fly! 🚀
TVC:VIX (Volatility Index): Low VIX levels signal market calm, supporting our bullish setup. A spike in VIX could warn of trouble, so stay sharp! ⚡
Key Correlation Insight: SPX500 often moves in tandem with NASDAQ:NDX due to shared tech giants (think Apple, Microsoft). If NASDAQ:NDX is rallying, it’s a tailwind for our trade. Conversely, a rising TVC:DXY or TVC:VIX could signal caution.
📝 Thief Note
Dear Ladies & Gentlemen (Thief OG’s):
This map is my personal swing/day trade playbook — not a fixed recommendation. Layer entries, cut losers fast, and loot when you can. Market moves are wild; manage risk like a true OG.
✨ “If you find value in my analysis, a 👍 and 🚀 boost is much appreciated — it helps me share more setups with the community!”
⚠️ Disclaimer: This is a Thief-style trading strategy shared just for fun & educational vibes. Not financial advice. DYOR & trade responsibly.
ES (SPX) Analyses - Key Levels - Setups - Fri, Sep 19Bias:
After the recent FOMC meeting, where they cut rates by 25 basis points on September 18, the E-mini S&P 500 futures are looking a bit bullish. There’s decent support holding up, but expect some bumpy trading around those all-time highs. We might see the market bouncing between the usual value areas, with traders likely to fade the extremes unless there’s a strong breakout.
Momentum could slow down as we get close to overbought levels, which might lead to some profit-taking on any rallies. On the flip side, expect strong buying when prices dip. For now, the trading range looks to be between 6660 and 6710, with swings of about 20 to 30 points likely in quieter trading conditions.
Friday has no major U.S. data on the weekly calendar wrap; Thursday’s LEI fell −0.5% m/m in Aug (already out), so macro tape-bombs are limited.
Quadruple-witching: 09/19/2025 is the quarterly expiration (third Friday of Sep). Also note ESU25 last trade = Sep 19, even though most trading has rolled to ESZ25. Expect flowy opens/closes and possible “pin” behavior. 
Options positioning (ES):
• Report totals: 5.83M total OI; put/call = 3.51. 
• Friday weeklies: 2.676M OI; P/C = 5.09 (put-heavy into expiry). 
• Sep contract (ESU5, 2 DTE): ~1.07M total OI; P/C = 3.01; ~185k volume in the latest report. 
• Vol: 30-day ATM IV ≈ 12.33% (down slightly d/d). 
• 0DTE share in SPX options has been >60% of volume recently — expect same-day gamma flows to matter on a quad-witch Friday. 
Bottom line: This is a put-heavy, expiry-dense tape with subdued vol. Expect pinning/reversion around big strikes and flowy opens/closes rather than a trend day—unless price cleanly accepts outside the range.
Next known catalysts (not tomorrow but near-term): Flash PMIs Mon 9/22; U. Michigan final sentiment Fri 9/26.
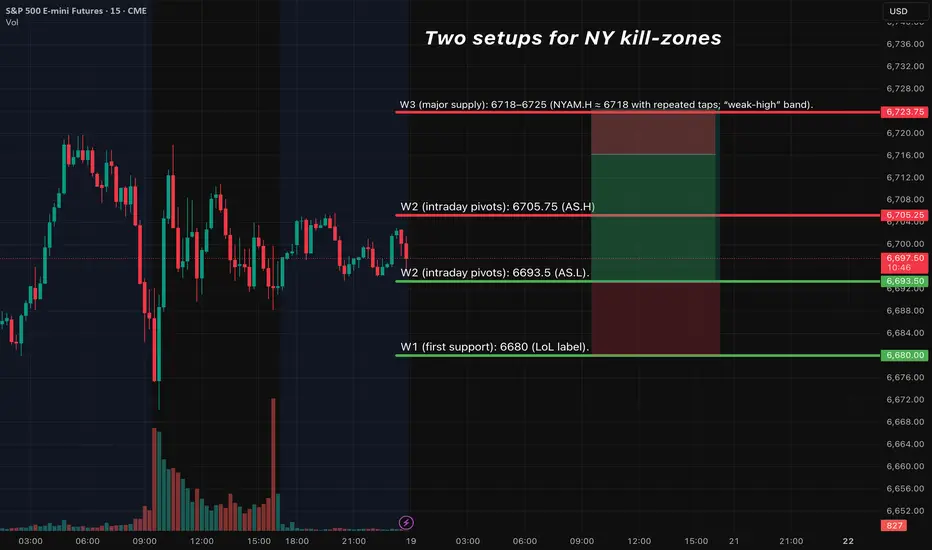
Setup 1 — Tier-2 (A+ Bounce) LONG @ 6680–6695
Trigger: sweep 6680–6690 → 15m close back above 6693.5 (AS.L) → 5m re-close + HL → 1m pullback hold.
Entry: 6694–6697.
SL: below the 15m sweep low −0.5 pt (hard).
TP1: 6705–6707 (AS.H). TP2: 6718–6725 (W3).
Management: at TP1 close 70%, move runner to BE; aim TP2; time-stop 45–60m if neither TP1/SL hits; max 2 attempts/level.
Setup 2 — Tier-1 (A++ Rejection-Fade) SHORT @ 6718–6725
Trigger: quick sweep above 6718–25 → 15m body back inside 6710 → 5m LH + re-close → 1m failure retest.
Entry: 6714–6718 on the re-close.
SL: above sweep high +0.5 pt.
TP1: 6705–6707; TP2: 6693–6695; stretch 6685–6680 only if momentum continues.
Management: same as above.
SPY options overlay (execution notes)
Given quarterly expiration and heavy 0DTE participation, prefer same-day SPY (AM window) with Δ≈0.60–0.70 on entries; consider 1-DTE for PM window to temper decay. (0DTE share data from Cboe.)
SPX to 6,860$ WITHIN the NEXT WEEK!!!We have been calling this since 5,800$.
I wish I could tell you how I do this.
I have one heck of a set up.
it should keep pumping to 6,860$ as stated!
and thereafter, I don't have to say anymore as there will be the imminent crash I've been talking about.

SPY / S&P TOO HOT....gravity is strongMore traditionalist here and following technicals (macro-level). We see insane PE / CAPE ratios, higher than dot.com, most expensive stock market ever, and weakening economy. Not being fooled by tech companies buying from each other with CAPEX (100% depreciation). Correction will happen faster than people think! It's easy to get pumped up by the narrative, but the real story is not good and media outlets like CNBC / FoxBusiness are spinning good stories that are mostly opinions with zero fundamentals or historical context. Best of luck!
Add CBOE:UVIX CBOE:MSTZ CBOE:BTCZ to your portfolio before they spike

S&P500 Key support at 6600FOMC Takeaways
Fed cut rates 25bps to 4.00–4.25%, as expected.
Powell framed it as a “risk-management cut”, tempering hopes for an aggressive easing cycle.
Dot plot now signals 75bps total cuts in 2025 (vs. 50bps before), with softer growth/labour tone.
Markets saw a whipsaw: initial rally → Treasury selloff → equities flat by close.
Market Moves
Equities: S&P 500 closed -0.10%, after falling as much as -0.84% intraday.
Sector split: IT lagged (-0.70%), but financials (+0.96%) and consumer staples (+0.90%) outperformed.
Futures (Asia session): S&P +0.49%, Nasdaq +0.73% → rebound tone.
Rates: Yields higher post-FOMC (10yr +6bps to 4.09%) but down 2–2.5bps this morning.
FX: Dollar Index +0.18% overnight, extending gains despite initial dip.
Trading Implications
Market focus: Is the economy strong enough to sustain gains with only a gradual Fed cutting path?
Bull case: Rate-sensitive domestic sectors (financials, staples, housing-related) showing resilience; futures pointing higher.
Bear case: Transports lag industrials (Dow at records, transports weaker) – a potential warning sign for breadth of the rally.
Catalyst today: FedEx earnings – a key test for global trade/transport demand and market breadth confirmation.
Key Support and Resistance Levels
Resistance Level 1: 6660
Resistance Level 2: 668
Resistance Level 3: 6700
Support Level 1: 6600
Support Level 2: 6570
Support Level 3: 6550
This communication is for informational purposes only and should not be viewed as any form of recommendation as to a particular course of action or as investment advice. It is not intended as an offer or solicitation for the purchase or sale of any financial instrument or as an official confirmation of any transaction. Opinions, estimates and assumptions expressed herein are made as of the date of this communication and are subject to change without notice. This communication has been prepared based upon information, including market prices, data and other information, believed to be reliable; however, Trade Nation does not warrant its completeness or accuracy. All market prices and market data contained in or attached to this communication are indicative and subject to change without notice.

S&P 500 Outlook: Bearish Pullback While Under 6,634SPX500 – Technical Overview
The S&P 500 recorded a new all-time high at 6,633 as markets brace for the Federal Reserve’s rate decision later this week.
Futures remain supported by expectations of a 25 bps cut, while traders await Powell’s commentary for guidance on inflation, labor-market weakness, and tariff risks.
Monday’s rally to record highs was fueled by optimism around U.S.–China trade talks, strong tech performance, and fresh gains in gold and mining stocks.
Technical Outlook
📉 Bearish correction:
While price trades below 6,634, a near-term pullback is favored.
Downside targets: 6,605 → 6,590, with deeper support at 6,571 if selling pressure accelerates.
📈 Bullish continuation:
A confirmed 1H close above 6,634 would reassert bullish momentum.
Next upside targets: 6,662 → 6,700.
📌 Market Context:
The Fed’s meeting and Powell’s tone remain the primary catalysts. A dovish message or stronger-than-expected cut could fuel a breakout above 6,634 toward new highs, while a cautious or hawkish stance may encourage a deeper correction before the next bullish leg.

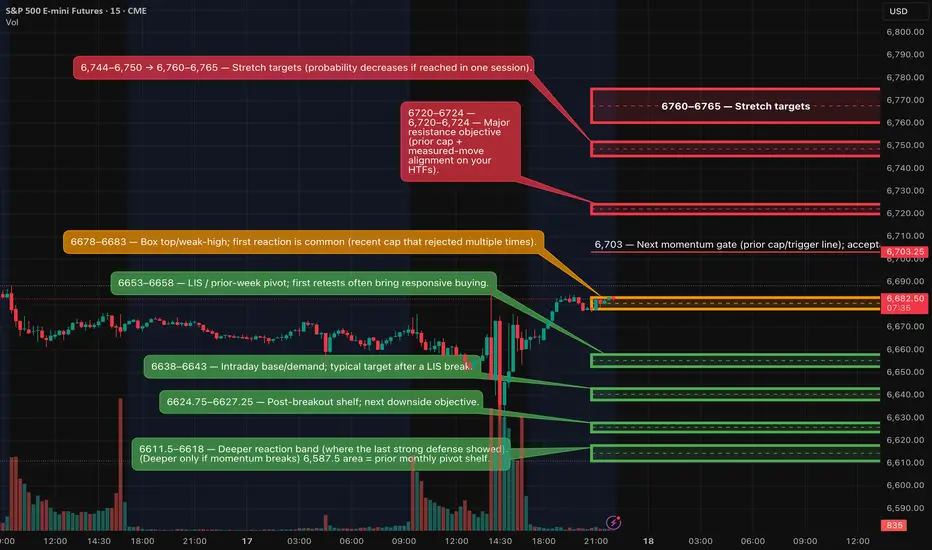
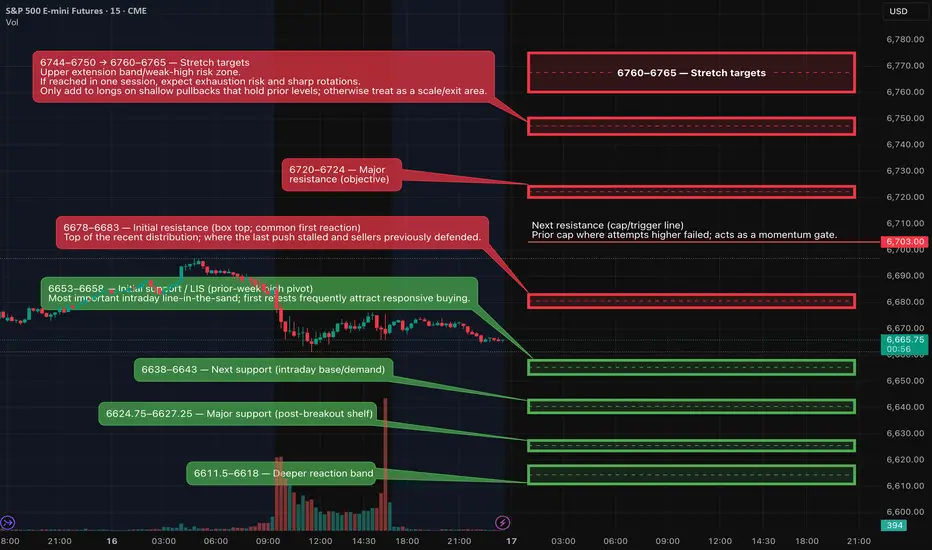
ES (SPX) Futures Analyses - Key Zones, Setups (Thur, Sep 17)Same map as last night.
Bias & structure
Price is pressing the box top 6,678–6,683 (1h AS.H 6,683.25) with a dense extension liquidity pocket above (D: 1.272 ≈ 6,763, 1.618 ≈ 6,856, 2.0 ≈ 6,959). We trade edge-only: fade a rejection at the top, or buy a sweep-and-reclaim at the control level.
Kill-zones (ET): London 02:00–05:00 (½–¾ size); NY AM 09:30–11:00; NY PM 13:30–16:00.
London (2 setups)
SHORT — Rejection Fade @ 6,678–6,683
15m tag → 15m close back ≤ 6,675 → 5m LH/re-close 6,672–6,674 → 1m LH entry 6,679–6,682.
Hard SL: above 15m rejection high +0.25–0.50.
TPs: 6,666–6,668 → 6,653–6,658 → 6,638–6,643.
Cancel if two 15m body-closes ≥ 6,685. Gate: TP1 ≥ 2.0R.
LONG — Sweep & Reclaim @ 6,653–6,658 (bias pivot)
Wick below LIS → 15m close back ≥ 6,658 → 5m re-close up 6,664–6,666 + HL → 1m HL entry 6,659–6,662.
Hard SL: below sweep low −0.25–0.50.
TPs: 6,678–6,683 → 6,703 → 6,720–6,724 (runner eyes 6,744–6,750).
U.S. (NY) (2 setups)
LONG — Acceptance Continuation > 6,683
Two 5m closes ≥ 6,685 (or one decisive 15m) → PB hold 6,679–6,683 flips to support → enter on 1m HL.
SL: under acceptance pivot −0.50–1.00.
TPs: 6,703 → 6,720–6,724 → 6,744–6,750 (→ 6,760–6,765).
Fail back below 6,679 on 5m = stand down.
SHORT — Breakdown & Failed Reclaim < 6,653
15m body close < 6,653 → retest fails (6,653–6,658 caps) → sell 6,651–6,654 on the fail.
SL: above fail-wick +0.50–1.00.
TPs: 6,638–6,643 → 6,624.75–6,627.25 → 6,611.5–6,618.
Back above 6,658 on 5m = invalidate.
Management (all plays)
First-touch priority; TP1 ≥ 2.0R gate using the 15m-anchored hard SL; no partials before TP1; at TP1 close 70% and set runner to BE; time-stop 45–60m if neither TP1 nor SL hits; max 2 attempts per level per session.
Fundamentals to respect (London → U.S. a.m.)
Bank of England MPC decision & minutes — Thu 12:00 BST (07:00 ET). High-impact for indices/GBP; often injects vol into London PM/NY open.
UK ONS releases — Thu 09:30 BST (04:30 ET) (e.g., housing affordability & Business Insights this week). Moderate.
U.S. Weekly Jobless Claims — Thu 08:30 ET (every Thursday; schedule page).
• Philly Fed Manufacturing Survey — Thu 08:30 ET.
• EIA Natural Gas Storage — Thu 10:30 ET.
S&P 500 Index Holds Near Record High Ahead of Fed AnnouncementS&P 500 Index Holds Near Record High Ahead of Fed Announcement
At 21:00 GMT+3 today, the Federal Reserve will announce its interest rate decision, followed by Jerome Powell’s press conference. The rate is widely expected to be cut from 4.25%–4.50% to 4.00%–4.25%.
This will conclude a prolonged intrigue fuelled by President Trump:
→ his constant criticism of Powell for pursuing an “overly tight” policy;
→ the decision to dismiss Federal Reserve Board member Lisa Cook, which markets perceived as direct pressure on the regulator’s independence.
In anticipation of the outcome, traders are showing optimism. The S&P 500 index reached a new all-time high yesterday, climbing above 6,640 points. This morning the price pulled back slightly, which can be interpreted as a short-term correction ahead of a key event. Effectively, the market has already priced in the expected policy easing, viewing it as a catalyst for further growth.
Technical Analysis of the S&P 500 Chart
Six days ago, when analysing the 4-hour chart of the S&P 500 (US SPX 500 mini on FXOpen), we noted that:
→ the price was oscillating within an upward channel (marked in blue);
→ in September, the index has been following a steep bullish trajectory (marked in orange), with its lower line showing signs of support.
Since then, favourable inflation data helped the bulls break above the channel’s upper boundary (highlighted with an arrow).
Possible scenarios:
Bullish perspective:
→ The breakout candle above the blue channel has a long body, signalling strong buying momentum – an imbalance, also known in Smart Money Concept (SMC) as a Fair Value Gap (FVG).
→ The local level of 6,600, once resistance, has now turned into support; the next target could be the psychological level of 6,700.
→ The price is consolidating above the blue channel’s upper boundary, indicating robust demand.
Bearish perspective:
→ The upper boundary of the orange channel may act as resistance.
→ The RSI indicator, although off overbought territory, remains close to it – potentially deterring buyers from entering at elevated prices.
Taking all of this into account, the current balance could easily be disrupted once the Fed announces its rate decision – arguably the most significant event of the month in the economic calendar. Be prepared for spikes in volatility, as sharp moves in either direction are possible.
This article represents the opinion of the Companies operating under the FXOpen brand only. It is not to be construed as an offer, solicitation, or recommendation with respect to products and services provided by the Companies operating under the FXOpen brand, nor is it to be considered financial advice.

ES (SPX) Analyses for Wed, Sep 17 - FOMC - Key ZonesBias:
The weekly and daily trends are staying positive, with higher highs and higher lows. We're in an uptrend, but right now, we're hitting some resistance instead of pushing into new territory.
Price-wise, we’re stuck in a range between two key levels: there’s some overhead resistance at 6678–6683 (that's the top of yesterday’s range and where things first started to react) and 6703 (which is a key point to watch). On the flip side, the lower support level is at 6653–6658 (this was the high from last week, and often when we retest it, it leads to buying).
Here’s what it all means: If we can stay above 6653–6658 and get rejected around 6678–6683, it might be a good idea to take some short positions back down to that support level. If we do manage to reclaim the lower support after a dip or if we break above 6703, we could continue upward to around 6720–6724, then maybe 6744–6750, and even 6760–6765.
If the bias shifts, like if we see price acceptance below 6653, that could signal a sell-off targeting 6643, then 6627, and possibly down to 6611–6618. On the other hand, if we see acceptance above 6703, it could bring back some long momentum.
Setups (Level-KZ 15m→5m→1m)
LONG — Sweep & Reclaim at 6653–6658 (LIS)
Idea: Liquidity grab into LIS, then buyers step back in.
15m trigger: Wick through 6653–6658 that closes back ≥ 6658.
5m confirm: Re-close up through 6664–6666 with a higher low.
1m entry: First HL pullback that holds 6659–6662.
Hard SL: Below the 15m sweep wick ±0.25–0.50.
• Targets: TP1 6678–6683, TP2 6703, TP3 6720–6724 (leave runner for 6744–6750).
SHORT — Rejection Fade at 6678–6683 (overhead)
Idea: First test into the box top fails; sell the rally back inside.
15m trigger: Probe 6678–6683 that closes back ≤ 6675.
5m confirm: Lower high + re-close down through 6672–6674.
1m entry: First LH retest 6679–6682 that fails.
Hard SL: Above the 15m rejection wick ±0.25–0.50.
• Targets: TP1 6666–6668, TP2 6653–6658, TP3 6638–6643.
• Skip if TP1 < 2.0R versus your wick stop.
We might see some compression before the FOMC meeting, especially in the early afternoon. It’s probably best to just react to any trades at the edges. The real action usually kicks off between 2:00 and 2:35 pm when the statement comes out and the Q&A starts.
In the morning, there’ll be some mixed signals with housing data at 8:30, EIA at 10:30, and the VIX settling, which could cause some quick, random spikes. Just treat those as noise unless they really break through your levels.
And don’t forget, the flows leading into Friday’s OPEX can really amp up the swings after the FOMC. The gamma profile tends to reset after the press conference too.
S&P500 Key Trading levels Optimism on US-China relations drove markets higher after Trump’s positive Madrid meeting comments and Treasury Sec. Bessent’s note on a TikTok deal framework.
The NASDAQ Golden Dragon China index (+0.87%) outperformed as US-listed Chinese firms rallied.
This lifted global equities: S&P 500 +0.47% (new ATH), Stoxx 600 +0.42%, both near record highs.
Tech led gains: NASDAQ +0.94%, Magnificent 7 +1.95%. Alphabet hit $3trn valuation, Tesla +3.56% on Musk’s share purchase. Nvidia slipped (-0.04%) on China antitrust news.
Despite broad weakness under the surface, the S&P 500 is now +12.47% YTD and has risen in 6 of the past 7 weeks—its strongest stretch in 2025.
Conclusion for S&P 500 today:
With sentiment anchored by trade optimism and tech leadership, momentum remains upward, but concentration in a few mega-cap names alongside weaker breadth suggests potential for near-term consolidation even as the broader index holds bullish bias.
Key Support and Resistance Levels
Resistance Level 1: 6640
Resistance Level 2: 6660
Resistance Level 3: 6680
Support Level 1: 6575
Support Level 2: 6550
Support Level 3: 6530
This communication is for informational purposes only and should not be viewed as any form of recommendation as to a particular course of action or as investment advice. It is not intended as an offer or solicitation for the purchase or sale of any financial instrument or as an official confirmation of any transaction. Opinions, estimates and assumptions expressed herein are made as of the date of this communication and are subject to change without notice. This communication has been prepared based upon information, including market prices, data and other information, believed to be reliable; however, Trade Nation does not warrant its completeness or accuracy. All market prices and market data contained in or attached to this communication are indicative and subject to change without notice.
