S&P 500 Index: Early December Chart AnalysisS&P 500 Index: Early December Chart Analysis
December is traditionally a favourable month for the S&P 500 :
→ Since the 1950s, December has ended higher in over 70% of years.
→ Average monthly gain is around +1.0%.
Will the index rise in 2025? Much depends on the Federal Reserve meeting on 10 December, as well as other factors, including geopolitical developments. Interest is also piqued by an upcoming statement from Trump at the White House (today, 22:00 GMT+3), though the topic remains undisclosed.
Technical Analysis of the S&P 500 Chart
Demand-side perspective:
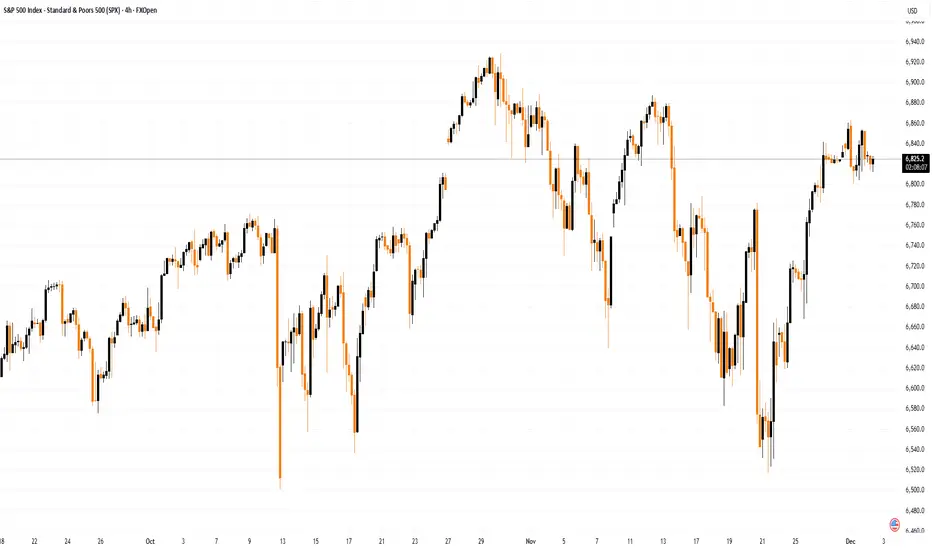
→ The rebound from November’s low was aggressive, rising roughly +5% in 10 days.
→ Price climbed above the blue trendline that has acted as support since summer.
→ The recent dip (marked by the red trajectory) could be a temporary correction, forming a Bull Flag pattern.
Supply-side perspective:
→ The red trajectory has not yet been breached.
→ Recent price movements show a strong bearish Head and Shoulders pattern, along with signs of a Quasimodo formation, emerging around the attempt to break the upper boundary.
In the short term, the former resistance at 6785 may now act as support. Overall, the S&P 500 is likely to adopt a wait-and-see stance, adjusting as economic news, delayed by the government shutdown, is released.
This article represents the opinion of the Companies operating under the FXOpen brand only. It is not to be construed as an offer, solicitation, or recommendation with respect to products and services provided by the Companies operating under the FXOpen brand, nor is it to be considered financial advice.
SPXM
S&P 500 Index Shows Elevated VolatilityS&P 500 Index Shows Elevated Volatility
On the 4-hour chart of the S&P 500 Index (US SPX 500 mini on FXOpen), the ATR indicator with standard settings has not fallen below the 30 mark, signalling higher current market volatility compared to previous periods. Traders’ decisions are being influenced by the ongoing government shutdown, developments around a potential US-China tariff deal, and an increasingly active earnings season. Market sentiment has also been shaped by renewed concerns over regional bank stability and profit-taking in AI-related stocks.
Looking ahead, the new week is also expected to bring heightened volatility, as:
→ US Treasury Secretary Scott Bessent and Chinese Vice Premier He Lifeng are set to meet in the coming days, paving the way for a potential meeting between Presidents Trump and Xi later this month.
→ Attention will also turn to quarterly results from Netflix, Coca-Cola, Tesla, IBM, and Intel. With key US economic data releases suspended due to the government shutdown, investors are likely to look to corporate earnings for direction.
Technical Analysis of the S&P 500 Chart
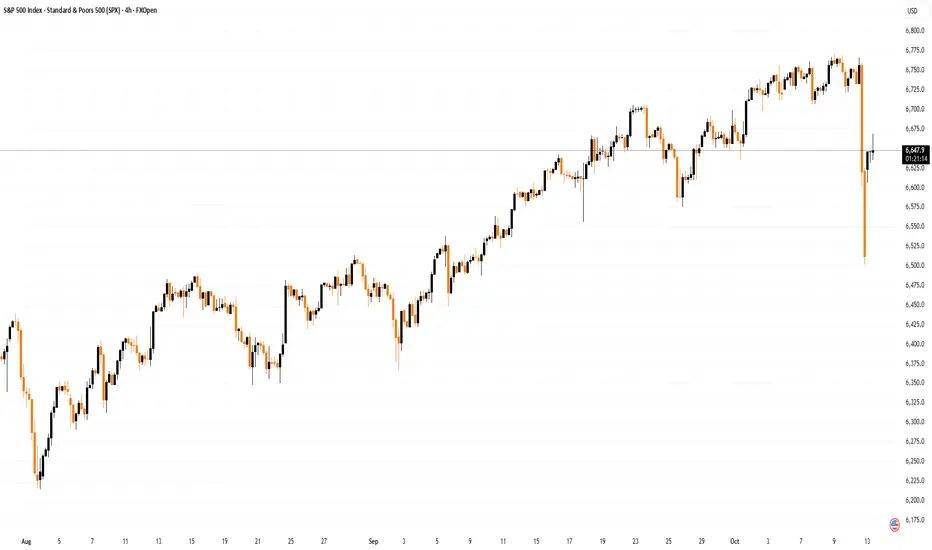
Major turning points on the 4-hour S&P 500 chart, highlighted in bold, outline a broad ascending channel that reflects the market’s expanded price swings.
From a bullish perspective:
→ The price remains in the upper half of the channel.
→ Market sentiment is improving, with prices moving closer to last week’s highs during the European session.
→ As indicated by the arrow, a wide bullish engulfing pattern formed near the lower boundary of the channel, confirming strong buying interest around the 6,560 level.
From a bearish standpoint:
→ Selling pressure was particularly aggressive near 6,720, pushing the price lower on 10 October.
→ Last week, this level once again acted as resistance, suggesting that bears maintain control there, limiting near-term upside potential.
Given these dynamics, traders may wish to adjust their strategies to account for the prevailing volatility. Should positive headlines emerge on US-China trade progress, supported by upbeat corporate forecasts, the S&P 500 could make a push towards the upper channel boundary, potentially setting a new record near the 6,800 mark.
This article represents the opinion of the Companies operating under the FXOpen brand only. It is not to be construed as an offer, solicitation, or recommendation with respect to products and services provided by the Companies operating under the FXOpen brand, nor is it to be considered financial advice.

Trump’s Decision Shakes Global Financial MarketsTrump’s Decision Shakes Global Financial Markets
On Friday, 10 October, President Trump made an unexpected statement about the possible introduction of 100% tariffs on Chinese goods, triggering sharp price swings across global markets:
→ Stock markets: The S&P 500 index tumbled by more than 3%, hitting its lowest level in over a month.
→ Currency markets: The US dollar slumped sharply against other major currencies.
However, on Sunday, Donald Trump softened his tone on Truth Social, suggesting that trade relations with Beijing “will be absolutely fine”. Vice President JD Vance echoed this sentiment, adding that the United States is ready for talks if China is “prepared to act reasonably”.
This shift in rhetoric from US officials helped markets recover, with the S&P 500 index rebounding sharply at Monday’s open, reclaiming much of Friday’s losses.
Technical Analysis of the S&P 500 Chart
In our previous analysis of the 4-hour S&P 500 chart (US SPX 500 mini on FXOpen) on 4 October, we identified an upward channel (shown in blue) and expressed several concerns:
→ The price was approaching the upper boundary of the channel, where long positions are often closed for profit.
→ The latest peak slightly exceeded the October high (A), suggesting a potential bearish divergence.
→ The news blackout caused by the government shutdown created an “information vacuum”, which could quickly turn sentiment negative if filled with adverse developments.
The lower boundary of the blue channel offered only temporary support near 6,644 points on Friday before the price broke downwards. Doubling the channel width provides a projected target near 6,500, which coincides with Friday’s low.
Given these factors, it can be assumed that the lower line of the blue channel now acts as the median of a broader range following Friday’s sell-off. This suggests that in the coming days, the S&P 500 index may stabilise as demand and supply find temporary balance along this line.
Looking further ahead, the situation may resemble that of early April, when after a panic-driven market drop (also triggered by Trump’s tariff comments), the S&P 500 not only fully recovered but went on to reach new highs.
Key Levels:
→ 6,705 – a level that has acted as both support and resistance this autumn;
→ 6,606 – the boundary of the bullish gap.
This article represents the opinion of the Companies operating under the FXOpen brand only. It is not to be construed as an offer, solicitation, or recommendation with respect to products and services provided by the Companies operating under the FXOpen brand, nor is it to be considered financial advice.
The S&P 500 index remains positive against all oddsThe S&P 500 index remains positive against all odds
We noted on 29 September that, amid the US shutdown, sentiment in the S&P 500 index market remained positive, and highlighted factors supporting further growth.
Today, the S&P 500 index reached a fresh all‑time high: on Friday morning the price rose above 6 740 points. This confirms the continued optimism among market participants. Today this is supported by news related to the creators of ChatGPT.
According to media reports, OpenAI:
→ has reached a valuation of $500 billion following a deal in which current and former employees sold shares worth around $6.6 billion;
→ is expanding cooperation with semiconductor manufacturers in South Korea, which is expected to sustain the company’s high growth rate.
Thus, OpenAI’s successes are boosting investor optimism ahead of the upcoming earnings season.
These and other positive developments might have been overshadowed by the regular Non‑Farm Employment Change report (and other US labour market data), but the Bureau of Labour Statistics is closed due to the shutdown.
Technical analysis of the S&P 500 chart
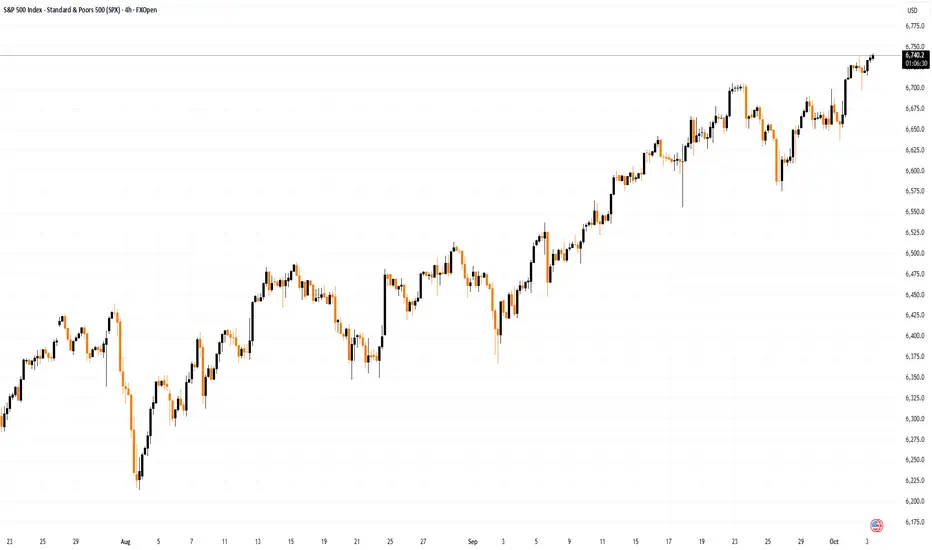
Recent data on the 4‑hour chart of the S&P 500 index underline sustained optimism, as the price develops within a previously established ascending channel, highlighted in blue.
From a bullish perspective:
→ bulls showed strength by breaking a local resistance level at 6 700, which later acted as support (indicated by an arrow);
→ local peaks allow for steeper upward trendlines to be drawn;
→ if the move from A→B is seen as the main impulse and B→C as a correction, the correction appears shallow, as the reversal upwards occurred from the 0.382 Fibonacci level, highlighting strong demand.
From a bearish perspective:
→ the price is approaching the upper boundary of the channel, where profit‑taking by long holders is typical;
→ the current peak on the e‑mini S&P 500 chart slightly exceeds the October high (A), suggesting the potential for a bearish divergence;
→ the absence of news creates an “information vacuum” that could significantly influence market sentiment if filled with negative data.
Nonetheless, optimism persists, with Tom Lee (Fundstrat) forecasting that the S&P 500 index will exceed 7 000 points by year‑end.
This article represents the opinion of the Companies operating under the FXOpen brand only. It is not to be construed as an offer, solicitation, or recommendation with respect to products and services provided by the Companies operating under the FXOpen brand, nor is it to be considered financial advice.
The S&P 500 Index Remains Positive Against the OddsThe S&P 500 Index Remains Positive Against the Odds
Today, the S&P 500 Index is trading close to a new all-time high, having opened Monday above 6,675 points. This reflects continued optimism among market participants despite factors such as:
→ The risk of a U.S. government shutdown on 1 October.
Today, President Trump will meet with Democratic and Republican leaders in Congress to try to prevent a halt to government funding. However, Reuters reports that chances of reaching an agreement are slim. At the same time, Bank of America analysts remain calm, noting that a shutdown would shave only around 0.1% off GDP per week, and historically such closures have had little impact on financial markets.
→ Jerome Powell’s hawkish stance at the September Federal Reserve meeting.
Nevertheless, most market participants expect the Fed to make another move towards cutting rates at its next meeting on 29 October. The publication of the PCE index on Friday increased this likelihood, as the figures came in line with forecasts, reducing the risk of a renewed inflation surge.
Technical Analysis of the E-mini S&P 500 Chart
On 17 September, analysing the 4-hour chart of the S&P 500 Index, we noted:
→ the price continues to fluctuate within an ascending channel, highlighted in blue;
→ the long body of the bullish candle on 11 September points to strong buyer pressure, indicating an imbalance, or, in Smart Money Concept terminology, a Fair Value Gap (FVG).
At present, the channel remains relevant, but it has expanded — bullish sentiment has shifted the key line (marked in orange) from resistance to support. At the same time, the FVG zone has confirmed its role as support.
Possible developments: the chart indicates a buyer advantage:
→ strong demand near the channel’s median (evident in the long lower shadows from Friday, marked with an arrow);
→ buying activity has been strong enough to push the price back (for now) within the ascending channel.
If buyer dominance continues, this could lead to a new all-time high, testing the upper boundary of the channel. From a bearish perspective:
→ the psychological level of 6,700 could act as resistance;
→ continued growth at Monday’s open could push the RSI indicator into overbought territory, creating potential for a correction.
However, as long as the S&P 500 Index remains above the orange support line, there is reason to believe that the bulls remain in control.
This article represents the opinion of the Companies operating under the FXOpen brand only. It is not to be construed as an offer, solicitation, or recommendation with respect to products and services provided by the Companies operating under the FXOpen brand, nor is it to be considered financial advice.

S&P 500 Hits Record High Ahead of CPI ReportS&P 500 Hits Record High Ahead of CPI Report
Today at 15:30 GMT+3, the Consumer Price Index (CPI) report will be released.
In anticipation of the figures, traders remain optimistic – the S&P 500 index reached a new all-time high yesterday, climbing above 6,560 points.
The bullish sentiment is driven by:
→ Expectations of an interest rate cut in September, which is believed to provide a positive boost to the US economy (and increase corporate profits).
→ A sharp rally in Oracle (ORCL) shares. The company announced it had signed four multibillion-dollar contracts with three different clients.
Technical Analysis of the S&P 500
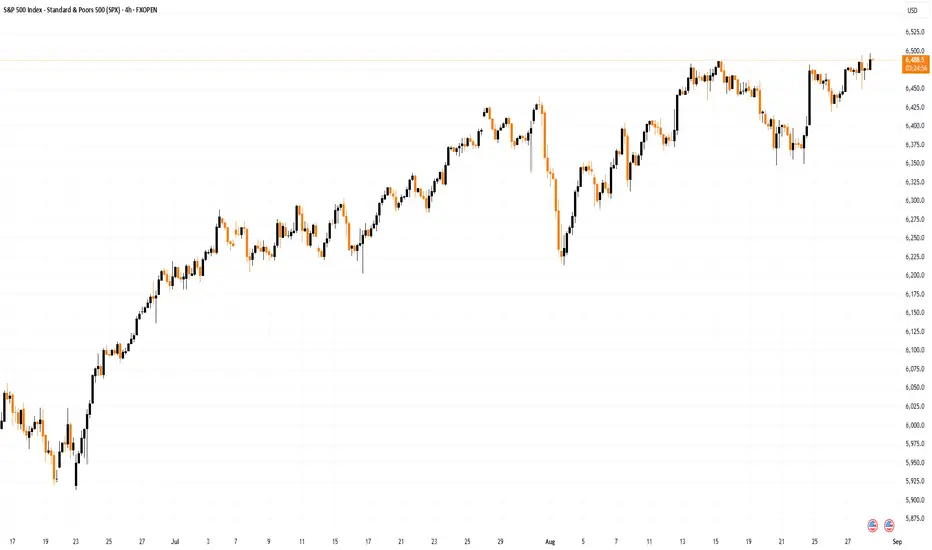
On the 4-hour chart of the S&P 500 index, the price continues to move within an ascending channel, shown in blue.
From a bearish perspective:
→ the price is near the upper boundary of the channel, which has acted as resistance for several weeks;
→ the RSI indicator is close to the overbought zone, which may discourage buyers from entering at higher prices;
→ yesterday’s candle had a long upper shadow (marked with an arrow), indicating increased selling pressure.
From a bullish perspective:
→ the local level of 6,520, after being broken, has switched from resistance to support;
→ in September, the price has followed a steep upward trajectory (marked with orange lines), with the lower line showing signs of support.
Taking this into account, we could assume that the market is in a short-term state of balance while awaiting the release of inflation data – arguably the key event of the week in the economic calendar.
Favourable figures could encourage the bulls to attempt a breakout above the upper boundary of the channel, lifting the S&P 500 to a new all-time high. Be prepared for spikes in volatility.
This article represents the opinion of the Companies operating under the FXOpen brand only. It is not to be construed as an offer, solicitation, or recommendation with respect to products and services provided by the Companies operating under the FXOpen brand, nor is it to be considered financial advice.

S&P 500 Index Reaches Another All-Time HighS&P 500 Index Reaches Another All-Time High
On 13 August, we wrote about the S&P 500 reaching an all-time high following the release of the CPI report. At that time, we suggested that the price might move towards the upper boundary of the ascending channel (highlighted in blue on the chart).
Since then:
→ the price has set a new record, forming peak 0 near the upper boundary of the channel;
→ it then fell back towards the lower boundary, where block A was formed;
→ and subsequently rose again to a fresh all-time high (F), coming close to the 6500 level.
The resilience of the blue channel underlines the prevailing bullish sentiment, which is supported by expectations of a Fed rate cut in September – an event seen as positive for the economy and potentially boosting corporate earnings. This optimism is so far outweighing the fact that Nvidia’s shares slipped slightly yesterday after the company’s earnings release (despite results exceeding investor expectations).
But is the outlook entirely cloudless?
S&P 500 Chart Technical Analysis
Looking at the 4-hour chart of the S&P 500, there are grounds to make slight adjustments to the slope and width of the ascending channel to better reflect the latest data.
At first glance, the picture appears bullish:
→ long lower shadows around block A point to strong buying interest;
→ downward pullbacks (B→C following impulse A→B, and D→E following impulse C→D) halted near the classic 50% Fibonacci retracement;
→ higher lows in late August give reason to consider the formation of a cup and handle pattern.
However, the bears also have their counterarguments:
→ the 6,500 level could act as psychological resistance (with the risk of a false bullish breakout);
→ the upper boundary of the channel may provide resistance;
→ the marked extremes resemble a bearish rising wedge pattern.
Progress in establishing new highs is becoming weaker each time – it seems that the S&P 500 bull market is running out of steam. This raises concerns about a correction – and with September’s long-standing reputation as the most unfavourable month for markets, a noticeable pullback could happen.
This article represents the opinion of the Companies operating under the FXOpen brand only. It is not to be construed as an offer, solicitation, or recommendation with respect to products and services provided by the Companies operating under the FXOpen brand, nor is it to be considered financial advice.
S&P 500 Index Reaches New All-Time HighS&P 500 Index Reaches New All-Time High
The S&P 500 index set a new all-time high, climbing above the 6,460 mark. The rally in equities is a direct result of yesterday’s CPI report.
According to Forex Factory, the annual CPI remained at 2.7%, whereas analysts had forecast an increase to 2.8%. Moderate inflation readings provide stronger grounds for a Federal Reserve interest rate cut — a move President Trump has been strongly advocating.
Data from the CME FedWatch tool shows that traders now price in a 94% probability of a key rate cut in September, compared to nearly 86% the day before and around 57% a month ago. This prospect of monetary policy easing acts as a bullish driver for the stock market.
Technical Analysis of the S&P 500 Chart
On the H4 chart of the S&P 500, there are grounds to outline an ascending channel (shown in blue). The price is currently in the upper half of the channel — a sign of prevailing optimism in the market.
Following yesterday’s CPI release, the price generated a strong bullish impulse, breaking two resistance levels from below (as indicated by the arrow):
→ August high at 6,406
→ Previous all-time high around 6,440
As a result, these former resistance levels now form the 6,406–6,440 zone. We can assume that:
→ this area may act as support going forward, as buyers clearly held the advantage here;
→ the median line of the ascending channel may also provide support, having shown signs of resistance in early August before being decisively broken on yesterday’s strong impulse.
The RSI indicator is hovering near overbought territory, making the market vulnerable to corrections. However, given the improved fundamental backdrop, any pullbacks might be shallow.
In the short term, the S&P 500 may reach the upper orange line, which defines the growth trajectory from the lower to the upper boundary of the long-term ascending channel. Should the fundamental outlook be further reinforced by positive news — for example, relating to a US–Russia leaders’ meeting — the index could advance towards the upper boundary of the blue channel.
This article represents the opinion of the Companies operating under the FXOpen brand only. It is not to be construed as an offer, solicitation, or recommendation with respect to products and services provided by the Companies operating under the FXOpen brand, nor is it to be considered financial advice.

Equity Markets Ahead of the US Inflation ReportEquity Markets Ahead of the US Inflation Report
Today at 15:30 GMT+3, the US inflation report (Consumer Price Index, or CPI) is scheduled for release. According to ForexFactory, analysts expect the inflation rate to rise from 2.4% to 2.6%.
The actual figures will provide market participants with grounds to debate not only the likelihood of a Federal Reserve rate cut, but also the evolving tensions between Donald Trump and Jerome Powell.
Should the report deliver any surprises, it will almost certainly trigger heightened volatility across the equity markets. For now, however, investors are seemingly optimistic about the upcoming fundamental data — especially given the commencement of Q2 earnings season, which lends additional weight to today’s macroeconomic indicators.
Technical Analysis of the S&P 500 Chart
The S&P 500 chart (US SPX 500 mini on FXOpen) shows the index fluctuating within a range defined by support at 6,222 and resistance at 6,290.
The upward impulses (as indicated by arrows) suggest that:
→ current market optimism, combined with the CPI release, may lead to a bullish breakout above resistance and the establishment of a new all-time high;
→ in a broader context, such a breakout could be interpreted as a continuation of the rally that began in April, following a period of consolidation between the aforementioned levels.
This article represents the opinion of the Companies operating under the FXOpen brand only. It is not to be construed as an offer, solicitation, or recommendation with respect to products and services provided by the Companies operating under the FXOpen brand, nor is it to be considered financial advice.
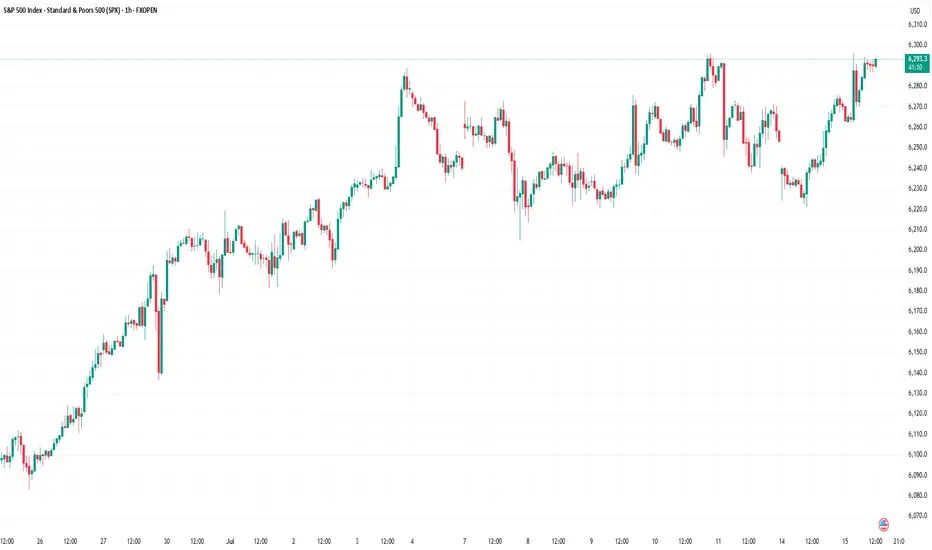
S&P 500 Hit Record High Ahead of Holiday BreakS&P 500 Hit Record High Ahead of Holiday Break
Today, financial markets in the United States are closed in observance of Independence Day. Investor sentiment was likely buoyed by the latest rally in the S&P 500 index (US SPX 500 mini on FXOpen), which set a new all-time high yesterday, surpassing 6,280.
The bullish momentum has been driven by robust labour market data in the US. According to ForexFactory, analysts had anticipated a rise in the unemployment rate from 4.2% to 4.3%, but instead, it unexpectedly declined to 4.1%.
Can the stock market continue to climb?
Technical Analysis of the S&P 500 Chart
Analysing the 4-hour chart of the S&P 500 index (US SPX 500 mini on FXOpen)on 30 June, we observed the following:
→ An ascending channel was formed (indicated in blue);
→ A developing bullish impulse (marked with an orange line) suggested the price would move towards the upper boundary of the channel – a scenario that materialised with yesterday’s rally (as shown by arrow 1).
However, from a price action perspective, the recent downward move (arrow 2) has now gained significance. It may indicate that sellers are becoming more active around the identified resistance level.
Should the price decline towards the lower orange line, this could negate the current bullish impulse altogether, effectively reflecting a classic bearish engulfing pattern.
Given the above, there is reason to believe that bears are attempting to regain control after the S&P 500 (US SPX 500 mini on FXOpen) surged over 5% in the past 10 days. As such, a potential breakout below the orange line cannot be ruled out, with price action possibly targeting the median of the blue ascending channel.
What happens next?
The market’s trajectory will largely hinge on developments related to tariffs. Trade policy will remain in the spotlight next week, as key deadlines set by the White House approach — events that traders will be closely monitoring.
This article represents the opinion of the Companies operating under the FXOpen brand only. It is not to be construed as an offer, solicitation, or recommendation with respect to products and services provided by the Companies operating under the FXOpen brand, nor is it to be considered financial advice.

S&P 500 Sets New All-Time High, Surges Above 6200S&P 500 Sets New All-Time High, Surges Above 6200
The S&P 500 index (US SPX 500 mini on FXOpen) started the week by reaching a fresh all-time high. As shown on the chart, the index hit 6,210 points earlier this morning.
In addition to a reduced risk of US involvement in a large-scale war in the Middle East, market optimism has been fuelled by:
→ Tariff-related news. Last week, the US President announced the signing of a trade deal with China, while Treasury Secretary Scott Bessent expressed hope that the US would conclude trade negotiations with over a dozen countries by early September.
→ Strong corporate performance. On Friday, Nike (NKE) shares led the stock market, rising by more than 15% following an earnings report that exceeded analysts’ expectations. This could be boosting investor sentiment ahead of the upcoming earnings season.
Technical Analysis of the S&P 500 Chart
Evaluating the 4-hour chart of the S&P 500 index (US SPX 500 mini on FXOpen) in the context of June’s price movements reveals key reference points (marked on the chart) that outline an ascending channel. A consolidation zone, marked with an arrow, highlights a temporary equilibrium between supply and demand—after which buyers gained the upper hand, pushing the price upward.
It is possible that the ongoing bullish momentum could carry the price toward the upper boundary of the channel. However, attention should be paid to the RSI indicator, which suggests the market is heavily overbought; in fact, Friday’s reading marked the highest level of the year. In such conditions, a price correction cannot be ruled out—potentially back toward the local ascending trendline (shown in orange).
This article represents the opinion of the Companies operating under the FXOpen brand only. It is not to be construed as an offer, solicitation, or recommendation with respect to products and services provided by the Companies operating under the FXOpen brand, nor is it to be considered financial advice.

Stock Markets Rebound Following Trump’s Ceasefire AnnouncementStock Markets Rebound Following Trump’s Ceasefire Announcement
Last night, U.S. President Donald Trump made a social media post announcing a ceasefire agreement between Iran and Israel. According to his own words, the ceasefire is set to last “forever.” This announcement triggered a sharp bullish impulse (indicated by the blue arrow) on the S&P 500 index chart (US SPX 500 mini on FXOpen), pushing the price to a new high above the 6074 level.
Just yesterday, traders feared that the United States could be drawn into yet another costly war following bomber strikes on Iran’s nuclear facilities. However, today the stock markets are recovering, signalling growing optimism and a waning of fears over a major escalation of the conflict.
Technical Analysis of the S&P 500 Chart
When analysing the S&P 500 index chart (US SPX 500 mini on FXOpen) seven days ago, we identified an ascending channel. The angle of the trend remains relevant, while the width of the channel has expanded due to the downward movement caused by tensions in the Middle East.
Notably:
→ the price marked the lower boundary of the channel as well as the internal lines (shown by black dots) dividing the channel into quarters;
→ the latest bullish impulse suggests that the upward trend is resuming after breaking out of the correction phase (indicated by red lines).
It is possible that in the near future, the S&P 500 index (US SPX 500 mini on FXOpen) could reach the median line of the channel. There, the price may consolidate, reflecting a balance between buyers and sellers—particularly if the peace in the Middle East proves to be lasting.
This article represents the opinion of the Companies operating under the FXOpen brand only. It is not to be construed as an offer, solicitation, or recommendation with respect to products and services provided by the Companies operating under the FXOpen brand, nor is it to be considered financial advice.

How Financial Markets Are Reacting to Middle East EscalationHow Financial Markets Are Reacting to the Escalation in the Middle East
The exchange of strikes between Iran and Israel continues. However, judging by the behaviour of various assets, market participants do not appear to expect further escalation:
→ Oil prices are falling. Monday’s candlestick on the XBR/USD chart closed significantly below the opening level.
→ Safe-haven assets are also retreating: the Swiss franc weakened during Monday’s U.S. session, while a bearish candle formed on the daily XAU/USD chart.
Equity markets, too, have largely held their ground.
The S&P 500 index (US SPX 500 mini on FXOpen) climbed on Monday (A→B) following reports of potential talks between Iran and the U.S. However, it pulled back (B→C) after the U.S. President urged citizens to evacuate Tehran.
Technical Analysis of the S&P 500 Chart
News of Israeli strikes on targets inside Iran led to a bearish breakout from the rising channel (marked with a red arrow), though the downward move failed to gain traction.
At present, the S&P 500 chart (US SPX 500 mini on FXOpen) shows the formation of an ascending triangle — a signal of temporary balance between supply and demand.
Still, given the elevated geopolitical uncertainty, this balance remains fragile. It could be disrupted by:
→ Further developments in the Iran–Israel conflict (notably, Donald Trump left the G7 summit early due to the situation in the Middle East);
→ U.S. retail sales data , due today at 15:30 GMT+3.
It is possible that the S&P 500 may soon attempt to break out of the triangle , potentially triggering a new directional trend.
This article represents the opinion of the Companies operating under the FXOpen brand only. It is not to be construed as an offer, solicitation, or recommendation with respect to products and services provided by the Companies operating under the FXOpen brand, nor is it to be considered financial advice.

S&P 500 Breaks UptrendS&P 500 Breaks Uptrend
Only yesterday we questioned the sustainability of the stock market’s upward trend amid alarming news from the Middle East and the evacuation of the US embassy in Iraq — and today, the S&P 500 chart (US SPX 500 mini on FXOpen) shows a break below the lower boundary of the ascending trend channel.
According to media reports:
→ Steve Witkoff, US President Donald Trump’s special envoy to the Middle East, was expected to meet Iran’s Foreign Minister in Oman on Sunday.
→ Friday the 13th became the date when Israel launched strikes on Iran’s nuclear facilities, dramatically altering the outlook for a potential US-Iran nuclear agreement.
→ Secretary of State Marco Rubio stated that the US was not involved in the operation, while Israel’s state broadcaster reported that Washington had been informed ahead of the strikes.
Technical Analysis of the S&P 500 Chart
Yesterday morning, we noted that the Q-line, which divides the lower half of the channel into two quarters, had shifted from acting as support to becoming resistance. This was confirmed during the US trading session (as indicated by the arrow).
Selling pressure intensified, and the psychologically important 6,000 level — which showed signs of support earlier in June — now appears to be acting as resistance. It is in this area that the E-Mini S&P 500 (US SPX 500 mini on FXOpen) broke below the lower boundary of its uptrend channel.
In addition to ongoing discussions about potential Fed rate cuts this summer, geopolitical risk assessments are now also in focus. It remains unclear how Washington will respond if Iran retaliates.
Meanwhile, Israel’s Defence Minister has declared a state of emergency, warning of an imminent missile and drone attack — further fuelling fears of a possible escalation.
This article represents the opinion of the Companies operating under the FXOpen brand only. It is not to be construed as an offer, solicitation, or recommendation with respect to products and services provided by the Companies operating under the FXOpen brand, nor is it to be considered financial advice.

S&P 500 Maintains Uptrend — But for How Long?S&P 500 Maintains Uptrend — But for How Long?
As the chart of the S&P 500 (US SPX 500 mini on FXOpen) shows, price movements in June continue to form an upward trend (highlighted in blue).
The bullish momentum is being supported by:
→ News of a potential trade agreement between the United States and China;
→ The latest inflation report. Data released yesterday showed that the Consumer Price Index (CPI) slowed from 0.2% to 0.1% month-on-month.
President Donald Trump described the inflation figures as “excellent” and said that the Federal Reserve should cut interest rates by a full percentage point. In his view, this would stimulate the economy — and serve as another bullish driver.
However, as illustrated by the red arrow, the index pulled back yesterday from its highest level in three and a half months, falling towards the lower boundary of the channel. This decline was triggered by concerning developments in the Middle East. According to media reports, the US is preparing a partial evacuation of its embassy in Iraq, following statements by a senior Iranian official that Tehran may strike US bases in the region if nuclear talks with Washington fail.
Technical Analysis of the S&P 500 Chart
Currently, the price remains near the lower boundary of the ascending channel, reinforced by the psychologically significant 6,000-point level.
However, note that line Q — which divides the lower half of the channel into two quarters — has flipped from support to resistance (as indicated by black arrows). This suggests increasing bearish pressure, and there is a possibility that sellers may soon attempt to push the price below the channel support.
Be prepared for potential spikes in volatility on the E-Mini S&P 500 (US SPX 500 mini on FXOpen) chart as markets await the release of the Producer Price Index (PPI) at 15:30 GMT+3 today.
This article represents the opinion of the Companies operating under the FXOpen brand only. It is not to be construed as an offer, solicitation, or recommendation with respect to products and services provided by the Companies operating under the FXOpen brand, nor is it to be considered financial advice.

S&P 500 Falls Following Downgrade of US Credit RatingS&P 500 Falls Following Downgrade of US Credit Rating
On Friday, 16 May, after markets had closed, Moody’s Ratings announced a downgrade of the long-term sovereign credit rating of the United States from the highest level of Aaa to Aa1. The key reasons cited by Moody’s were the rising national debt and interest payments, as well as expectations of a further increase in the budget deficit. Notably:
→ The downgrade was hardly a surprise. A similar move was made by Standard & Poor’s back in 2011, while Fitch Ratings followed suit in August 2023.
→ The official response may be seen as reassuring for market participants. US Treasury Secretary Scott Bessent played down concerns about the downgrade in an interview with NBC News, calling credit ratings “lagging indicators” and placing the blame on the previous administration.
→ Despite the downgrade, Moody’s acknowledged the US dollar’s role as the world’s reserve currency and stated that the United States “retains exceptional credit strengths, such as the size, resilience, and dynamism of its economy.”
Stock Market Reaction
The announcement triggered a negative market reaction, reflected in falling prices during Monday morning’s opening session. E-mini S&P 500 futures (US SPX 500 mini on FXOpen) retreated, as indicated by the arrow on the chart, pulling back from the highs reached by Friday’s close.
Last week, we pointed out signs of slowing momentum in the S&P 500 rally. Could the decline continue further?
Technical Analysis of the S&P 500 Chart
By drawing lines A, B, and C through the May rally peaks, we can observe a gradual flattening of the slope — suggesting that the bulls are losing momentum and confidence.
The price is currently trading between local lines C and C1, but it is reasonable to assume that the opening of the US session may bring renewed bearish pressure — potentially pushing the price lower, towards the bottom boundary of the broader upward channel (marked in blue).
This article represents the opinion of the Companies operating under the FXOpen brand only. It is not to be construed as an offer, solicitation, or recommendation with respect to products and services provided by the Companies operating under the FXOpen brand, nor is it to be considered financial advice.

S&P 500 Index May Lose Upward MomentumS&P 500 Index May Lose Upward Momentum
Yesterday’s inflation data release held no major surprises, as the actual Consumer Price Index (CPI) figures came in close to analysts’ forecasts.
According to Forex Factory:
→ Annual CPI: actual = 2.3%, forecast = 2.4%, previous = 2.4%;
→ Monthly Core CPI: actual = 0.2%, forecast = 0.3%, previous = 0.1%.
Overall, stock indices rose yesterday, but according to media reports, this momentum may begin to slow in the near future:
→ UBS analysts downgraded their rating on US equities from “attractive” to “neutral” following the recovery from early April lows;
→ Goldman Sachs analysts believe that the US stock market rally could stall at current levels. In their view, the S&P 500 (US SPX 500 mini on FXOpen) is likely to reach 5900 over the next three months.
Technical Analysis of the E-Mini S&P 500 Chart
The chart provides more reasons to suggest that the current pace of growth may begin to slow.
Firstly, the index has entered a broad range between 5800 and 6120, where it spent a prolonged period during late 2024 and early 2025. This is a zone (highlighted in purple) where supply and demand previously reached a stable equilibrium — and similar balance could potentially emerge again.
Secondly:
→ the slope of the current upward channel (marked in black) appears excessively steep;
→ the RSI indicator points to a divergence;
→ the psychological level of 6000 may act as resistance.
Given the above, special attention should be paid to the scenario in which the S&P 500 (US SPX 500 mini on FXOpen) forms a short-term correction before the end of the month.
This article represents the opinion of the Companies operating under the FXOpen brand only. It is not to be construed as an offer, solicitation, or recommendation with respect to products and services provided by the Companies operating under the FXOpen brand, nor is it to be considered financial advice.

S&P 500 Analysis Ahead of the Busiest Week of Earnings SeasonS&P 500 Chart Analysis Ahead of the Busiest Week of Earnings Season
Despite the fact that President Trump’s earlier decision to impose tariffs (at higher rates than expected) shook the stock markets, the S&P 500 index (US SPX 500 mini on FXOpen) could still end April without significant losses (currently trading less than 2% below the month’s opening level) or even achieve a positive result.
According to media reports, around 180 S&P 500 companies are expected to release their quarterly earnings this week, including Apple (AAPL), Amazon (AMZN), Coca-Cola (KO), Eli Lilly (LLY), Meta (META), Microsoft (MSFT), and Chevron (CVX).
The share prices of these major companies — some of the largest by market capitalisation — could have a substantial impact on the S&P 500 index chart (US SPX 500 mini on FXOpen), given that their combined weight accounts for approximately a quarter of the index calculation.
Technical Analysis of the S&P 500 Chart
Based on the key price actions marked on the chart, we can identify a descending trend channel for the US stock market, which has been in effect since mid-February.
At the same time, the price has:
→ moved into the upper half of this channel, reaching its upper boundary;
→ found support around the median line (as evidenced by the price action on 21 April).
These are bullish signs, reinforced by the aggressive nature of the rebound from the psychological 5,000-point level, which acted as significant support in the first few days following the tariff announcement. Bears may still see an attractive opportunity to attempt to resume the downward momentum of the S&P 500 index (US SPX 500 mini on FXOpen), but will the fundamental backdrop support such a move?
From an optimistic perspective, sharp impulses driven by corporate news could lead to a breakout above the upper boundary of the red channel. This would likely be facilitated by important announcements (particularly from senior officials in the US, China, and Europe) regarding de-escalation of the tariff situation.
This article represents the opinion of the Companies operating under the FXOpen brand only. It is not to be construed as an offer, solicitation, or recommendation with respect to products and services provided by the Companies operating under the FXOpen brand, nor is it to be considered financial advice.

Stock Markets Consolidate Ahead of the HolidaysStock Markets Consolidate Ahead of the Holidays
A lull is expected on the financial markets today due to a shortened trading week related to the Easter holiday celebrations.
It is reasonable to assume that traders will get a “breather” after a news-heavy April, which caused a volatile “shakeout” in the stock markets.
US Stock Markets
On Wednesday, Federal Reserve Chair Jerome Powell was both cautious and somewhat aggressive in his forecasts regarding US monetary policy, stating that Trump’s tariffs could delay the achievement of inflation targets.
In response, US President Donald Trump accused Powell of “playing politics”, hinting at his possible dismissal.
European Stock Markets
On Thursday, the ECB cut interest rates for the seventh time in the past 12 months, and European Central Bank President Christine Lagarde left the door open for further easing.
Analysts had expected a rate cut from 2.65% to 2.40%, so the financial markets reacted relatively calmly to the ECB’s decision.
Technical Analysis of the S&P 500 Chart (US SPX 500 mini on FXOpen)
On the charts of European and US stock indices today, a narrowing triangle pattern is forming, indicating a balance between supply and demand — in other words, price is more efficiently factoring in all influencing elements.
On the S&P 500 chart (US SPX 500 mini on FXOpen), the triangle is highlighted in grey. The ADX and ATR indicators are trending downwards, which underlines signs of consolidation.
From a bearish perspective, the market is in a downtrend (marked by the red trend channel) — but from a bullish point of view, price is in the upper half of the channel.
Although the situation appears “reassuring”, the long weekend may bring a string of high-impact statements from the White House, which could disrupt the balance and lead to a breakout from the triangle.
It is not out of the question that the bulls may seize the initiative and challenge the upper boundary of the channel in an attempt to lay the groundwork for an upward trend (shown in blue lines).
This article represents the opinion of the Companies operating under the FXOpen brand only. It is not to be construed as an offer, solicitation, or recommendation with respect to products and services provided by the Companies operating under the FXOpen brand, nor is it to be considered financial advice.

Trump Delays Tariffs for 90 Days. The S&P 500 Rebounds SharplyTrump Delays Tariffs for 90 Days. The S&P 500 Rebounds Sharply
As shown in the chart of the S&P 500 (US SPX 500 mini on FXOpen), the index is currently trading near the 5,500 level.
This result is highly encouraging, considering that as recently as yesterday morning, the index was hovering around 4,900.
Why Have Stocks Risen?
The strong rebound seen yesterday evening was triggered by a statement from the US President — he announced a 90-day delay in the implementation of wide-ranging global trade tariffs, which had originally been unveiled on 2 April and led to a sharp drop in the index (as indicated by the arrow).
However, this does not apply to China, for which tariffs were not delayed but increased. "Due to the lack of respect China has shown towards global markets, I am raising the tariff imposed on China by the United States of America to 125%, effective immediately," said Donald Trump, according to media reports.
Overall, US stock markets responded positively to the news, and Goldman Sachs economists have withdrawn their US recession forecasts.
Technical Analysis of the S&P 500 Chart (US SPX 500 mini on FXOpen)
Despite yesterday’s sharp rebound, the stock market remains in a downtrend (as indicated by the red channel).
From a bullish perspective:
→ A Double Bottom pattern (A–B) has formed around the 4,900 level;
→ Price has moved into the upper half of the channel.
From a bearish perspective:
→ Bulls must overcome key resistance near the psychological 5,000 level;
→ While tariffs have been delayed, they have not been cancelled. As such, the risk of an escalating trade war is likely to continue putting pressure on the S&P 500 index (US SPX 500 mini on FXOpen) in the coming months.
This article represents the opinion of the Companies operating under the FXOpen brand only. It is not to be construed as an offer, solicitation, or recommendation with respect to products and services provided by the Companies operating under the FXOpen brand, nor is it to be considered financial advice.

S&P 500 Index Hits 2025 Low Following Trump's TariffS&P 500 Index Hits 2025 Low Following Trump's Tariff Announcement
As shown on the S&P 500 Index (US SPX 500 mini on FXOpen) chart, the benchmark US stock index dropped below 5,450 points for the first time in 2025. This decline reflects the US stock market’s reaction to the tariffs imposed by the White House on international trade.
According to Reuters:
→ President Donald Trump announced a 10% tariff on most goods imported into the United States, with Asian countries being hit the hardest.
→ This move escalates the global trade war. "The consequences will be devastating for millions of people worldwide," said European Commission President Ursula von der Leyen, adding that the 27-member EU bloc is preparing to retaliate if negotiations with Washington fail.
Financial Markets’ Reaction to Trump’s Tariffs
→ Stock markets in Beijing and Tokyo fell to multi-month lows.
→ Gold hit a new all-time high, surpassing $3,160.
→ The US dollar weakened against other major currencies.
The S&P 500 Index (US SPX 500 mini on FXOpen) is now trading at levels last seen in September 2024, before Trump's election victory.
Investor sentiment appears to have turned bearish, with growing concerns over the impact of Trump's tariffs, as fears mount that they could slow down the US economy and fuel inflation.
Technical Analysis of the S&P 500 Index (US SPX 500 mini on FXOpen)
The bearish momentum seen yesterday signals a continued correction, which we first identified in our 17 March analysis.
At that time, we mapped out a rising channel (blue) that began in 2024, suggesting that selling pressure might ease near its lower boundary. However, Trump's policy decision has reinforced bearish confidence, and now the price may continue fluctuating within the two downward-sloping red lines. This suggests that the long-term blue growth channel is losing its relevance.
This article represents the opinion of the Companies operating under the FXOpen brand only. It is not to be construed as an offer, solicitation, or recommendation with respect to products and services provided by the Companies operating under the FXOpen brand, nor is it to be considered financial advice.

S&P 500 Analysis: Markets Start the Week on a Positive NoteS&P 500 Analysis: Markets Start the Week on a Positive Note
A week ago, while analysing the S&P 500 index chart (US SPX 500 mini on FXOpen), we noted that the market had officially entered a correction phase, as the price had declined more than 10% from its February 19 peak. This drop was driven by mounting uncertainty over the potential economic damage caused by the Trump administration’s tariff policies in international trade.
However, this morning, markets are showing signs of optimism following reassuring statements from officials over the weekend.
According to Reuters:
→ Trump announced plans to hold talks with Chinese President Xi Jinping, while the U.S. Trade Representative is set to meet his Chinese counterpart this week.
→ The European Union has taken a conciliatory stance, delaying its initial countermeasures against the U.S. until mid-April.
As a result, sentiment appears to have shifted towards optimism, with the S&P 500 index (US SPX 500 mini on FXOpen) trading approximately 4% above this month’s low.
Technical Analysis of the S&P 500 Index (US SPX 500 mini on FXOpen)
As noted on 17 March:
→ The price is forming an ascending channel (marked in blue).
→ The fact that the price has reached the lower boundary of the channel suggests that bearish momentum may be fading.
Currently, we are witnessing an attempt at a bullish reversal from the channel’s lower boundary.
From a bearish perspective, resistance may emerge around the 5750 level, where the price has previously reacted (as indicated by the arrows).
From a bullish perspective:
→ Bears have lost control of the 5600 level.
→ A bullish gap at the start of the week indicates a significant shift in market sentiment. If positive news continues to emerge throughout the week, the S&P 500 index (US SPX 500 mini on FXOpen) could attempt a rise towards the median of the identified channel.
This article represents the opinion of the Companies operating under the FXOpen brand only. It is not to be construed as an offer, solicitation, or recommendation with respect to products and services provided by the Companies operating under the FXOpen brand, nor is it to be considered financial advice.

S&P 500 : How Long Could the Stock Market Correction Last?S&P 500 Analysis: How Long Could the Stock Market Correction Last?
Six days ago, we noted that the Nasdaq 100 had entered a correction phase. Now, the S&P 500 (US SPX 500 mini on FXOpen) has followed suit, closing more than 10% below its 19 February peak on Thursday, officially confirming a correction.
Statistically, according to research by Yardeni Research:
→ Market corrections occur quite frequently—since 1929, the S&P 500 has experienced 56 corrections.
→ Only 22 of those corrections turned into bear markets, defined as a drop of 20% or more from recent record highs.
S&P 500 Analysis: How Long Could This Correction Last?
On one hand, Friday’s market rebound suggests that buyers are stepping in.
On the other hand:
→ US Treasury Secretary Scott Bessent stated on Sunday that there are "no guarantees" the world's largest economy will avoid a recession. This came just a week after US President Donald Trump refused to rule out such a scenario.
→ The current correction has lasted 22 days so far, whereas historically, the average correction lasts 115 days and results in a 13.8% decline from the peak.
Technical Analysis of the S&P 500 (US SPX 500 mini on FXOpen)
The price is forming an upward channel around the median line, which alternates between acting as support and resistance (marked in blue).
→ Price action suggests that bulls are struggling to hold above the 6,100 level. In February, they failed to push towards the upper boundary of the channel.
→ Since the price has reached the lower boundary of the channel, there is a possibility that bearish momentum may start to weaken.
However, if the price loses support at the lower boundary of the channel, this would be a bearish signal from a technical perspective, indicating the potential for a deeper correction in the S&P 500 (US SPX 500 mini on FXOpen).
This article represents the opinion of the Companies operating under the FXOpen brand only. It is not to be construed as an offer, solicitation, or recommendation with respect to products and services provided by the Companies operating under the FXOpen brand, nor is it to be considered financial advice.
