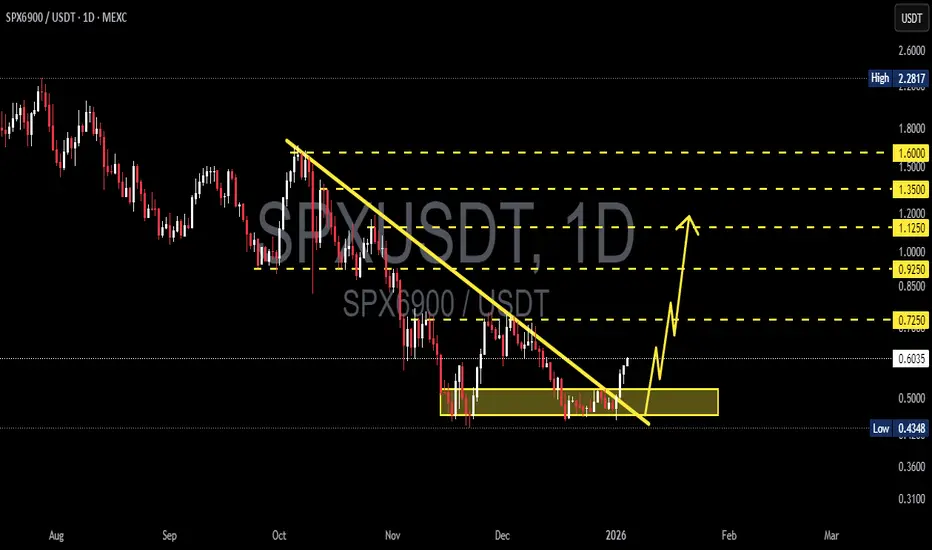
SPX/USDT - Reversal Signal After Descending Trendline PressureSPX6900 has been moving in a clear downtrend structure, characterized by consistent Lower Highs (LH) and Lower Lows (LL). The descending trendline has been acting as strong dynamic resistance since the price peaked around the 1.6 USDT area.
Currently, price has reached a major demand zone (support area) around 0.45 – 0.55 USDT, highlighted by the yellow box on the chart. This zone has historically triggered strong buying reactions.
Most importantly, recent candles show a bullish reaction and an attempt to break above the descending trendline, signaling potential momentum exhaustion on the bearish side.
---
📐 Pattern Explanation
1. Descending Trendline (Bearish Market Structure)
Price has been trading below the descending trendline for an extended period.
Every bullish attempt was rejected at the trendline, confirming seller dominance.
2. Strong Demand / Accumulation Zone
The 0.45 – 0.55 USDT area acts as a key support level.
Multiple rejections from this zone indicate accumulation by buyers.
3. Early Trendline Break Attempt
Price is attempting to break the descending trendline.
A daily close above the trendline is required for valid confirmation of a trend shift.
---
📈 Bullish Scenario
If price:
Closes above the descending trendline
Holds above the 0.55 – 0.60 USDT support area
Then bullish continuation becomes likely, with upside targets:
🎯 Bullish Targets (Resistance Levels):
0.725 USDT
0.925 USDT
1.00 – 1.125 USDT
1.35 USDT
1.50 – 1.60 USDT (major resistance zone)
📌 This scenario will be strengthened by increasing volume and the formation of Higher Lows (HL).
---
📉 Bearish Scenario
The bearish scenario remains valid if:
Price fails to hold above 0.55 USDT
Strong rejection occurs at the descending trendline
⚠️ Downside risks:
Retest of the 0.45 USDT support
Breakdown below demand may push price toward 0.40 – 0.36 USDT
📌 A clean breakdown below the demand zone would invalidate the reversal scenario and confirm bearish continuation.
---
🧠 Key Takeaway
SPX6900 is currently trading at a critical decision zone:
Major demand area
Descending trendline breakout attempt
Price is deciding between: 👉 A bullish reversal and trend change
or
👉 Continuation of the broader bearish trend
Daily candle confirmation is crucial.
---
#SPX6900 #SPX6900USDT #CryptoTechnicalAnalysis #AltcoinAnalysis #DailyChart #TrendlineBreak #DescendingTrend #DemandZone #SupportResistance #BullishScenario #BearishScenario #PriceAction #CryptoTrading
SPXUSD
US500 Price Map. Will Buyers Defend Key Layers Toward 7000?📊 US500/SPX500 Bullish Swing Trade Strategy | Professional Analysis 🚀
Current Price: $6,870.40 | Status: Bullish Momentum Building 🔥
🎯 TRADE OVERVIEW
Asset: US500 / SPX500 Index
Timeframe: DAY/SWING TRADE (Perfect for Active Traders)
Market Condition: BULLISH 📈
Risk Level: Calculated & Managed ✅
💡 WHY THIS SETUP WORKS
The SPX500 is trading near 52-week highs ($6,920.34), with technical indicators showing Strong Buy signals on daily timeframes. Market sentiment remains constructive with potential for mean reversion plays and breakout opportunities. The index has strong institutional support and is consolidating before the next leg up.
🎲 ENTRY STRATEGY: LAYERED APPROACH (THIEF STRATEGY)
Best Practice Approach: Use MULTIPLE LIMIT ORDERS at different price levels for optimal risk management.
Entry Layers - Place These Simultaneously:
Layer 1 - 6,800 (Low Risk Entry)
This is your first position entry at the strong support zone. This layer captures traders looking for early bounces and reduces your average entry cost significantly. Perfect for conservative traders who want maximum confirmation before committing capital.
Layer 2 - 6,825 (Medium Risk Entry)
This second layer adds confirmation as price moves higher. This is where momentum traders jump in. By staggering entries here, you're catching the middle ground between aggressive and conservative positions, giving you excellent risk-reward setup.
Layer 3 - 6,850 (Aggressive Breakout Entry)
This final layer targets breakout traders who wait for price confirmation. Use this only if you have capital left and see strong volume confirmation. This is your most aggressive entry but has the strongest conviction signal.
✅ Pro Tip: You can add MORE layers based on your risk tolerance & account size. Start small, build positions gradually. Never go all-in on one layer!
Why Layering Works 🎯
Layering is the professional way to build positions because it reduces average entry cost, protects against sudden whipsaws, captures multiple entry opportunities, and significantly increases your overall success probability. Instead of being wrong on one entry, you have three chances to be right!
🛑 STOP LOSS (SL): THIEF OG PROTECTION
SL Level: 6,750
Risk Zone: Below support level
This stop loss level protects you from breaking below a critical support zone. If price closes below 6,750, the bullish thesis is broken and you should exit to preserve capital.
📌 IMPORTANT DISCLAIMER:
⚠️ You are NOT required to use our suggested SL
⚠️ Adjust based on YOUR strategy & risk management rules
⚠️ YOUR MONEY = YOUR RULES | Trade with capital you can afford to lose
SL Management Tips:
Place your stop loss below key support levels that make sense with your trading strategy. Once you're in profit (usually +2% on SPX), consider moving your stop to breakeven so you're trading with house money. After solid confirmation and +3-5% profit, use trailing stops to let winners run. Most importantly, never risk more than 2-3% of your total account on a single trade.
🎁 PROFIT TARGET (TP): RESISTANCE CONFLUENCE
Primary Target: 7,000
Reasoning: Strong Resistance + Overbought Zone + Technical Trap Pattern
The 7,000 level represents a major psychological resistance and technical confluence where multiple indicators suggest profit-taking is likely. This is where smart money typically exits positions. The confluence of strong resistance levels, overbought RSI readings, and technical trap pattern all converge at this critical level, making it the ideal exit point for capturing the full move while protecting profits.
📌 CRITICAL NOTICE:
⚠️ Use YOUR OWN profit targets based on risk/reward ratio
⚠️ This is a SUGGESTED level only
⚠️ Protect Your Profits: Lock in gains before pullbacks
Exit Strategy:
Watch for volume divergence signals where price moves higher but volume decreases - this is a classic warning sign. Monitor RSI levels above 70, which indicate overbought conditions and potential reversals. Track support and resistance breaks throughout the move. Most importantly, don't be greedy. If you've hit your profit target, take it and move on. The best traders know when to say "I'm done for the day."
📍 RELATED PAIRS TO MONITOR (CORRELATION ANALYSIS)
Strong Positive Correlation 🔗
NASDAQ-100 (NQ100/COMP) - Correlation: +0.92
This is your tech-heavy index and moves almost in lockstep with US500. Why watch this? Because tech drives the market. If NASDAQ is weak while SPX is strong, watch out for sector rotation. The NASDAQ-100 currently sits at 25,692. If SPX breaks 7,000, expect NASDAQ targets of 26,500+ based on historical correlation patterns. This pair move confirms the strength of the rally.
DJIA (US30/Dow Jones) - Correlation: +0.89
The Dow Jones is your large-cap indicator. These are the blue-chip stocks. At 47,955, the Dow tends to lag SPX on rallies but confirms the trend strength. If Dow is not participating in SPX strength, it signals rotation OUT of mega-caps into mid-caps. Watch for this divergence as a warning signal.
Russell 2000 (RUT) - Correlation: +0.78
Small-cap participation is crucial. A weak Russell 2000 during SPX strength means only mega-caps are rallying. This is a RED FLAG for sustainability. If Russell is strong with SPX, the rally is broad-based and likely to continue. If Russell is weak, we're in a narrow rally that can reverse quickly.
Inverse Correlation (Risk Hedge) 🛡️
VIX (Volatility Index) - Correlation: -0.85
Currently at 15.41, this low volatility reading screams "risk-on" environment. Traders are comfortable, fear is low. But remember, VIX can spike suddenly. If VIX jumps above 20, consider taking profits and reducing exposure. A VIX spike signals institutional selling and risk-off sentiment.
US DOLLAR (DXY) - Correlation: -0.72
Trading at 98.97, a weak dollar SUPPORTS equities because US companies make more money when the dollar is weak (exports become cheaper). If the dollar strengthens suddenly, expect SPX pressure. Monitor Fed policy announcements that impact currency valuations - they directly impact your equity trades!
Sector Rotations to Track 💼
Tech Giants Matter:
NVIDIA (NVDA) at $182.41 is down -0.53% but still critical. This is THE stock to watch. If NVDA collapses, the entire rally is in question. NVIDIA is your AI barometer.
Meta Platforms (META) at $673.42 is up +1.80% and showing strength. This mega-cap strength confirms institutional confidence in the rally. When META leads, the market is feeling risk-on.
Microsoft (MSFT) at $483.16 is stable at +0.48%. This is your stability indicator. If MSFT can't go higher with SPX, it's a divergence warning.
Apple (AAPL) should be monitored for consumer health signals. Any weakness in AAPL suggests consumer spending concerns ahead.
🔍 TECHNICAL CONFIRMATION CHECKLIST
✅ Daily Chart: STRONG BUY - Moving Averages perfectly aligned in uptrend
✅ Weekly Chart: STRONG BUY - Macro uptrend completely intact, higher lows confirmed
✅ RSI: Not Yet Overbought - Means room to run before pullback expected
✅ MACD: Bullish Crossover Confirmed - Momentum indicator flashing green light
✅ Volume Profile: Good Distribution - Buying happening at higher price levels, not just sharp spikes
✅ Sentiment: Institutional Buying - Big money is flowing into SPX, not retail FOMO
This checklist confirms the setup is solid for the bullish premise. All signals are aligned, which means the probability is in your favor.
⚡ TRADER RULES & DISCLAIMERS
🎯 Golden Rules for This Trade:
Rule 1 - Only Risk What You Can Afford to Lose 💰
Don't use your rent money. Don't risk your emergency fund. Only trade capital that won't hurt your life if you lose it. This removes emotion from decision-making.
Rule 2 - Respect Your Stop Loss
No exceptions. Ever. A stop loss is not a suggestion - it's your insurance policy. Hit it and move on without hesitation. The traders who don't respect stops are the traders who blow up their accounts.
Rule 3 - Scale In and Out
Don't FOMO all-in on one entry. Build positions gradually with the three layers. Exit gradually with the three targets. This removes emotion and improves results dramatically.
Rule 4 - Lock Profits Before Pullbacks
Let winners run but protect gains. Your first 30% profit at 6,900 is EARNED. Take it. You only regret profits you didn't take.
Rule 5 - Track Correlations
Watch related pairs for divergence. If SPX goes up but NASDAQ goes down, something is wrong. Exit first, ask questions later.
Rule 6 - Use Alerts - Don't Stare at Screens 24/7
Set price alerts on TradingView. Let technology do the work. You have a life outside trading. Check alerts a few times per day.
Important Notices ⚠️
📋 This is TECHNICAL ANALYSIS ONLY - Not financial advice
🔒 NOT a recommendation to buy or sell
💡 Use this framework with YOUR OWN analysis - Don't blindly follow
🎓 Paper trade first if you're testing this strategy - Practice before risking real money
📊 Past performance ≠ Future results - Markets change constantly
💪 TRADER PSYCHOLOGY EDGE
Set your entries BEFORE market opens. Don't make emotional decisions when the market is moving fast. Your exit plan matters more than your entry plan. Where you exit determines your profit, not where you enter. Profits are made on discipline, not on aggression. The patient traders dominate the impatient ones.
One good trade beats ten desperate ones. Never try to "make back" losses with revenge trading. The best traders know when to step away from the market and recharge their minds.
🚀 ENGAGEMENT BOOSTERS FOR LIKES & VIEWS
If This Resonates:
👍 Like if you trade US500 index regularly
💬 Comment your entry price and targets
⭐ Bookmark this for your personal watchlist
🔔 Follow for daily swing trade setups and analysis
Share Your Thoughts:
"What's YOUR target on SPX? Comment below! 👇 Are you taking this trade or waiting for confirmation?"
"Have you tried the layered entry method? Tell me your experience in the comments!"

SPX Analysis (12H)As shown on the chart, the SPX structure is bearish because we have bearish CH (Change of Character) and BOS (Break of Structure).
Based on the fractals indicated with dashed lines and the drawn rectangles, we should expect one more bearish leg in this timeframe.
We are looking for sell/short positions around the swap zone.
The targets have been marked on the chart.
A daily candle closing above the invalidation level will invalidate this analysis.
Do not enter the position without capital management and stop setting
Comment if you have any questions
thank you

SPX — a new ATH is coming very soon.The market has just formed a clean initial impulse and broke out of the descending Andrews pitchfork , which tells us one thing: the correction is about done. (I previously expected a triangle as a possible correction, but the structure is now clear.)
From here, the next step is simple — a new all-time high.
Targets: I’m focused on the 127.2% and 161.8% Fibonacci extensions of the correction.
Trading plan: I’m waiting for a local 3-wave pullback — and only then I’ll enter on the breakout. Entering “just because it dipped” — ❌ never an option.

S&P 500 Index Showing Weakness – Correction Ahead?Over the past seven days, the S&P 500 index( SP:SPX ) has been on a bullish run, frequently hitting new all-time highs. However, in the last two or three weeks, it's been influenced by the ongoing tariff tensions between the U.S. and China .
Let's look at the latest news about the S&P 500 index :
The IMF has flagged that market valuations might be a bit high, hinting at possible corrections. Plus, there's been a fresh look at how well China’s sticking to the 2020 trade deal, and on top of that, a new trade agreement in Southeast Asia is in the mix. So that’s the quick rundown!
Right now, if we look at the S&P 500 on a 1-hour timeframe, the index is near its Resistance lines and has lost its uptrend line , which is a sign of weakening momentum .
We also saw a Shooting Star Candlestick pattern form in the last few hours with good volume, adding credibility to the potential for a pullback .
From an Elliott Wave standpoint, it seems the S&P 500 has completed its wave 3, and we might see a wave 4 correction in the coming hours or days.
There's a noticeable Negative Regular Divergence(RD-) between the recent tops , and even on the daily timeframe, there's a divergence signaling potential weakness.
I expect the S&P 500 could drop at least to its Support line , around the $6,857 .
Note: The cryptocurrency market, and especially Bitcoin , has been highly correlated with the S&P 500 index these weeks, and a possible correction in this index could lead to a correction in this market.
Please respect each other's ideas and express them politely if you agree or disagree.
S&P 500 Index Analyze (SPX500USD), 1-hour time frame.
Be sure to follow the updated ideas.
Do not forget to put a Stop loss for your positions (For every position you want to open).
Please follow your strategy and updates; this is just my Idea, and I will gladly see your ideas in this post.
Please do not forget the ✅' like'✅ button 🙏😊 & Share it with your friends; thanks, and Trade safe.

S&P 500 Index Near Key Resistance – Correction Ahead?Recently, the S&P 500 ( SP:SPX ) has seen some sharp moves with high momentum due to the tariff tensions between the US and China over the past couple of weeks. These moves have also impacted other correlated markets like cryptocurrency .
In the past day, news came out that Trump is planning to meet the Chinese president on October 31st . With markets opening, the S&P 500 started to rise and is currently moving near a Resistance zone($6,734_$6,690) and close to its Resistance lines .
From an Elliott Wave perspective, it seems that the S&P 500 is completing a microwave 5 of the main wave C , and the corrective structure looks like an Regular Flat(ABC/3-3-5) .
I expect that in the coming hours, the S&P 500 index could drop at least to around $6,641(First Target) .
Second Target: $6,611
Stop Loss(SL): $6,735
Note: The $6,641 level is quite important in the context of the recent rally and could act as both support and resistance for the S&P 500.
A possible decline or fall in the S&P 500 index could also cause Bitcoin to decline (due to Bitcoin's high correlation with the S&P 500 index in recent weeks).
Please respect each other's ideas and express them politely if you agree or disagree.
S&P 500 Index Analyze (SPX500USD), 1-hour time frame.
Be sure to follow the updated ideas.
Do not forget to put a Stop loss for your positions (For every position you want to open).
Please follow your strategy and updates; this is just my Idea, and I will gladly see your ideas in this post.
Please do not forget the ✅' like '✅ button 🙏😊 & Share it with your friends; thanks, and Trade safe.

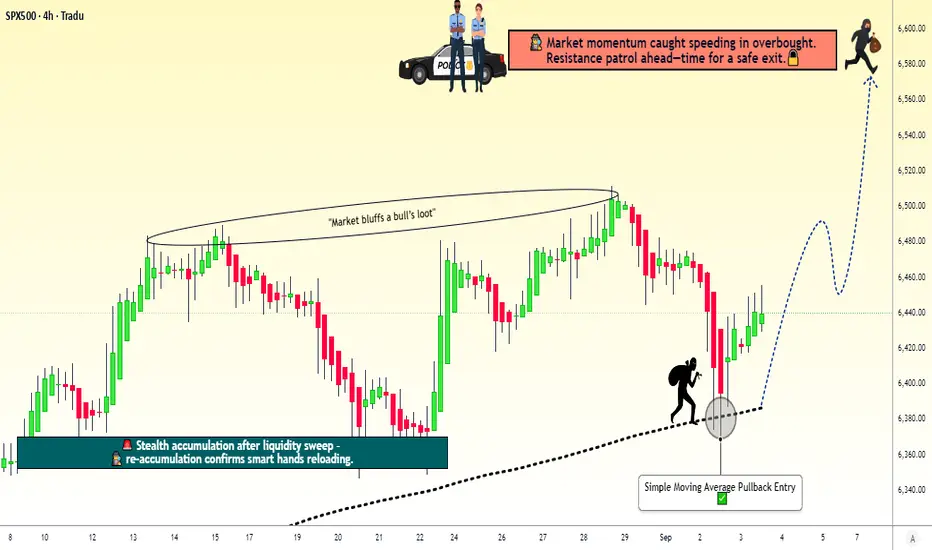
SPX500 Index – Ready for the Next Pullback Heist Move?🚨 SPX500 / US500 Index – The Money Heist Swing Plan 🎭💰
📊 Plan Overview
Bias: Bullish 200-SMA Pullback Plan @ 6380.00
Entry Strategy (Layering Style):
Thief strategy = multiple buy limit orders stacked like layers 🎯
6400.00 ✅
6410.00 ✅
6420.00 ✅
6440.00 ✅
(You can increase or adjust the layering based on your own style and risk tolerance.)
🛡️ Stop Loss (Thief SL)
SL: 6360.00 ⚠️
Dear Ladies & Gentlemen (Thief OG’s), adjust your SL to fit your risk style. This is just the plan’s guardrail.
🎯 Target / Exit
Target Zone: 6580.00 🚀
Note: This is the “Police Resistance” 🛑 – an overbought + trap zone. Escape with the stolen money 🎭💰 before getting caught.
Reminder: Not financial advice. You decide where to take profits.
🤔 Why This Plan?
🔹 200 SMA Pullback Logic: Price retraced into moving average = classic thief-style entry.
🔹 Layering Strategy Advantage: Building positions gradually improves average entry price & reduces risk.
🔹 Momentum & Sentiment: Neutral Fear & Greed Index (53/100) 😐 and low volatility (VIX 16.9) = stable environment for pullback entries.
🔹 Market Strength: US500 is up +16.81% YTD 🚀 with strong sector support (Alphabet +8.57%, Macy’s +19%).
🔹 Risk Factor: Economic data shows weakness (job openings & factory orders ↓), but bulls remain in control = reason for cautious layering.
🔹 Overall Outlook: Bullish score 65/100 ✅ → Mildly bullish bias fits perfectly with a buy-the-dip pullback strategy.
🔹 Trap Zone Awareness: Plan exits near resistance at 6580.00 to avoid overbought trap — thieves always escape before alarms go off 🚨.
📊 US500 INDEX CFD Real-Time Data (September 03)
Daily Change: +0.51% ↗️
Monthly Performance: +1.87% ↗️
Yearly Performance: +16.81% 🚀
All-Time High: 6,510.93 (August 2025)
😰😊 Investor Sentiment: Fear & Greed Index
Current Reading: 53/100 (Neutral) 😐
Trend: Balanced sentiment with no extreme fear or greed.
Key Indicators:
Market Momentum: S&P 500 above 125-day moving average (positive momentum) ↗️
Volatility (VIX): Low volatility (16.90), indicating stability 🟢
Options Activity: Put/Call ratio stable (no significant fear)
Junk Bond Demand: Moderate risk appetite
Safe Haven Demand: Bonds underperforming stocks (greed signal)
📈 Fundamental & Macro Score
Market Breadth: Moderate (balanced volume) ⚖️
Economic Data:
Job openings lowest since Sept (weakness) 🔻
Factory orders down -1.3% 🔻
Friday’s jobs report = critical ⚠️
Sector Performance:
Communication services (Alphabet +8.57%) 🟢
Consumer discretionary (Macy’s +19%) 🟢
Energy sector weak (Exxon Mobil -2.08%) 🔻
🐂🐻 Overall Market Outlook
Bullish Score: 65/100 (Mildly Bullish) ✅
Reasons:
Strong yearly gains (+16.81%)
Low volatility & neutral sentiment support stability
Tech & communication sectors leading momentum
Risks:
Weakening job & factory data
High valuations near ATH
💡 Key Takeaways
US500 trending upward with neutral short-term sentiment.
Friday’s jobs report = key catalyst.
Sector rotation in play: tech strong, energy weak.
Balanced fear/greed supports controlled bullish setups.
📌 Related Pairs to Watch
FOREXCOM:SPX500
CAPITALCOM:US500
TVC:DJI
NASDAQ:NDX
TVC:VIX (for risk gauge)
✨ “If you find value in my analysis, a 👍 and 🚀 boost is much appreciated — it helps me share more setups with the community!”
#SPX500 #US500 #IndexTrading #SwingTrade #LayeredEntry #SMAPullback #TradingPlan #StockMarket #SP500 #InvestorSentiment #FearGreed
Spx500 usdGetting some pips before spx going up again,
This is my bet in the meanwhile,
Dyor always.

SHORT ON SPX/USDSpy has created a Double top followed by a CHOC and retest to the downside.
Their is plenty sell side liquidity to be collected as I expect a major drop on spy.
Looking to catch 300-400 points on SPY.

SPX6900 Bulls Eyeing 33% Surge Toward Explosive $2.60 TargetHello✌
Let’s analyze SPX6900’s upcoming price potential 📈.
MEXC:SPXUSDT has maintained strong bullish momentum in recent weeks, supported by a stream of positive fundamentals 📈. The price is currently holding within an ascending channel and resting near daily support. If this level holds, a 33% upside toward the $2.60 target could follow 🚀
✨We put love into every post!
Your support inspires us 💛 Drop a comment we’d love to hear from you! Thanks , Mad Whale

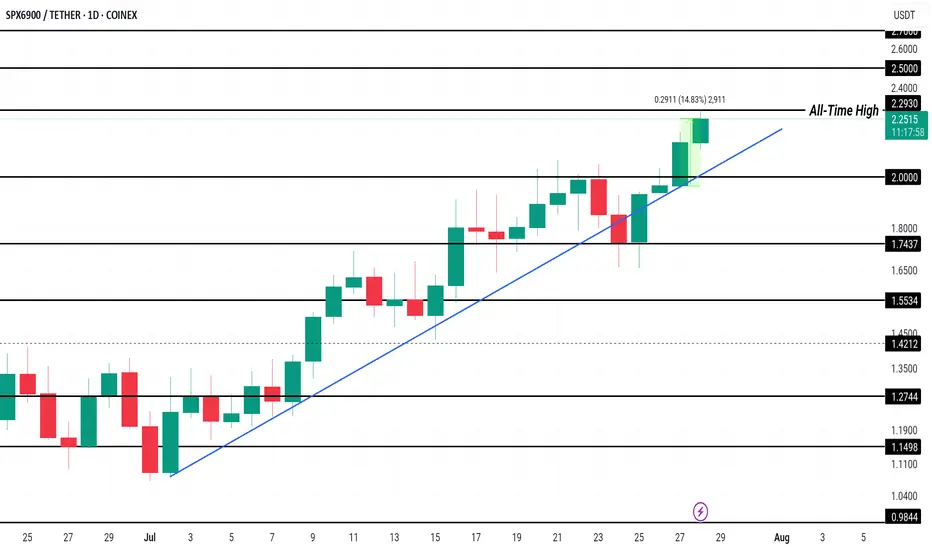
SPX Price Hits New All-Time High, $2.50 Up NextCOINEX:SPXUSDT has been experiencing a consistent uptrend since the beginning of the month, leading to the formation of multiple all-time highs, including one today at $2.27 . This price action reflects strong investor interest, pushing the altcoin to new levels and generating a positive market sentiment.
Currently trading at $2.23, COINEX:SPXUSDT has gained 14% in the past 24 hours . The Ichimoku Cloud, acting as support, signals bullish momentum. This suggests that SPX could rise further, with the potential to reach $2.50 or higher if market conditions remain favorable and investor confidence persists.
However, if selling pressure intensifies, COINEX:SPXUSDT could experience a reversal . A dip below the $2.00 support could push the altcoin toward $1.74 or lower, invalidating the bullish outlook.
SPXUSDT Forms Classic Cup and HandleSPXUSDT daily chart is showcasing a strong Cup and Handle breakout with high volume, a classic bullish continuation pattern. After a well-formed, rounded base, price has cleanly broken above the neckline resistance around the $1.80 level, supported by strong momentum and a sharp bullish candle. This breakout signals the potential for a significant upside move, with the next leg likely to push toward much higher price levels.
SP:SPX MEXC:SPXUSDT
SPXUSDT Approaching Breakout Zone – 20% Potential Move?SPXUSDT is gearing up for a potential breakout after consolidating in an ascending triangle. Price is once again testing the key horizontal resistance at $1.38, which has held for several days.
Structure:
Ascending triangle on the 4H timeframe – typically bullish
Multiple rejections at the $1.38 level indicate a strong breakout if flipped
RSI is around 63, signaling growing momentum
Trade Setup (If Breakout Confirms):
Entry: Candle closes above $1.38 resistance
Stop Loss: Below $1.3422 support zone
Targets:
$1.4753
$1.5679
$1.7019
Potential upside of ~20% if momentum holds.
Support & Resistance:
Immediate Support: $1.3422 & $1.2962
Major Resistance: $1.38 → $1.4753 → $1.5679 → $1.7019
A breakout from this structure can trigger a strong bullish move. Watch for confirmation and volume.
DYOR. Not financial advice.

SHORT ON SPY (SPX/USD)SPY has a double top and is currently pulling back to a supply zone.
I expect spy to drop to the next demand level or FVG to the downside.
This is a sell limit order. Waiting for price to reach the supply area before taking the sell.

SHORT ON SPY (SPX/USD)SPY has failed to create higher highs and given us a head and shoulders pattern.
I will be selling spy to the next level of demand looking to catch 50-60 points.

SHORT ON SPY (SPX/USD)Spy has given us bearish divergence at a major supply zone.
I will be selling spy to the next support level.
Today is FOMC and I expecting it to influence spy move to the downside.

SHORT ON SPYNice Double Top at a Major supply zone on spy.
I will be selling spy to the next demand zone for almost 900 points. (INSANE)

spx500 bearish movewith the push to the upside in the 1hr crossing a previous resistance. using fib retracement getting in on this analysis

SPXUSDT is perhaps one of the best short term crypto investmentsSPXUSDT is having an enormous day so far that is about to test its All Time High.
The rebound is taking place after the 1day MA50 was tested and held, right at the bottom of the Channel Up.
Ahead of a 1day MACD Bullish Cross, this is a strong technical buy entry for the short term.
You can target the top of the Channel Up at 9.000, which would be a +9.38% rise, symmetrical with the coin's first.
Follow us, like the idea and leave a comment below!!

SPX Sell/Short Setup (2H)Hi, dear traders. how are you ? Today we have a viewpoint to Sell/Short the SPX symbol.
Considering the bearish mCH on the chart and the formation of an order block, we can look for sell/short positions within the red zone.
For risk management, please don't forget stop loss and capital management
When we reach the first target, save some profit and then change the stop to entry
Comment if you have any questions
Thank You

S&P 500: Long Trade Targets AheadS&P 500 Trade Details:
The S&P 500 (SPX) on the 15-minute timeframe confirms a bullish breakout according to the Risological trading indicator . Target 1 (TP1) has been successfully hit, with higher targets in sight, as the bullish momentum sustains.
S&P 500 Key Levels:
Entry: 5889.16
Stop Loss (SL): 5872.22
S&P 500 Take Profit Targets:
TP1: 5910.09 ✅
TP2: 5943.96
TP3: 5977.82
TP4: 5998.75
Analysis:
The price action indicates strong upward momentum with consecutive bullish candles. The moving averages align to support the trend. Short-term resistance at higher targets may see consolidation before further upward movement.
Outlook:
With TP1 hit, the trade looks promising to reach TP2 and beyond. Keep monitoring momentum strength and secure profits as each level is achieved. Stay cautious of reversals near key resistance zones.

Gigachad is about to giga sendMurads top 2 picks, SPX6900 and Giga have been shitting the bed the past 2 weeks while BTC, Raydium, SUI and the entire solana ecosystem rip.
Got a feeling.. GIGA and SPX6900 are about to melt faces.. Murad isn't wrong.
He's having his Michael Burry moment..
All of a sudden Alex Becker has shifted from shilling 40m mcap game coins to posting Giga Chad memes..
There is a flood coming.. position accordingly.

SPX500 Breakout ?Pair : SPX500 Index
Description :
Rising Wedge as an Corrective Pattern in Short Time Frame with the Breakout of Lower Trend Line. Break of Structure and Retracement. According to Elliot Waves it has completed " 12345 " Impulsive Waves. Rejecting from Strong Resistance Level
