SPX possible pathway to min 3720 and ideal 3450!I want to present a very possible pathway in case MACD will make a hook like turn, which is very bearish!
I saw this many times, when everyone is cheering bullish and looking for that golden cross and all they get is a the hook formation (zoomed in and outlined at the bottom of the chart)
So far MACD is still way below 0, RSI is at 50 level and could make a lower high.
We have touched 50% today and one more push to 4150 zone for 61.8 (see the retracement fibs on the chart) is what I would expect to hold for that MACD hook formation.
- 4090 is the support now,
- 4125-35, 4145 and 4160 resistance
So stay alert, have stops if trading on the long side!
BTW all the pink lines are the unfilled gaps
P.S. Dont forget to like (click star-ship button) my posts, so it gets pushed up on TV for others to see as well.
Thanks in advance!
SPXUSD

SPX Daily TA Cautiously BullishSPXUSD Daily cautiously bullish. Recommended ratio: 70% SPX, 30% Cash.
*Equities Futures, Precious Metals, EURUSD and Cryptos are up slightly while DXY and US Treasuries are down before market open this week. All eyes will be on August CPI this Tuesday, if it comes in at consensus (8.1%) or lower, markets will likely rally in the near term; however, in the event that CPI surprises to the upside, it's reasonable to expect a reactionary sell-off. Key Upcoming Dates: August CPI at 830am EST 09/13; The Merge (Ethereum) at ~8pm EST 09/14; US August Retail Sales at 830am EST 09/15; UofM Consumer Sentiment Index at 10am EST 09/16; FOMC meeting 09/20-09/21 (Statement Released at 2pm EST on 09/21).*
Price is currently trending up at $4067 as it attempts to break above the 50 MA at ~$4030; the next resistance is at $4175. Volume remains Moderate (high) and has favored buyers in the last three sessions. Parabolic SAR flips bearish at $3890, this margin is neutral at the moment. RSI is currently trending up at 51 as it approaches a retest of 52.68 resistance. Stochastic remains bullish and is currently testing 48 resistance with no signs of peak formation, the next resistance is at 76. MACD remains bearish and is currently trending up slightly at -30 as it attempts to form a bullish crossover by getting above ~-15.50 (which coincides with -11 resistance). ADX is currently trending down at 20 as Price is pushing higher, this is mildly bearish at the moment.
If Price is able to flip 50 MA resistance to support at ~$4030 then the next likely target is a retest of $4175 resistance . However, if Price breaks back down below the 50 MA at ~$4030, it will likely retest $3938 minor support . Mental Stop Loss: (two consecutive closes below) $4030.

SPX gapped up, no Fri sell off repeate, main support is at 4025We didnt get a move down off am highs as I was hoping for, gap up above 4020-35 happen, so the move lower is off the table.
Now 4025 and 4015 are 2 main supports to hold for next week to continue advance. 4085 is next target.
This still can be a fakeout and if we close below am open, and especially below 4015SPX it will be bearish and I will be looking for 3925 to test early next week before push to higher levels.
I got stopped on half short from overnight and holding the other half for the fakeout scenario.
Will hedge at 4025 and 4015 level (will cut if we close below 4015)
So far the pathway up is in play, I dont expect much lower till 4125-35 test and ideally 4200
P.S. Dont forget to like my posts, so it gets pushed up on TV for others to see as well.
Thanks in advance!

SPX weekly closing day - Fri updateHi everyone!
Im still battling with timing on the high and potential crash this/next month.
We either bottom this month, we have interest rate decision on the 21st and then up into Oct 3rd week where the turn suppose to happen and last into EOM or even Nov.
My timing showing a low in Oct/Nov.
There is a chance for us to see 4425! but the lows we just had must hold, then that high will be early Oct.
But there are several supper strong resistances to overtake:
- 4085
- 4125-35
- 4308
- 4385SPX
My fib calculation as well as previous calculations support this possible pathway, then the Oct/Nov low will be in 3240SPX zone!!!
- There is also a 61.8 retracement at 3195SPX off 2020 Mar lows!
- This move up will be a perfect C wave up of the bigger B wave in case we made A high in Aug (I have this pathway outlined in green count)
My main count is still to hold 4125-35 and ideally stretch to 4200SPX before serious selling into EOM.
- I have Panic month on Oct in SPX and Sep for the DOW. Interesting thing is SPX had a panic month on Sep as well, but cycles have moved it to Oct now.
But I want to be open for a potential screw up of the bears and making the bulls believe we are on the pathway to ATHs (again). That alone will screw up so many!
Ideally we make a higher monthly close in Sep and intraday high early Oct, then the cycles will match with the turn in Oct where we can have a huge sell into MidTerms.
- Then we should rally into EOY to do a damage control and top out in Jan. Im still battling about Santa Rally as this year is completely different from others.
- Also energy and food crisis in Europe might put a lot of pressure into the markets, unless there is a bigger war erupted and the European money will flow into the US. Which I do expect to happen next year or 2024...
So lets talk about tomorrow, so I can go to sleep:
Today's close was into the wall with last 10 min pump, that usually ends up in following day being red, at least first part of it. Also closed below intraday highs = not bullish.
- Needs a gap up above 4020 (and ideally 4030) or we should see lower levels tomorrow.
Im short into tomorrow from the close and some from AHs highs, half position.
Last few weeks we dump big on Friday's, will it repeat tomorrow? My bet is yes.
Tomorrow is a turning day!
Ideally we see a higher low tomorrow and reverse hard into last hour or 2 of the day and never look back, that would setup a move for much higher next week
Its VIX OPEX on Wed, triple witching week
200MA here on 4h chart is the ideal target for this move!
- Or 4125-35 and ideal at 4200+ for the top of this move this month
Tomorrow resistance is at:
- first resistance 4020SPX
- Main resistance to take 40350SPX
- 4085SPX is the closing resistance for higher levels early next week
The only real support I have now is low 3800 cluster, if we test 3885-3900 again it will slice it imo.
So lets see if they can push it up and save the day before and at least the OPEX and the interest rate decision on the 21st.
Have a good night!
P.S. Dont forget to like my posts, so it gets pushed up on TV for others to see as well.
Thanks in advance!

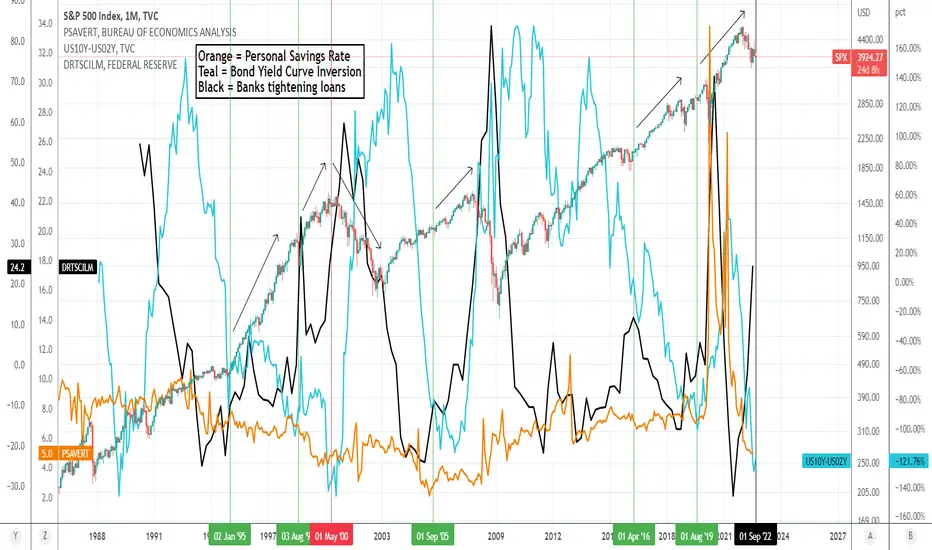
S&P500 These market dynamics show we're not in a Bear Market yetThis is a cross asset technical analysis on the S&P500 Index (SPX) on the 1M (monthly) time-frame. The symbols included are the Personal Savings Rate (orange trend-line), the Yield Curve Inversion (teal trend-line) and the % of Domestic Banks tightening (black trend-line).
** Personal Savings **
A little background info on what each symbol means. The Personal Savings Rate is the income left over after people spend money and pay taxes. In other words, it is the percentage of the disposable income that people save.
** Yield Curve Inversion **
The Bond Yield Curve Inversion is when the US02Y turns at a higher rate than the US10Y and the curve inversion occurs. The shorter term US02Y is associated with short-term Fed policy while the US10Y takes into account the longer-term growth aspects of the economy. When the curve is inverted it essentially tells us that the bond market expects the Fed to tighten too much relative to the growth. Practically when it bottoms and starts rising, it is an indication that the economy might be headed towards a recession.
** Domestic Banks tightening **
That shows the net percentage of domestic banks tightening standards for commercial and industrial loans to large and medium sized firms. This is also an economic growth indicator.
** Today's picture **
So basically what this chart shows is that since 1990, there have only been another 6 occasions of the above indicators forming the pattern we see today. That is a low Personal Savings Rate, Yield Rate Low and Bank tightening rising aggressively.
- The first was during January 1995 and that was half-way through the 1990s rally that led to the 2000 DotCom Crash.
- Second was in August 1998 , two years before the market top.
- Third was in May 2000 at the peak of the DotCom Bubble.
- Fourth was in September 2005 , half-way through the rally that led to the 2007/08 Housing Crash.
- Fifth was in April 2016 , half-way through the incredible Bull Cycle we are at since the 2009 bottom and after the volatile months of the 2015 Grexit, China slowdown and 2016 Oil crisis.
- Sixth was in August 2019 , right after the market had recovered from the U.S.-China trade war.
The common characteristic on all the above phases besides the the (third) 2000 peak, was that SPX was under heavy volatility, having sizeable pull-backs. Given that we already had a correction since Jan 2022 of almost 25%, this historical dataset shows that it is currently more likely that this pull-back is either in the middle or 2 years before a major recession.
Of course recessions can't be predicted with 100% accuracy and as long as central banks are accommodative, Bull Cycles can be maintained, but this dataset is a fair guideline to where the stock market might be at relative to its Cycle stages.
Do you think this was a much needed correction and the market will resume its multi-year Bull Cycle or we are at the first stages of a Recession?
--------------------------------------------------------------------------------------------------------
** Please support this idea with your likes and comments, it is the best way to keep it relevant and support me. **
--------------------------------------------------------------------------------------------------------
SPX Daily TA Cautiously BearishSPXUSD Daily cautiously bearish. Recommended ratio: 25% SPX, 75% Cash.
*Equities, Equity Futures and Gold are all slightly down to start the week while Cryptos, VIX, Energy and US Treasuries are up and DXY has stayed relatively flat. The Risk-Off reaction to Jerome Powell's hawkish comments in Jackson Hole last Friday is continuing into the start of this week. Financial markets will likely stay choppy leading up to the Jobs Report on on September 2nd and CPI on September 13th; both of these data points will provide guidance regarding whether the Fed will increase FFR by 50bps or 75bps on September 21st. Meanwhile Europe is facing what is likely to be a cold winter marked by energy rations and high prices, this is something to keep an eye on as it has the potential to exacerbate global recession fears. Key Upcoming Dates: August Consumer Confidence Index at 10am EST 08/30 ; 9th GDPNow US Q3 GDP estimate at 10am EST 09/01; August Employment Situation 830am EST 09/02.*
Price is currently trending down at ~$4050 after breaking below the uptrend line from 06/16/22 at ~$4145, it's fast approaching a retest of the 50 MA at ~$4k as support. Volume remains Moderate (high) and is on track to favor buyers in today's session, after favoring sellers in last Friday's, if it can close today's session in the green. Parabolic SAR flips bullish at $4254 minor resistance, this margin is neutral at the moment. RSI continues to trend down at 43 as it approaches a retest of the uptrend line from 01/27/22 at 38 support. Stochastic is currently neutral and trending sideways at 10, the next resistance is at 18 and the next support at max bottom. MACD remains bearish and is currently trending down at 23 with no signs of trough formation as it still technically is testing 33 support. ADX is currently beginning to form a trough at 23 as Price continues to fall, this is neutral at the moment.
If Price is able to bounce here then it will likely see a bit of resistance at $4100 before it aims to retest $4175 resistance . However, if Price continues to fall here, it will likely retest the 50 MA at ~$4k psychological support and potentially lower to retest $3938 minor support . Mental Stop Loss: (two consecutive closes above) $4100.

Spx may fill the gap and crap This is what I see on the chart, make it an additional idea to yours ideas

S&P500 seeking two Support levels for the next leg upwards.The S&P500 Index (SPX) had a perfect rejection on the 1D MA200 (orange trend-line), exactly after our analysis last week:
As you see, the rejection was not just on the 1D MA200 but also on the January 04 Lower Highs trend-line, essentially the Lower Highs trend-line starting from the All Time High (ATH). As we mentioned on that previous analysis, the rejection took place once the 1D RSI broke into the Overbought Territory. We made a good case that in the recent past however, such RSI overbought breaks, have proved to be only short-term index price rejections and technical pull-backs mostly attributed to profit taking.
To be more precise, since 2019 such rejections on overbought 1D RSI levels have resulted into 1D MA50 (blue trend-line) tests 5 times, 1D MA100 (green trend-line) tests 1 time and 1D MA200 tests 2 times (but when price action was much more flat and of course we were not into such a high inflation correction). Scroll the chart to the left to see those. Currently the 1D MA100 is trading towards the 0.382 Fibonacci retracement level from the Aug 16 High, while the 1D MA50 on the 0.5 Fib. If this is indeed the first rally of a new long-term Bull Phase, those are the Support levels to consider.
But if the pattern since the ATH is a Bearish Megaphone, what gives the impression that it may be the first rally into a new Bull Phase? Well as you see on the snapshot below, the MACD on the 1W time-frame rose after a huge Bullish Cross, the first since November 05 2021. Also the 1W RSI broke above its Nov 19 2021 Lower Highs trend-line and made a high above the previous Lower High of April 01.
In the event of a 1D MA200 break-out, we would ideally like to see a break above the 0.618 Fib (from the January 04 ATH), as this is the Golden Ratio.
Also keep an eye on the RSI symmetrical Support Zone after Overbought rejections, for clues on where the price may rebound. We already broke inside it.
--------------------------------------------------------------------------------------------------------
** Please support this idea with your likes and comments, it is the best way to keep it relevant and support me. **
--------------------------------------------------------------------------------------------------------


SPX is in the target and maj resistance zoneNothing much to add since my most recent updates.
The price is in the target zone I had for a while now. Was expecting a good size pullback, never happened.
Im still in some trapped ES short, as well as RTY from Fri close and some SPY puts.
We got right into the Yellow dotted line I had for months now, its the main resistance line and right in our 4308SPX target zone.
Maj daily resistance is at 4308-35SPX
Maj support (and I expect it to hold) is at 4000-08SPX
Might stretch into 4930-50, but low 4k has higher chance in holding on the upcoming pullback.
As noted on the RTY chart, there is a chance we wont tag 200MA, too many are looking for one to get hit.
We should get some sort of pullback next week, how deep it will be, I dont know, but it can be quite fast.
Maj turn dates are the 16th and week of 29th, Im assuming that week will mark the high, might be lower high.
We have 9 unfilled gaps since Jun low, I expect those to get filled by Oct low.
Im expecting a double bottom or a marginal lower hit in to below 3450SPX zone before a good size rally into EOY.
Sep comes up as a panic month, I expect a good size reversal that month and it can get quite ugly in Oct.
I see some serious market movers Sep/Oct time, might stretch into Nov Midterm elections.
Those in power will do everything to rig it, so expect more international instability as well as something serious in the states.
Interesting and very dangerous times we live in.
Very important to gap down tomorrow to mark temp high.
Expect a counter trend next 2 weeks into week of 29th.
2 scenarios Im watching:
- top in main target zone of 4308-35SPX
- top at 4425SPX in case it wants to extend into mid of Sep

✅SNP500 WILL GO DOWN|SHORT🔥
✅SNP500 will soon retest a key resistance level
So I think that the pair will make a pullback
And go down to retest the demand level below
SHORT🔥
✅Like and subscribe to never miss a new idea!✅

SPXUSD BEARS ARE STRONG HERE|SHORT
Hello, Friends!
SPXUSD is trading In way
That I predicted previously
And now the pair is retesting
A hidden bank’s level
So I think a bearish move will follow!
SELL!
✅LIKE AND COMMENT MY IDEAS✅

S&P500 Key Level Analysis! Sell!
Hello,Traders!
S&P500 is trading in a downtrend
And we are seeing the index
Going up to retest a key horizontal level
Which makes me expect a pullback
And a move down from the level
Sell!
Like, comment and subscribe to boost your trading!
See other ideas below too!

S&P500Possible short , after a bos and pullback to th 1hr ob, & we also have support turned into Resistance on the level. Sl above ob and targeting the lows or 1hr ob

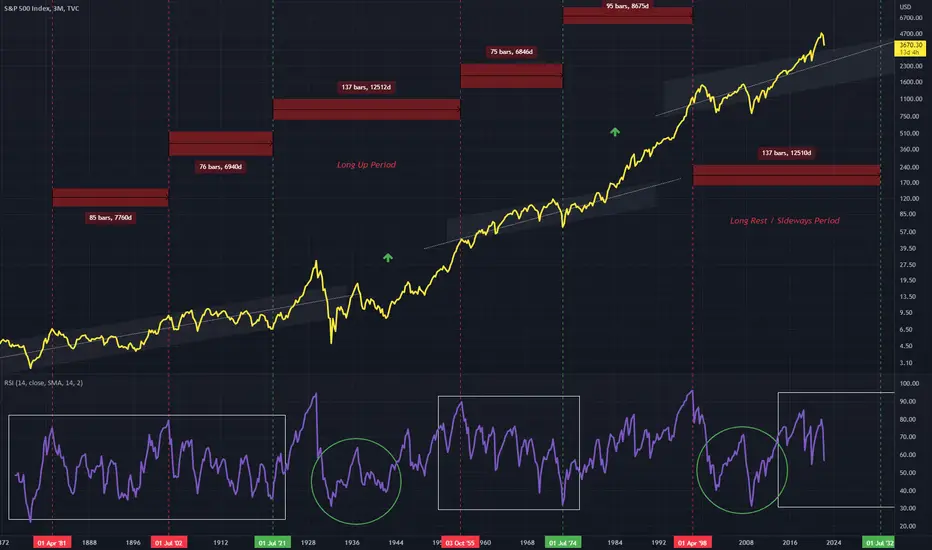
SPX - RSI Analysis Two periods can be observed on the RSI for SPX on this 3Monthly chart
A downward trend which correlates with a sideways move on the relative timeframe
And a small uptrend that correlates with sharper growth on the SPX, these begin within the green circle
These green circles show very comparative structures, however one is during an up period, while the current one is during a sideways trend period
Price will very likely continue through the up channel on this larger timeframe
SPX Long Term View 4300 becomes the main resistanceMy weekend update is a day early, I will update those who are on my list with a bit more details on shorter time frame view tomorrow.
We are in a bear market and those 5500 callers got destroyed all the way down calling every bottom from Jan.
This is my long term view and I think we have bottomed here today or super close to it!
I got targets for the potential bottom left, all SPX:
- 3643 (came super close to it today)
- 3688.50
- 3555
We clearly had 5 down or A completed on this move! Now the time for the B (still think this will be an ABC correction going into Mar of 2023)
My main target now is 4300, down from 4425. Extension target now is 4425-45 down from 4600
110MA (descending every day) becomes the main magnet for the move up to hit at least
I got 2 main targets to hit for the C, one in Oct/Nov of this year and next one is Mar of 2023.
Ideally we see the first target hit and then some sort of damage control move into the EOY close and finish up in to 2600 handle (2800 at min) in Q1 of 2023.
I was saying for a while now, that the whole move from 2020 will be erased this year, its getting supper close to it now!
That yellow dotted line is line in sand for the bears and bulls, break it above and test it from the top will make me change my view to the whole view and look higher.
Before it happens its the main line Im paying attention to now.
Have a nice day
P.S. next week should rally up and ideally we make a higher low end of the month before the window dressing rally

🚀🚀 S&P500 - LongThis idea i posted in my channel on Friday, i Entered at 4098 and hit my TP2 at 4167. I believe we could find another entry around this region.
Here is my analysis for S&P 500
SP:SPX
I have marked out step by step how i have come to find a long position on S&P500 .
Price has broken the previous LH and created a new HH which has BOS.
There is a key level of support around the area 4098 & has now broken the counter trendline and respected the 78.6 level.
Happy Trading Traders.

SPX500 LONGLooking for the Bullish continuation off the 61.8 FIB Retracement
Target should be a return to the ONH minimum 4189+

S&P500 First MACD Bullish Cross formed since March 15The S&P500 index (SPX) has been trading within a Channel Down ever since the January 04 2022 All Time High (ATH). Recently (May 20) it hit the Lower Low (bottom) trend-line of the Channel for the third time (Jan 24 and Feb 24 the others) and rebounded reaching the first Fibonacci extension (0.236 Fib).
Perhaps even more important than the dynamics that a rebound on the Lower Lows trend-line creates is the fact that the MACD on the 1D time-frame has just made yesterday a Bullish Cross. That is the 4th time within this pattern we see this pattern forming. All previous formation have kick-started rises (+8.90%, +7.50% and +12.00% respectively in chronological order).
As a result, a minimum of +7.50% rise would see the index hit roughly 4090 and the 0.5 Fib, while a maximum of +12.00% would get it to around 4275 and the 1D MA50 (blue trend-line). A break below the recent Lower Low though may be enough to push the price even lower to the 2.0 Fib extension around 3630.
--------------------------------------------------------------------------------------------------------
Please like, subscribe and share your ideas and charts with the community!
--------------------------------------------------------------------------------------------------------

SPX Planned Formation Update 5/23/22Right now we are experiencing the early stages of a big breakdown on the SPX
I say this based on the formation provided, which has even been produced on a smaller scale for observation on the SPX chart
A break down like this will be disastrous, but not the end of the world
The formation provides bottom points along the dot come bubble, 08 crisis and what is yet to come.
The Aptiv chart shows also a great representation of this within the Fibonacci circle, with a big extension (similar to that on SPX) leading to big downfalls to complete the broadening wedge pattern
I have made charts of this in the past please check them out
Above is the smaller formation VS the larger formation we can see on the Monthly timeframe
Above is the original post

SPX/USD Daily TA Cautiously BearishSPX/USD Daily cautiously bearish. *Amidst slowing economic growth and rising inflation Janet Yellen , Ben Bernanke and various economic pundits are vocalizing their concerns for prolonged stagflation in the short to medium term -- this and weak economic data from China (primarily due to lockdowns) is fueling broader fears of the Federal Reserve potentially not being able to execute a 'soft landing' like JPow wishes.* Recommended ratio: 30% SPX, 70% cash . Price was rejected by the lower trendline of the descending channel from July 2021 and is currently forming a Bearish Engulfing Candle as it retests $3938 minor support. Volume remains moderately high and is fairly balance between buyers and sellers in recent sessions but has favored sellers in seven of the past ten sessions. Parabolic SAR flips bullish at $4109, this margin is neutral at the moment. RSI is currently retesting 38.06 support; if it breaks below, the next support is at 16.67 (which would coincide with the uptrend line from 02/27/22). Stochastic remains bullish and is trending down at 49.43, if it breaks below 44.62 it would be a bearish crossover. MACD remains bearish and is currently trending down at -106 after failing its third attempt at a bullish crossover; if it can break above -100 it would be a bullish crossover, but if it can't the next support is the ATL at -236.13 (Covid crash in March 2020). ADX is trending sideways at 27 as Price is currently being rejected, this is mildly bearish; if ADX can continue trending up as Price falls then it would be very bearish. If Price is able to defend minor support at $3938 then it will likely consolidate before retesting the lower trendline of the descending channel from July 2021 at ~$4000. However, if Price breaks down here, it will likely test $3706 minor support before potentially falling to $3508 minor support. Mental Stop Loss: (two consecutive closes above) $4000.

SPX/USD Weekly TA Cautiously BearishSPX/USD Weekly cautiously bearish. * CPI continues to go up since April 2020 (and for some commodities like bread, milk and oranges since mid-2019), Finland and Sweden officially apply to join NATO , the Fed remains committed to increased funds rate to ring in inflation, mid-term elections in the USA are underway and Republicans currently have a slight lean , supply chains are still getting battered by Russia/Ukraine & China lockdowns -- the overarching theme for equities remains a return to true value.* Recommended ratio: 30% SPX, 70% cash. Price is currently testing $3950 minor support for the second consecutive week. Volume remains moderate and is on track to favor sellers for seven consecutive sessions. Parabolic SAR flips bullish at $4652. RSI is currently trending down slightly at 32 as it approaches 25.26 support ( which would coincide from the uptrend line from October 2008 ). Stochastic remains bearish and is currently trending sideways at max bottom; a break above 4 would lead to a bullish crossover. MACD remains bearish and is currently trending down at -104 with no signs of trough formation; the next support is the ATL at -125.20. ADX is currently trending up at 29 as Price continues to fall, this is bearish. If Price is able to defend $3950 minor support, the next likely target would be a test of $4167 minor resistance. However, if Price breaks down here then it will likely retest $3722 support for the first time since March 2021. Mental Stop Loss: (one close above) $4167.

SPX elliot wave analysisIt looks like the correction wave will continue can you guys see an alternative count?
