SHORT ON SPX/USDSpy has created a Double top followed by a CHOC and retest to the downside.
Their is plenty sell side liquidity to be collected as I expect a major drop on spy.
Looking to catch 300-400 points on SPY.
Spxusdshort

SHORT ON SPY (SPX/USD)SPY has a double top and is currently pulling back to a supply zone.
I expect spy to drop to the next demand level or FVG to the downside.
This is a sell limit order. Waiting for price to reach the supply area before taking the sell.

SHORT ON SPY (SPX/USD)SPY has failed to create higher highs and given us a head and shoulders pattern.
I will be selling spy to the next level of demand looking to catch 50-60 points.

SHORT ON SPYNice Double Top at a Major supply zone on spy.
I will be selling spy to the next demand zone for almost 900 points. (INSANE)

SPX did everything as per the plan, Where to now?I posted this chart just last week as part of my Major short setup going back weeks. Link to previous post in the description, please go through that setup to get the context.
This is going to be a short post, since everything is going as per the plan we just have to wait and watch, Price back to where I expect either a break below or bounce to continue higher.
So as per the plan If it's going to bounce now, I have highlighted two 30 mins demand zones. where I expect a bounce. Those two zones are also confluent with 0.786 and 0.886 fibs of the retracements.
Apart from this chart it pretty is self-explanatory.
Boost this post and leave me comment for any questions on this I'd be happy to explain.

Bing Short on SPX in progressIn my previous post on SPX ( link attached below the description ), I explained how we are going to see a rejection on this uptrend soon and we beginning to see that now.
In this post I will explain how I am playing this short setup.
In the previous post I had a pitchfork. I simplified it with three parallel channels, one larger and two inside it in its upper and lower half so we now have four rising trendlines which will be our point of interest when Price Gets there.
In the image below I have highlighted the properties of these trend lines based on past price action within the channel, which you can observe yourself.
I have indicated three take profit levels on the main chart. I don't think TP1 would be necessary as I don't expect the trendline to hold based on its past behavior.
TP2 and TP3 are my main targets, which is where I will look for signs of a nice bounce back up.
If you observe the channel, we have never really resumed a trend back up without creating a double bottom on the one of the lower two trendline in the chart as highlighted in the image below, if that happens, we resume the uptrend to new highs. That's when you take a swing long position on SPX.
On the other side if TP3 doesn't hold we are looking at a potential change of trend a macro scale, but I won't give up on the upside just after the break as we could possibly see deviation and bounce back in the channel after testing the support area as highlighted in the main chart.
What happens if we lose 4300 level, we go way down, I will leave that detailed analysis for another post.

Bing short on SPX.SPX along with other markets have been in a massive uptrend from past several weeks.
But we are about to see a potential change in trend.
On the chart you can see I have a pitchfork from the bottom, which has helped me a lot during this entire up trend, its levels have been respected very well.
But now we are about to hit the top of the pitchfork very soon, this calls for either a good rejection or a change of trend.
Along with the pitchfork we have a weekly harmonic pattern and SPX is hitting its prz. I have indicated the entry and Stop loss.
What I am watching is a weekly close either below the white line which will make a bearish engulfing week for SPX or even better a weekly close below the yellow line which result in change of trend.
Along with the pitchfork and the harmonic we also been in a trend of a green week followed by a red week from past 5 weeks, and I am expecting next week to be a red week.

SPX Swing Trade, History repeating (CPI incoming)The chart is self-explanatory, I have highlighted in the chart where we saw remarkably similar price action in the past.
I have identified two different structures in the chart, a parallel channel, and a disjoint channel. We are currently trading in the disjoint channel. A disjoint channel has expanding edges which have same slopes locked in opposite directions.
We entered the Current Disjoint channel from a parallel channel trending upwards which is exactly what happened in the past, the only difference is size of these channels, in past we had larger Parallel and disjoint channel compared to what we have now.
The small size of channels this time indicates reduced volatility overall, which if it happens at the end of an uptrend, means we are topping out.
Let's make some predictions based on this.
If we look at the current price action, it is forming a bull flag (highlighted in the chart) , I have also highlighted the measured move of the flag. If the flag plays out its measured move intersects directly into the top of the disjoint channel as well as the August high. Which I believe should be the top or close to it.
In case bull flag fails , and we first drop a bit then we can look at that the blue line, it is placed for 10th May CPI Day and if we move up on that day, we are still intersecting close to the August High and top of the disjoint channel.
Apart from the above structures we also have a harmonic structure with its PRZ falling right onto Aug high.
If you like my content then please boost and share this post. I have over 6 years of trading and investing experience and have learned a lot in this time. I like to share what I have learned. If you would like to learn from my experience then follow me on trading view to get notified on my trade, market projections and several upcoming technical analysis and in-depth tutorials on technical Indicators. You can also leave a comment and let me know if you want me to look at any specific asset or want to learn about any specific topic in the world of Technical Analysis. I Will do my best to create a post for it.
Keep learning and Happy trading All.

SPXUSD#SPXUSD Sell Trade setup now price on supply zone best trade for short term selling. Multiple time frame analysis.
Thank you..

SPXUSD - SELL When price under the white line - we can shortlt SELL TOP at price on chart as you can see

SPX/USD GOING SHORT ONCE PRICE RETEST THE ZONE AT 3845.0spx/usd had been in the trendline for quite sometimes , waiting for a retest on the price .

SPX/USD GOING SHORT ONCE PRICE RETEST THE ZONE AT 3867.1SPX/USD had been within the trend line for quite sometimes , currently waiting for to retest the pervious support zone and a strong rejection candle

What are your ideas?
TVC:SPX
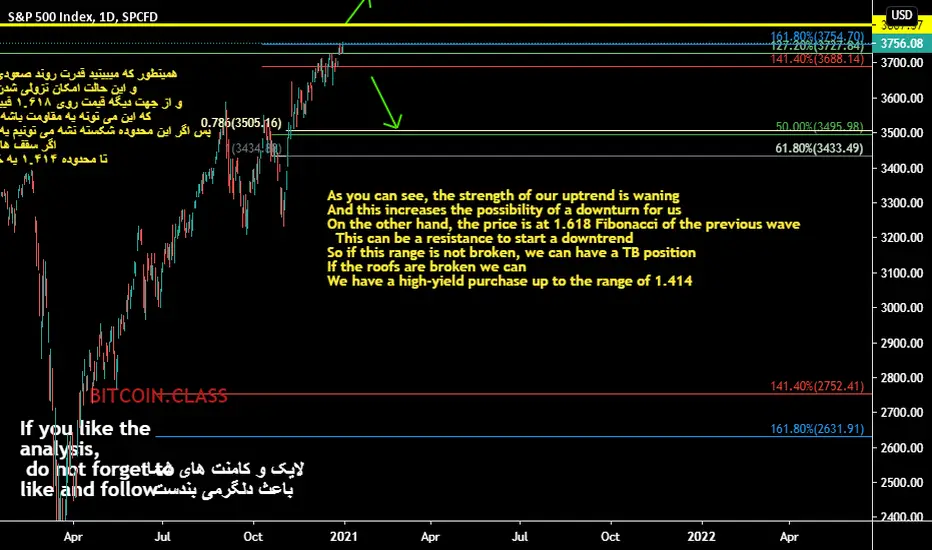
If you liked the analysis, follow me so that you can be informed of the analysis in the shortest possible time.
Support me with your likes and comments
SPXUSD SELL TP_2.798_18.92%_651.20pips_SL_3.490_1.42%_48.90pipsSPXUSD SELL TP_2.798_18.92%_651.20pips_SL_3.490_1.42%_48.90pips

SPX/USD Correction TimeHello World,
SP&500 currently is in decline mode, Red will come.
Trenline Support Broken.

SPXUSD short term outlook - Growing Bear Power SPXUSD showing strong signs of growing bear power and trend reversal on 1hr looks confirmed with 1hr support failing. Low risk short with a large upside in terms of reward.
Entry and Targets on chart (Generated by TrdeChartist premium scripts Plug and Trade using TrendRider on 1hr using Aggressive mode)
Stoploss based on personal risk strategy
As with any trade, Do Your On Research as this chart just shows technicals and trend based trade entries. Having a pulse on fundamentals and market news in addition to Technical Analysis is key to trading successfully.


SPXUSD Volatility Stops and 9Season (4h, 12h, 1d)Partly working on a new indicator set so these ideas are part me working out my thoughts. see more at the bottom for those thoughts. The two volatility based stops, the VSTOP and the Chandelier, are both based off the average true range. Link to the 9Season idea
Key points for all timeframes
Support fails
Volatility stops flip bearish
(mostly) Bearish 9 season rainbow.
4h
Price action for the ending of both uptrend shows price action finally breaking the black trendline then consolidation at the red arrow before the next leg down with both the Chandelier and VSTOP creating a ceiling.
The 9 Season for the first bearish move showed yellow on multiple timeframes (which is clear resistance) and the lowest timeframe flickered lime green which is crazy overbought and generally unsustainable This current uptrend has flicked straight to bearish for 4 timeframes and at the highest timeframe has gone from yellow to lime green to weak bull. I expect it to go to bearish shortly as well.
12h
The volatility stop for both movements still show the price action slipped the trendline and the volatility stops created a ceiling. The last move down had yellow at the higgher timeframes which was proved to be very bearish. The higher time frames for this move down are still green for a bullish move but the lower timeframes are yelling exhaustion. With the 4h timeframes looking so bearish I expect the 9Season to look bearish on all timeframes shortly.
1d
for the last leg down the 9Season lagged a clear entry until the lowest timeframe went yellow to red and that was no better than shorting the trendline break. Also currently there is no daily signal on the 9Season. But the Volatility based stops were in pretty good agreement.
Currently the different volatility stops are not in agreement. The VStop said we should have gone short either the last trading day or the day before, using the VSTOP beneath the trendline as a sell stop (very provisional notion here) while the Chandelier has us stopped out. The chandelier would have had you in the uptrend trade from 2640 to 3000 which is pretty good. The Vstop would have had you on this uptrend from 2450 to about 2773 then if you reentered from 2773 to 3170. Not bad either but re-entering is psychologically difficult.
In conclusion
4h - Bearish and short
12h Bearish and short
1d Mixed, either close long and wait for clearer signal or use V-Stop
Not financial advise as I am not a certified market technician, and this is a new system I am trying to work on. Have the same problems as many, not letting my winners run and not cutting my loses soon enough so my account could have gone up a whole lot more than it did the last 4 months.
One thing I am looking at is changing the VSTOP and Chaelier setting to 2.1 or 2.2 to avoid some of those narrow wickouts . Prioritizing letting my winners run by giving them just a bit more space than getting a super quick entry. Other things I am looking at is doing some of my standard TA (MACD, OBV divergence, Bollinger band, etc) at one time frame, and then cutting the time fame in half to look for my entry. So if I am looking at a weekly chart for a move that could last months I would be looking at entry on the 3d chart. If I am looking at the daily chart for a move that should last a week or two? Maybe a month? Enter on the 12h (crypto, futures) or 4h (normie securities).
Still very provisional.


SPXUSD Possible Shorting OpportunityThis is my first time taking a crack at the SP 500....
I think i may have came across an opportunity to enter a short..
Price appears to respect (at least somewhat) the 61.8 fib level,
thanks to corona price has been in a sharp decline, and this rally just maybe (MAYBE, MAYBE) over, and sells shall continue.
Price is also in a supply zone and has struggled to break through...
i plan to enter on a "pullback," after price completes the "right shoulder of the H&S pattern.
Also on the weekly, price entered in a doji candle, showing a lot of bearish pressure.
also a bold rejection of the 61.8 weekly fib level
Like, comment, follow please. If you have a different opinion feel free to comment.

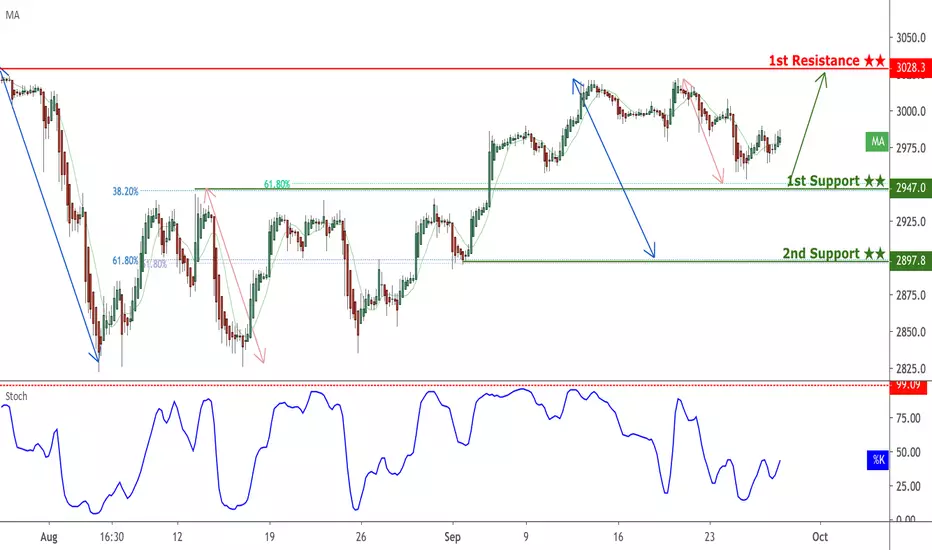
SPX bounced from support, potential for a further rise!
SPX bounced off 2947.0 where it could potentially rise further to 3028.3.
Trading CFDs on margin carries high risk.
Losses can exceed the initial investment so please ensure you fully
understand the risks.
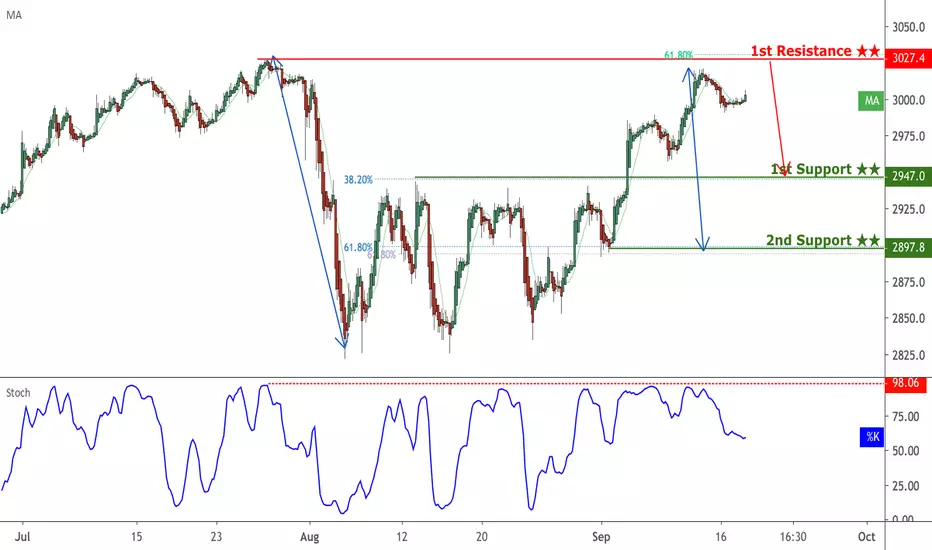
SPX potential reversal!
SPX expected to rise up to 1st resistance at 3027.4 where it could potentially react off and drop down to 1st support at 2947.0.
Trading CFDs on margin carries high risk.
Losses can exceed the initial investment so please ensure you fully
understand the risks.
SPX to climb from upside confirmation, potential bounce!
SPX to climb from its upside confirmation at 2955.8 where it could potentially bounce further to 3027.4.
Trading CFDs on margin carries high risk.
Losses can exceed the initial investment so please ensure you fully
understand the risks.
