SPY 20JAN 2026 READ DESCRIPTIONSpy is about to hit this level. Just be careful if you are short.
Market can easily bounce and go up from here.
I am travelling and will try to update spy weekly asap.
SPDR S&P 500 ETF (SPY)

ES (SPX, SPY) Analysis, Key Zones, Setups for Wed, Jan 21
Today was the worst session since April - S&P 500 dropped 2.1%, wiping out 2026 gains. The catalyst? Trump's Greenland tariff escalation ahead of Davos. 10% tariffs on 8 EU countries starting Feb 1, rising to 25% by June 1. Supreme Court declined to rule on tariff authority today, extending uncertainty at least another month.
Critical Event Tomorrow: Trump's Special Address at Davos runs 8:30-9:15 AM ET - directly overlapping cash open. This is the primary catalyst. Any headline could swing markets 50+ points.
ECONOMIC CALENDAR - JAN 21
- 8:30 AM ET: Housing Starts & Building Permits
- 8:30-9:15 AM ET: TRUMP DAVOS SPEECH
- 10:00 AM: Pending Home Sales
Housing data releases simultaneously with Trump's speech - expect it to be overshadowed entirely.
TECHNICAL STRUCTURE
Daily: Price at 6,848.50 holding above 1.618 fib (6,834.50). Premium-to-discount transition in progress after rejection at HH near 7,040.
4H: CHoCH+ triggered at 6,923 confirming bearish shift. Price trading in discount below Equilibrium (6,923.25). Key fibs: 1.272 (6,873.50) | 1.618 (6,834.50) | 2.0 (6,791.25). PWL at ~6,923.25.
1H: Clear LH → LL sequence. PWH at 7,020 (premium trap). BOS confirmed. PML at 6,764.75.
KEY ZONES
RESISTANCE (Shorts):
- 6,865-6,875: VWAP + 1.272 Fib - first rejection zone
- 6,896-6,905: NYAM.H (6,904.75) + Asian resistance
- 6,920-6,935: CHoCH+ origin + Equilibrium - strong supply
- 6,960-6,975: Major liquidity wall (Davos relief rally target)
SUPPORT (Longs):
- 6,834-6,843: 1.618 Fib + AS.H - first bounce zone
- 6,815-6,822: NYPM.L (6,822.25) + 1.272 extension
- 6,791-6,800: 2.0 Fib - psychological confluence
- 6,764-6,780: PML (6,764.75) - STRONG BID expected
SCENARIOS
BEARISH CONTINUATION (60%)
Trump hardlines, no diplomatic progress, EU threatens retaliation.
- Break below 6,834 → 6,791 → 6,764
RELIEF BOUNCE (30%)
"Constructive dialogue" headlines, Feb 1 deadline pushed.
- Squeeze to 6,905-6,920, potential 6,960 extension
CHOP (10%)
Markets await clarity, range 6,820-6,880.
TRADE SETUPS
SHORT @ Premium Rejection
- Entry: 6,896-6,920
- Stop: 6,940
- T1: 6,865 (31-55 pts)
- T2: 6,834 (62-86 pts)
- T3: 6,791 (105-129 pts)
- Confirmation: CVD divergence, absorption failure
LONG @ Discount
- Entry: 6,791-6,800
- Stop: 6,764
- T1: 6,834 (34-43 pts)
- T2: 6,865 (65-74 pts)
- Confirmation: CVD divergence, institutional absorption
RISK NOTES
1. Headline risk EXTREME - size 50-75% of normal
2. Cash open = speech overlap (8:30-9:15 ET)
3. Watch EUR/USD as leading indicator
4. VIX elevated - mean reversion could fuel squeeze
WATCHLIST
- NFLX: Beat earnings, pausing buybacks for Warner deal
- 10Y: 4.29% - above 4.35% = pressure, below 4.20% = relief
- Gold: $4,700+ record - risk-off barometer
- Bitcoin: Cracked $90K
Bearish bias with headline optionality. Structure says lower but Davos = binary risk. Focus 6,920 resistance for shorts, 6,791-6,800 for longs. Let order flow confirm. NOT a session to overtrade.
Good Luck !!!

SPY WEEKLY 20 JAN 2026Spy weekly is here, feel free to leave a comment if you have any doubt and I will try to revert back asap.
I have analyzed in depth price action here discussing all sectors as well
NOTE:ALWAYS USE SL

$SPY & $SPX — Market-Moving Headlines Wednesday Jan 21, 2026🔮 AMEX:SPY & SP:SPX — Market-Moving Headlines Wednesday Jan 21, 2026
🌍 Market-Moving Themes
🌐 Greenland Tariff Panic
Markets sell off sharply as confirmed tariffs on European allies escalate trade-war uncertainty
🟡 Safe Haven Rotation
Gold pushes to fresh record highs as equities and tech absorb risk-off flows
⚡ AI Power Policy Shift
GE Vernova extends gains as focus turns to building new power infrastructure over legacy grid
✈️ Travel Earnings Bright Spot
Airlines outperform on strong earnings and sustained weakness in oil prices
💾 AI Memory Shortage Signal
Storage names rally as demand for AI-related memory outpaces supply despite broader tech weakness
📊 Key U.S. Economic Data Wednesday Jan 21 ET
10:00 AM
- Construction Spending Oct: 0.1%
- Pending Home Sales Dec: 0.7%
⚠️ Disclaimer: For informational purposes only. Not financial advice.
📌 #SPY #SPX #Macro #Trade #Tariffs #Housing #AI #Energy #Markets #Stocks #Options

SPX Has Now Broken Down From Our Wedge As AnticipatedTrading Fam,
It's time. We've prepared. SPX has now broken our wedge to the downside. Another candle on the daily will confirm this bearish move. I expect the 50-day SMA to give us a bit of a bounce. We may retest the underside of the wedge before further moving down at the end of this week or the beginning of next.
Again, as stated in my previous video post, I would expect us to draw back to at least that 200-day SMA in red. More likely, we'll go to support, which intersects with that 350-day SMA (orange) at around 6100. If we go lower and break below that 350-day SMA, we're likely to test the bottom of our channel.
Trade accordingly once confirmation of this bearish move can be had.
✌️Stew

QQQ Weekly Outlook – Week 3 of 2026 (Jan 19–23)QQQ Weekly Outlook – Week 3 of 2026 (Jan 19–23)
Technical Look:
Last Monday, price pushed into 629.25, which I marked as Bullish Target 1 in last week’s outlook, but failed to secure a close above that level. As mentioned in my Sunday outlook, with CPI scheduled for Tuesday, I did not expect sustained upside continuation beyond those levels before the data release.
QQQ tapped 629.25, failed to hold above it, and began its retracement exactly as anticipated.
Since QQQ was the stronger index relative to SPY, it found support earlier and did not need to reach its full downside target at 610.25. SPY had already reached its key support zone, which allowed QQQ to stabilize sooner.
(Please refer to the linked idea for visual confirmation.)
Scenarios – Prediction:
At this stage, I am tracking two potential scenarios.
Scenario 1: Bearish Scenario (Higher Probability)
This is currently the more likely scenario due to the macro environment, particularly Trump–EU tensions and potential EU tariffs related to Greenland.
I believe price may open the week with a sharp downside move.
My bearish targets are:
614.5 – 610.25 – 599.5
If price breaks 614.5 decisively and closes a 4H candle below it, I would expect a move toward 610.25.
Likewise, if 610.25 is broken aggressively and holds below, price could extend toward 599.5.
Each of these bearish targets also represents a potential bounce or reversal zone, so I prefer taking partial profits (around 1/3) at each level.
If price breaks 614.5 decisively, I would look to engage on the short side using put options.
Scenario 2: Bullish Scenario
This scenario becomes valid only if Trump–EU tensions ease before the market opens (with Monday being a holiday and trading resuming on Tuesday).
The 626 level acts as a call wall in options positioning for QQQ. If price breaks above 626 aggressively, I would look to buy calls on a retracement, targeting 629.5 and 636.5.
Position Management Notes:
I rely on confirmation-based entries around key levels. Once in a position, I manage risk by taking partial profits at reaction zones and adjusting exposure as price structure develops.
I share deeper US Market breakdowns and weekly scenario updates on Substack. Link is in my profile.
This analysis is for educational purposes only and reflects my personal opinion. It is not financial advice.


SPY : downwards move announced on Jan 8th in motionAs I hinted on Jan 8th, I expected a downwards move to unfold this month, on the basis of identical patterns.
It is unfolding from today 20th January
The supports are likely to be broken.
Taking the low in April 2025 at 484 and the recent high at 696, logarithmic Fibonacci projections gives :
0.7624 = 638
0.6182 = 606
Applying the insight of Shaikh 2016 on gravitation towards equilibrium, sharply undershooting the target will create the opportunity to buy
My Strategy
I will choose SPY or QQQ. I will engage in neutral strategy (delta = 0) made of the underlying and an option combo which requires very low margin. The position will be huge leading to borrowing up to 25 times capital. The goal is to take advantage of a slight increase of delta.

$SPY the final leg higher, then 20%+ correctionI know there are a lot of people calling for a crash right here, and while I do think we end up getting one, I think there's one last move higher above $700 first.
I think we need to squeeze out the shorts and convince everyone the next leg is starting before we see a move down.
I do think after we hit and reject one of the upper resistances, that it will set up a great short opportunity.
The trigger for the short will be UVIX to hit it's lower support levels combined with SPY hitting it's upper resistances.
Don't know what will cause the move, but I think it'll likely happen even faster than the April move.
So be prepared to exit as we approach the highs or set tight stop losses.

Opening (IRA): SPY March 20th 640 Monied Covered Call... for a 629.60 debit.
Comments: Adding/laddering out at intervals, selling the -75 delta call against shares to emulate the delta metrics of a 25 delta short put to take advantage of heightened IV on the call side.
Metrics:
Max Profit: 10.40 ($1040)
BPE: 629.60
ROC at Max: 1.65%
Will generally let these go to expiry and allow the stock to be called away or take profit on setup approaching max. Alternatively, will look to roll the short call down and out for a credit that exceeds any "strike destruction" should the short call end up out-of-the-money.

TAKING PROFITS IN ALL SHORTS MARKET ON OPEN $$$$ The chart posted is the SPY on Friday I shorted 90 % in spy I went long PUTS deep in the money in spy and 100 % in Smh puts as well I am Taking Profits once again as we are holding two fib relationships in the premarket It was a Nice $$$ gain Best of Trades WAVETIMER

SPY Weekly Outlook – Week 3 of 2026 (Jan 19–23)SPY Weekly Outlook – Week 3 of 2026 (Jan 19–23)
Technical Look:
As expected last week, price found support at the 687.5 level and continued its upside move. We discussed that if SPY failed to push toward 700 on Monday’s open, a post CPI pullback toward 687.5 could occur. That scenario played out precisely on Wednesday, with price retracing into the 687.5 zone and finding support there.
As I mentioned in my Wednesday Mid Week Update, this reaction marked a shift back to a bullish structure, with upside targets at 691.75 – 694 – 695.25. I also stated that I would exit all call positions at 695.25, and price reached that level exactly before getting rejected.
(Please refer to the linked idea for visual reference.)
Scenarios – Prediction:
At this point, I am tracking two possible scenarios for SPY.
Scenario 1: Bearish Scenario (Higher Probability)
This is currently the more likely scenario, mainly due to the macro backdrop, including Trump–EU tensions and potential EU tariffs related to Greenland.
I believe price may open the week with a sharp downside move.
My bearish targets are:
686 – 679.75 – 669.5
If price breaks 686 aggressively and closes a 4H candle below it, I would expect a move toward 679.75.
Similarly, if 679.75 is broken decisively and holds below, price could extend toward 669.5.
Each of these bearish targets also represents a potential bounce or reversal zone, so I prefer taking partial profits (around 1/3) at each level.
If price breaks 686 decisively, I would look to engage on the short side using put options.
Scenario 2: Bullish Scenario
This scenario becomes valid only if Trump EU tensions ease before the market opens (with Monday being a holiday and trading resuming on Tuesday).
The 695 level acts as a call wall in options positioning for SPY. If price breaks above 695 aggressively, I would look to buy calls on a retracement, targeting a move toward the 700 area.
Position Management Notes:
I manage risk by scaling out of positions at key reaction levels and adjusting exposure as structure confirms. Partial profit-taking at major levels is a core part of my approach.
I share deeper US Market breakdowns and weekly scenario updates on Substack. Link is in my profile.
This analysis is for educational purposes only and reflects my personal opinion. It is not financial advice.

World Recession ~ WWIII ~ History RepeatsDuring a long-term trend, the “four crucial points” of the stock market are reached when the Node enters the four fixed signs respectively:
January 11, 2025: Enters Aries (South Node in Libra) Aries: The business activity starts to fall below the normal level
July 26, 2026: Enters Pisces (South Node in Virgo) Pisces: The business activity approaches the bottom of the cycle
January 27, 2028: Enters Aquarius (South Node in Leo) Aquarius: This is the extreme low of business activity, the bottom of the cycle
August 2, 2029: Enters Capricorn (South Node in Cancer) Capricorn: The business activity turns up from the bottom

S&P 500 54 days Rising Wedge Topping Formation Breakdown Here we can see that S&P 500 formed a 54 days rising wedge topping formation. This pattern signals an overall exhaustion in the market, meaning the price keeps climbing up, but each next push up is weaker.
It is very important that the volume after each push up is declining too signaling an exhaustion of the buyers. Also here we can see an interesting observation which doesn't always exist in rising wedges - the volume during down red days is higher than during green days which signals distribution.
This was a pure TA part. Now I want to share my macro thoughts very briefly why this rising wedge does not exist in a vacuum.
My main idea is that gold is simply pricking the stock market bubble now which I believe we are in. Money simply goes into gold and silver and stock simply go down at first in gold terms and later in dollar terms. This does not always happen but moves in precious metals now are simply historic and can not be ignored (magnitude of 2000s and 1970s pumps).
Also VIX has hit the lowest reading in 2 years which signals complacency (now it is up a lot).
Also corporate credit spreads are the lowest since 2008 meaning investors demand very little premium for holding risky corporate bonds over government ones.
Back to TA. There were a lot of tech stocks going down for a while already which spy simply does not capture (nasdaq qqq did capture it lil bit which is why it lagged behind s&p 500 past month).
We clearly saw a rotation from tech heavy nasdaq to IWM russel 2000 index since NOV 24 2025. Also we saw a rotation from nasdaq to european STOXX index which outperformed past month too. Usually that's not a good sign and leads to corrections.
All of this together and not just a pure TA makes my idea a little bit stronger when adding all the factors together. We will see how it plays out. And yes Stocks PE ratio is very high too now.
Don't forget the geopolitical uncertainty which high growth stuff hates (bitcoin including plus tech stocks). Defense stocks did well and gold hedges. I heard people say the Sell America trade where there's a higher risk premium to hold american stocks investors might demand with the whole trade wars which every one is sick of and Greenland takeover.
Stay safe!

ES (SPX, SPY) Analysis, Key Levels, Setup for Tue (Jan 20)U.S. cash markets paused on Monday in observance of Martin Luther King Jr. Day, but trading on the Globex platform displayed pronounced volatility amid soaring U.S.-EU trade tensions focused on Greenland. The E-mini S&P 500 (ES) saw a decline of approximately 1.1% from Friday's close, while the Nasdaq-100 (NQ) lagged further, dropping 1.4%. In a shift towards safe-haven assets, gold prices surged to an all-time high of $4,660, driven by a weakening U.S. dollar and strong performance from the Swiss franc.
The catalyst behind the market's movement was President Trump’s announcement of a 10% tariff on eight European NATO allies specifically Denmark, the UK, France, Germany, the Netherlands, Norway, Sweden, and Finland set to take effect on February 1. This tariff is scheduled to escalate to 25% by June 1 unless an agreement regarding Greenland is reached. In response, the EU has activated an emergency protocol and is deliberating potential countermeasures.
Treasury Secretary Bessent, speaking at the World Economic Forum in Davos, expressed optimism about the U.S. economy, stating, “We expect investment to accelerate this year.”
FORECAST
BIAS: Neutral-to-Bearish (Short-Term)
OVERNIGHT THOUGHTS: The Asia and Europe trading sessions are anticipated to test recent overnight lows, with potential for unsuccessful dip-buying efforts at resistance levels.
TUESDAY NY SESSION OUTLOOK: As U.S. traders return to the markets, they will react to the weekend’s accumulated news. An initial attempt at short-covering is expected, likely followed by renewed selling pressure. Failed rallies in the 6920-6935 range may further exacerbate the downward trend.
BULLISH SCENARIO (30% likelihood): A retraction back to 6923 that holds could lead to a gap fill toward the 6950-6960 area.
BEARISH SCENARIO (50% likelihood): A failed rebound at resistance may signal a continuation down to the 6870-6850 discount zone.
CHOPPING SCENARIO (20% likelihood): The market may remain range-bound between 6887-6920 while awaiting clearer catalysts.
INVALIDATION POINT: A sustained break above 6950 would shift the bias towards bullish.
HIGH-IMPACT SCHEDULED ITEMS (ET)
09:30 - US cash equities reopen after MLK Day closure (gap-and-go risk; repricing of Greenland tariff headlines that built up while cash was shut)
10:00 - Supreme Court session begins. Oral arguments scheduled: Wolford v. Lopez (2A), M&K Employee Solutions v. Trustees (pension). Opinions possible but not guaranteed - the tariff case (Learning Resources v. Trump) ruling could drop any session. Court did not pre-commit which decisions will be released. Last courtroom session until Feb 20.
11:30 - Treasury bill auctions (supply event; can jolt front-end yields and spill into ES via rates):
6-week bill auction (announced Thu prior)
4-week/8-week bills settle Tuesday per standard pattern
52-week bill auction possible (every 4 weeks on Tues)
16:01 - Netflix (NFLX) Q4 earnings release - HIGH IMPACT
16:15 - Fed H.10 Foreign Exchange Rates (pushed from holiday)
16:45 - Netflix earnings interview begins
After the close (earnings beta into index futures):
Netflix (NFLX) - major index weight, sentiment driver
United Airlines (UAL)
Interactive Brokers (IBKR)
US Bancorp (USB)
Fifth Third (FITB)
KeyCorp (KEY)
Before the open (also relevant if you trade the open):
3M (MMM)
DR Horton (DHI)
Fastenal (FAST)
WHAT IS NOT ON THE CALENDAR (STILL IMPORTANT)
No top-tier BEA macro prints (GDP/PCE/Income) scheduled for Tue Jan 20 per BEA release schedule
No major BLS releases scheduled for Tue Jan 20 per BLS January schedule
No FOMC meeting - next meeting is Jan 27-28
Fed note: Daily/weekly statistical releases scheduled on the holiday (Mon) are pushed to Tuesday - H.10 at 4:15 PM, H.8 on Thu. Can nudge rates/liquidity expectations.
Trump v. Cook (Fed's Cook firing case) oral arguments are Wednesday Jan 21 - could create Fed-related headline risk heading into that session
WATCH LIST (UNSCHEDULED BUT HIGH PROBABILITY)
EU tariff retaliation announcement - emergency meeting concluded, response expected
Trump/Bessent comments from Davos
Any SCOTUS tariff ruling leak or rel
Good Luck !!!

Still waiting for a correction in the S&P 500Still waiting for a correction in the S&P 500 from its peak, around 10% or so.
The correction pattern looks pretty similar to what we saw at the start of 2025, let's see how it plays out this time.
Target: $6250

S&P500 | NASDAQ: AMD In Action! Wait For Distribution!Welcome back to the Weekly Forex Forecast for the week of Jan. 19-24th.
In this video, we will analyze the following FX market: ES and NQ
Both indices have been moving sideways for over two weeks. Tariff news over this weekend has caused investors to move money to safe havens, like gold and silver, and out of the equity markets.
I believe this is for the short term. Should better heads prevail, Trump will back off his tariff threats to NATO allies. Meanwhile, the injection of volatility by the news shook up the markets again, keeping the air of uncertainty in place.
My plan is to wait for the signature of price to show us that the pullback is over, and the market will resume its upward trend.
Accumulation, Manipulation, Distribution. On a Bank Holiday Monday for the US banks, this is a day when manipulation can catch a lot of traders unawares.
I am waiting for the Distribution part to begin.
No trades for me today. ; )
Enjoy!
May profits be upon you.
Leave any questions or comments in the comment section.
I appreciate any feedback from my viewers!
Like and/or subscribe if you want more accurate analysis.
Thank you so much!
Disclaimer:
I do not provide personal investment advice and I am not a qualified licensed investment advisor.
All information found here, including any ideas, opinions, views, predictions, forecasts, commentaries, suggestions, expressed or implied herein, are for informational, entertainment or educational purposes only and should not be construed as personal investment advice. While the information provided is believed to be accurate, it may include errors or inaccuracies.
I will not and cannot be held liable for any actions you take as a result of anything you read here.
Conduct your own due diligence, or consult a licensed financial advisor or broker before making any and all investment decisions. Any investments, trades, speculations, or decisions made on the basis of any information found on this channel, expressed or implied herein, are committed at your own risk, financial or otherwise.

SPX to Money Supply WARNING!If the charts aren’t showing bubble setups, I’m not going to invent them. I post what the data shows. So please don’t shoot the messenger when I say GTFO & STFO.
And just to keep the facts straight:
Brokerage, stock, and crypto accounts are not part of M2.
Why does M2 matter?
It’s the actual spendable money in the economy.
When M2 grows faster than real output (as it did in 2021), price pressure builds.
The economy runs on liquidity.
Retail, goods, services all of it requires money you can actually spend, not paper gains in a trading account.
When the S&P 500 disconnects massively from M2 — like during the dot-com bubble — revenue and profit growth can’t keep pace. Valuations expand purely on speculation, not on real, organic fundamentals. That’s how multiples stretch and bubbles form.
The problem? Most retail traders have no idea this is happening. They’re trading with their hair on fire, following cute social-media stories dressed up as “analysis,” using strategies that have never been tested in real markets.
And that’s exactly how bubbles are fed:
big players sell into retail euphoria, and retail ends up holding the bag of schitt!
Buy when stocks are cheap, not at all-time highs in euphoria land.
"Price is what you payt, VALUE is what you get!"
THANK YOU for getting me to 5,000 followers! 🙏🔥
Let’s keep climbing.
If you enjoy the work:
👉 Drop a solid comment
Let’s push it to 6,000 and keep building a community grounded in truth, not hype.

$SPY the beginning of a covid style selloff? 20-32% drop?It is finally time for a larger selloff to happen. As you can see, we've broken down out of a rising wedge and many people are calling for another scenario to buy the dip, but this dip doesn't look the same as all of the other dips.
To me, this looks more like the start of a larger selloff. My thesis is that this selloff will be a cross between the selloff that took place in 1989 and covid. I think we're about to see a 20-32% drop that comes very quickly not giving people time to get out.
The past two days we're already trading exactly like we did in covid, where we can see sharp rallies that are met with more selling.
The reason this selloff is different is because volatility is starting to react and I have strong buy signals on the weekly timeframe while I'm getting weekly sell signals on SPY.
While my base case was that we'd only get a 20% selloff down to the $550-560 area on the chart, I won't rule out the possibility of the market selling off to the next support level down at $468-$481.
The selling should get stronger once we're under the $666-672 level and volatility will start to rise quickly. Under the $650 level should be lights out for the market.
Again, I think this selloff is going to happen very quickly over the next few weeks, so I'd be cautious buying any dips.
Let's see how it plays out.

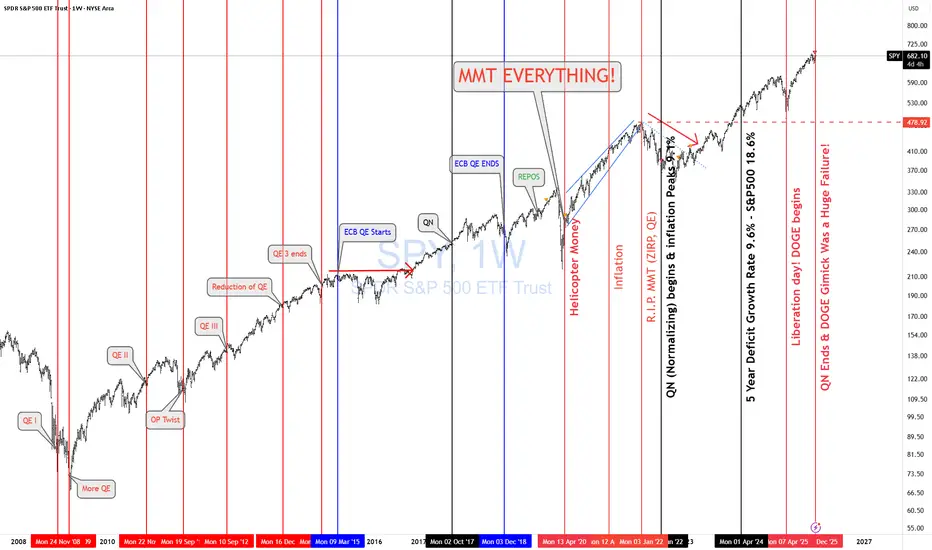
SPY & Macro HistoricalToday FED ended QN (Quantitative Normalizing NOT "T" = tightening. 1st, you normalize, then you tighten. Right??)
The Fed is continuing to let mortgage-backed securities roll off its balance sheet, while the U.S. Treasury increases T-bill issuance (cash-like instruments). That combination means more gov securities are hitting the market even as the Fed’s balance sheet stays roughly unchanged.
More Treasury supply + no Fed buying = higher yields and tighter liquidity. More MBS roll-off = higher mortgage rates and pressure on housing. Treasury bills soak up cash, while longer bonds suffer.
🔥 REALMACRO summary:
The Fed is doing this to:
Get out of the mortgage market.
Strengthen the Treasury bill market (the foundation of dollar liquidity).
Keep bank reserves “ample” without restarting QE.
This combo lets them tighten just enough to cool asset prices, without breaking the plumbing again like in 2019.
The success of this experiment will largely determine how long the Fed can avoid returning to QE. If liquidity tightens too far as the economy continues to weaken, they’ll be forced back into some form of balance sheet expansion sooner rather than later.
Lastly, let's check how right I was when I posted "MMT Everything."
As of April 2020, US debt was $ 24T. Today, it is $38T, representing a total increase of $14T in 5 years.
✅ CAGR ≈ 9.6% per year
✅ S&P 500 CAGR (Apr 2020 → Today): ~18.6% per year
Both are completely unsustainable growth rates.
I nailed that back in April 2020. Trump & MMT "print and play" will be the death of us! SIGH!
Lastly, the DOGE gimmick was a complete and total failure as expected. No reduction in deficit and no fraud found. Imagine that!
As I keep saying, " NEVER INVEST IN TOXIC PEOPLE! THEY WILL ALWAYS BURN YOU IN THE END!" It's not political it's a FACT!
THANK YOU for getting me to 5,000 followers! 🙏🔥
Let’s keep climbing.
If you enjoy the work:
👉 Drop a solid comment
Let’s push it to 6,000 and keep building a community grounded in truth, not hype.
Looks a little scary tonightSeeing the gap down and out doesn't look good. very very similar patterns here both in duration and pattern. I could see a snap up as a retest to fill the gap. But given all the geopolitical risk, it smells like a gap and go. time will tell

Breakdown after Jan 14 Volatility Event - Get some.This video highlights the continued price action I suggested would take place after the Jan 14 volatility event.
Honestly, watching the markets open tonight, moving in the direction of my trades (metals, SPY/QQQ/TECS/XLK/others). I could not be happier.
Additionally, Nat Gas is starting to make a big move higher. I've been positioning into this move for more than 30 days. Now, the dual Polar Vortex may setup driving very cold temps into the US/UK.
Sometimes, you have to trust the ADL predictive modeling and play those bigger moves for profits.
I just wanted to share this success and to ask you if you were able to follow my research and GET SOME as well.
We could see a big breakdown over the next 24 hours on news or social issues in the US/UK.
Get some.

Why “End the Fed” Is a Dangerous For Investors“Hate & End the Fed” sounds bold and rebellious. It plays well on social media.
In the real world, it is one of the most dangerous ideas an investor can support.
Not because the Federal Reserve is perfect — it isn’t.
But because its independence is the firewall that prevents politicians from abusing it and collapsing the dollar’s currency payment system.
What People Get Wrong About the Fed
The Fed does not:
Print money and spend it
Fund government deficits
Buy Treasury bonds at issuance
Decide fiscal policy
Those actions are illegal.
The Fed’s job is narrow and operational:
Run the payment system
Set short-term interest rates
Manage bank reserves
Act as settlement agent for Treasury
Ending the Fed would not end “money printing.”
It would remove the last institutional constraint between politics and the payment system.
What Replaces the Fed If It’s “Ended”?
There are only two possibilities:
Direct political control of money
A Treasury-run payment system
Both are historically disastrous.
Without an independent settlement authority:
Spending pressure becomes electoral pressure
Rates become political tools
Inflation is postponed, not prevented
Currency credibility erodes
Markets recognize this instantly.
Why Investors Should Care (Deeply)
Capital does not fear central banks.
Capital fears loss of constraint.
Once investors believe:
Monetary discipline is optional
Rates are politically set
The payment system can be bent for votes
They reprice risk:
Bond yields rise
FX weakens
Equity multiples compress
Capital seeks safer jurisdictions
This is how reserve currencies lose trust — slowly, then all at once.
The Irony
The loudest voices shouting “End the Fed” often claim they oppose money printing.
Ending the Fed would enable exactly that — not through a central bank, but through politicians with no operational firewall.
Right now:
Treasury must fund the TGA
Spending follows funding
The Fed only settles
Remove the Fed, and you don’t get freedom — you get political currency.
Final Thought
The Federal Reserve does not exist to protect bankers.
It exists to limit power — especially political power.
End that constraint, and the dollar’s payment system becomes a political instrument.
Laws
U.S. Constitution – Article I, Section 8: Congress may tax and borrow; it cannot print or spend by decree.
U.S. Constitution – Article I, Section 9: No money may be drawn from the Treasury without lawful appropriation.
Federal Reserve Act §14: The Fed may purchase Treasury securities only in the secondary market, not at issuance.
Federal Reserve Act §10B & §13(3): Fed lending must be collateralized; unsecured lending and funding Treasury are prohibited.
Treasury General Account (TGA) rules / post-1980s reforms: Treasury must spend from a positive TGA balance; no Fed overdrafts.
Markets don’t debate slogans.
They price consequences.
This is not POLITICAL! This is COUNTING!
#FAFO
If you enjoy the work:
👉 Drop a solid comment
Let’s push it to 6,000 and keep building a community grounded in raw truth, not hype.
