October 13 - October 17 2025I decided to go through and consolidate my charts this week to make for easier decision making. Friday’s sell off was a sign of weakness in a market that was already showing strain. While the drop on resumed trade war threats was swift, the rest of the market had a muted response. Heading into this week, we should see another big move and I will try to be open to trading either side depending on how this develops.
1. Macro
Gold is still in its uptrend and that is unlikely to change anytime soon. I don’t have it charted here, but Gold’s volatility index CBOE:GVZ spiked during Friday’s session, however buyers seemed to be absorbing the volatility since it still closed up over 1%. Gold has already made a new ATH today and I do not expect to see the trend change this week.
The dollar TVC:DXY seems to be near the top of its deviation from the flat EMA. I think we will see the dollar move lower which could boost Gold, Stocks, or both. Next, we saw TVC:US03MY remain relatively flat during Friday’s sell off while TVC:US10Y moved sharply lower during the session, making the TVC:US10Y -US03MY spread very tight once again. Since real yields are still edging up and the 3M bond stayed flat during the panic, that leads me to believe the bond market volatility was contained and may not be indicative of a true risk-off reaction.
One reason why US Treasuries will continue to catch a bid is that as forward inflation expectations continue to slide (bottom left chart), the real return is still attractive compared to bonds from other major countries. We’ll see if the renewed trade sparring will change the forward inflation exceptions trend since the data from TIPS is delayed, however for now I’ll continue to base my perception on what I’m currently seeing on the chart.
Lastly, Oil is continuing to see an average decline. Hopefully middle eastern peace efforts are successful, which could keep the price subdued. On the bottom chart I have combined the average of MCX:COPPER1! and Corn CBOT:ZC1! into a single line compared to TVC:DXY , which aims to show real demand (and/or inflation) pressure against the Dollar’s relative strength. Here we can see commodities took a hit on Friday but the trend is still very strong to the upside. Since forward inflation expectations are down and the dollar is flat, this may be pointing to the presence of real demand, which should be bullish for equities.
2. Risk
Even when looking at the past six months on a line chart, the pullback, Friday’s drop was significant. As I mentioned last week, there are important risk-health items to watch for here. I’m now just charting the High Yield OAS - Investment Grade OAS spread, which was already starting to move up before Friday’s sell off. This data is only reported once per day for the previous session, so the impact on corporate bond yields is not yet known. This will be very important to pay attention to, as it could signal true aversion to risk.
Next, the $ES1!/GOLD spread is declining and should continue until Gold enters a re-accumulation phase. Anyone’s guess when that will be so for now I think it’s safe to assume that Stocks will continue to underperform Gold, and if Friday’s drop was any indication of which side is in control, it serves as confirmation that stocks are sensitive to bad news. Buyers seem to be the ones getting absorbed.
The third chart on the top shows that although CME_MINI:NQ1! has been outperforming CBOT_MINI:YM1! since the market bottomed, the momentum seems to be stalling out. I’ll be looking at the sectors to find any further signs of sustained rotation.
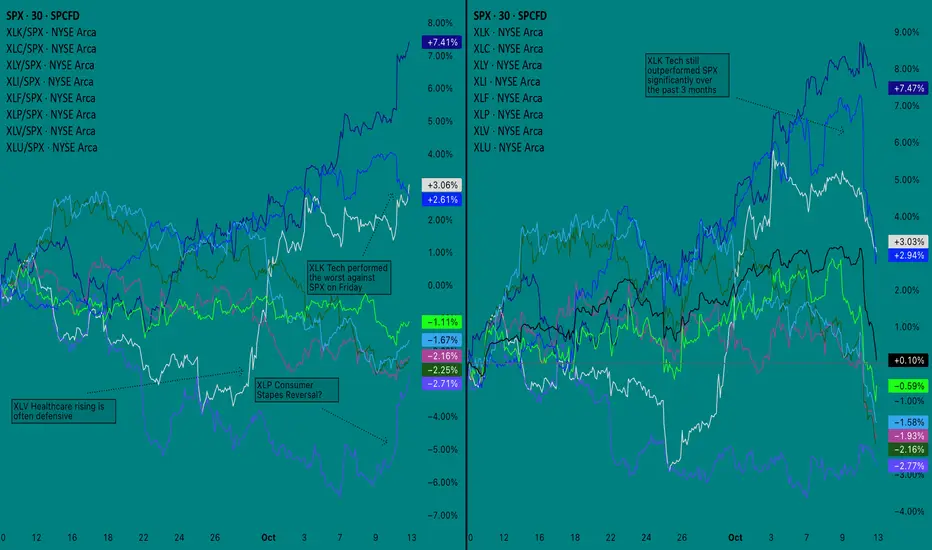
3. Sector Analysis
My notes are best explained in the screenshot but my comment is that most of the decline on Friday came from AMEX:XLK (Tech sector) selling off. Other sectors performed better against SPX, with AMEX:XLP (Consumer Staples) seemingly breaking out of a decline, however as you can see from the chart on the right, it has still been the worst performer against the other indices over the past three months.
One session is not enough to change the trend, however it will be important to watch for continued rotation out of tech and into other sectors. This could cause CME_MINI:NQ1! to decline against CBOT_MINI:YM1! as I suggested earlier, and would signal the market is positioning for a more sustained downturn - likely caused by disappointing growth.
4. Bias
This is the chart I have tried to condense the most. I have switched to just using Line Break as my main chart for ES, which I found performed better than Renko when combined with my other indicators. On the lefthand side, I am using Session CVD but got rid of my other indicators and made a CVD Momentum indicator, which tracks the momentum of CVD rising or falling over an anchor period (1 week). I’m still using a range chart calculation for this chart, currently set to 20R.
On the right, I am using what I’ll call my Volatility Dashboard, however it does not start producing a useful signal until premarket. Based on Volatility, it can be said with certainty that dealers went long on puts right before the sell-off began.
From a technical standpoint, the price was in a rising wedge and dumped after it made a higher high that did not reach the upper trend line. Rising channels are generally bullish, however the extent of Friday’s free fall could mean that even if the price quickly recovers, it may be forming a top similar to what we saw last December. This is why risk indicators like corporate bond spreads, sector performance, and changes to the macro structure will be important to monitor over the coming days.
—
Conclusion
For this week, all I can say with certainty is that I think there will be some good opportunities. Here is what I believe can be safely assessed from this analysis:
1. Stocks remain under pressure, however “smart money” will require more time to rotate out of tech, leading to repeated retests of the top of the range.
2. Tailwinds for stocks are potential real demand in agriculture and industrial material that is not impacting the market’s forward inflation expectation.
3. “Smart Money” will sell volatility (puts) into pullbacks if the price is set to be driven higher, or will do the opposite, buying volatility (puts) and selling calls on low volume rips
This is why I will be looking for more confirmation before taking a side, as the market’s goal now is to clear out liquidity. When it comes to the larger trend, I tend to think that stocks do not seem to be showing strength over the larger macro structure, however that does not necessarily dictate that the index will come down another 8%. Instead, I think at the very least we will stay in a flat range for the time being.
I do not think the market is ready to go on a bull run, nor do I think the environment is showing a risk-off bias that is strong enough to warrant stocks going straight down. If we meet resistance near the top of the range, I’ll look at volatility positioning and CVD for the signal to go short. Conversely, if we make a higher low I will go long on calls to the top of the range.
Good luck to all and thanks for reading!
SPDR S&P 500 ETF (SPY)
ES (SPX, SPY) Analyses, Key-Zones, Week (Mon 10/13 → Fri 10/17)Macro drivers to watch (ET)
Powell (NABE) — Tue 10/14 ~12:20. Markets will parse tone on growth/inflation. (Fed official calendar confirms time & venue.)
PPI (Sep) — Thu 10/16 8:30. First major U.S. inflation print of the week. (BLS “Next Release”.)
Advance Retail Sales (Sep) — Thu 10/16 8:30. Key read on demand into holiday season. (Census “MARTS” note; FRED release calendar.)
CPI (Sep) — not this week; rescheduled to Fri 10/24 8:30 due to the shutdown. (BLS reschedule notice; CPI schedule.)
Earnings kick-off (could move ES): JPM Tue 10/14, BAC Wed 10/15. (Company IR pages/press.)
Market conditions: U.S. bond market closed Mon 10/13 (liquidity thinner); NYSE equities open. (SIFMA; NYSE hours.)
Options expiration: standard monthly Fri 10/17. Expect pinning flows. (Cboe 2025 calendar.)
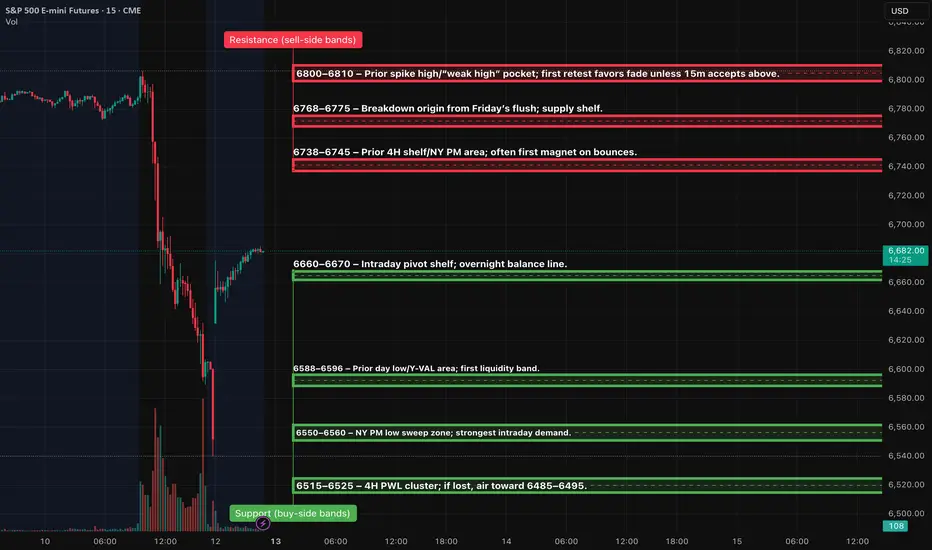
Setups (Level-KZ Protocol — 15m→5m→1m; NY kill-zones preferred)
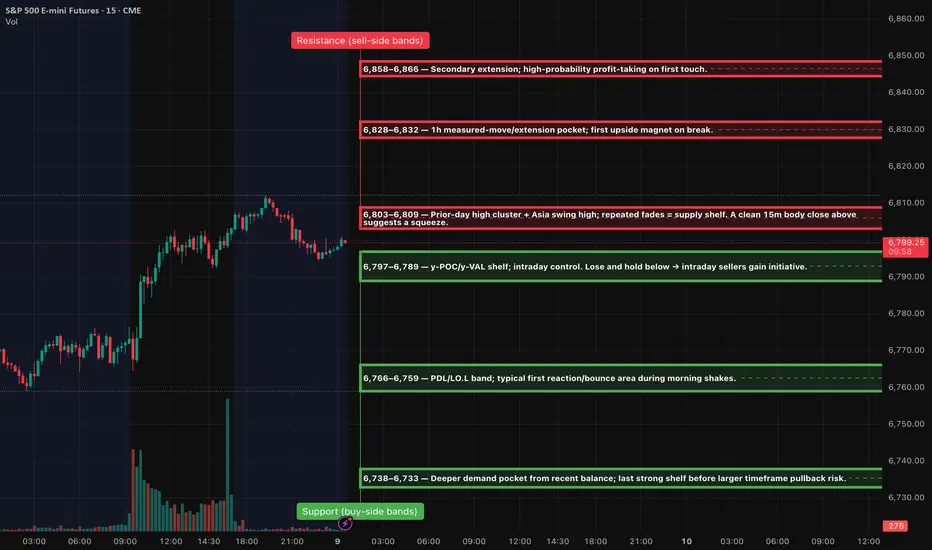
TIER-1 (A++) — Rejection Short at 6790–6810 (NY AM)
Trigger: 15m full-body fails to hold above 6790–6810 → 5m prints a lower-high and re-closes back inside → 1m first pullback “pop-and-fail”.
Entry: 6796–6803 on the 1m failure.
Invalidation: Hard SL above the 15m fail-wick (guide 6814).
TPs: TP1 6738–6745, TP2 6690–6700, TP3 6625–6635.
TIER-1 (A++) — Quick-Reclaim Long at 6550–6560 (Asia/London → carry to NY)
Trigger: Liquidity sweep into 6550–6560, immediate 15m re-close back above 6600, 5m holds ≥6620, 1m higher-low entry.
Entry: 6602–6610 on the first pullback that holds.
Invalidation: Hard SL below the 15m sweep-low (guide 6544).
TPs: TP1 6690–6700, TP2 6738–6745, TP3 6768–6775.
TIER-2 (A+ Bounce) — 6590–6596 fast reclaim
Trigger: Wick through 6590–96 that immediately reclaims ≥6620 on 5m.
Entry/SL: Enter 6615–6622; SL below sweep-low −0.5pt.
Targets: 6690 then 6738–45. ¾ size.
TIER-3 (A Bounce) — 6515–6525 exhaustion flush
Trigger: Capitulation into the 4H PWL band with 15m reversal signal.
Entry/SL: Scale inside the band; SL below the 15m reversal wick.
Targets: 6590–96 then 6690. ½ size; only first touch.
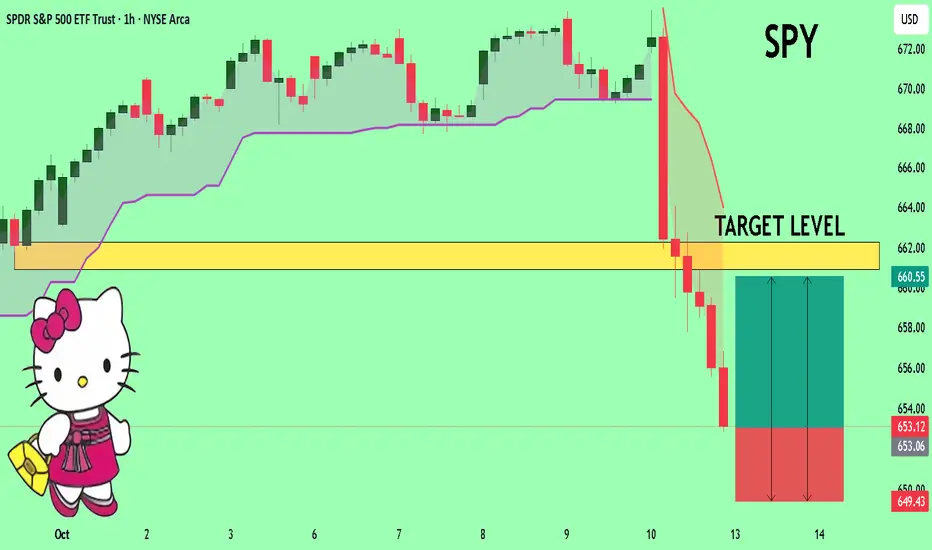
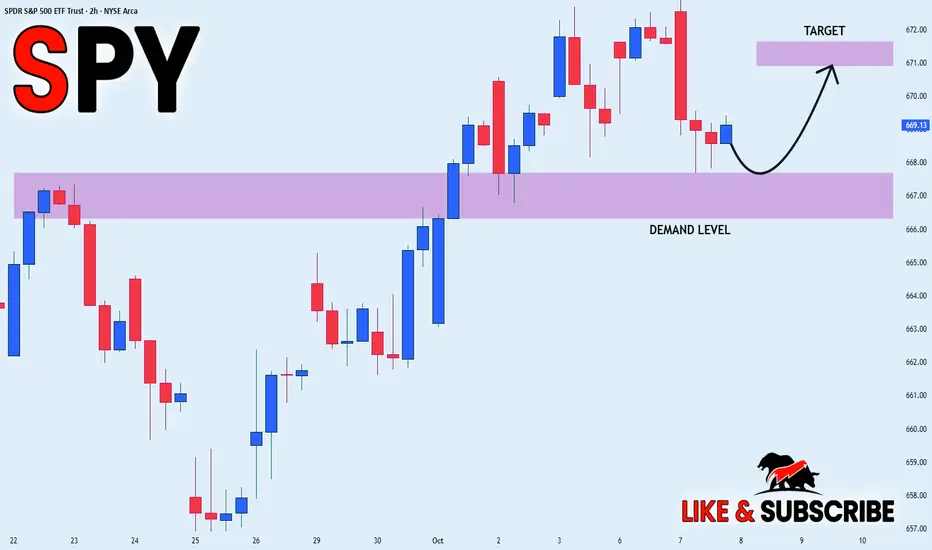
SPY: Bullish Continuation & Long Trade
SPY
- Classic bullish formation
- Our team expects growth
SUGGESTED TRADE:
Swing Trade
Buy SPY
Entry Level - 653.12
Sl - 649.92
Tp - 659.88
Our Risk - 1%
Start protection of your profits from lower levels
Disclosure: I am part of Trade Nation's Influencer program and receive a monthly fee for using their TradingView charts in my analysis.
❤️ Please, support our work with like & comment! ❤️

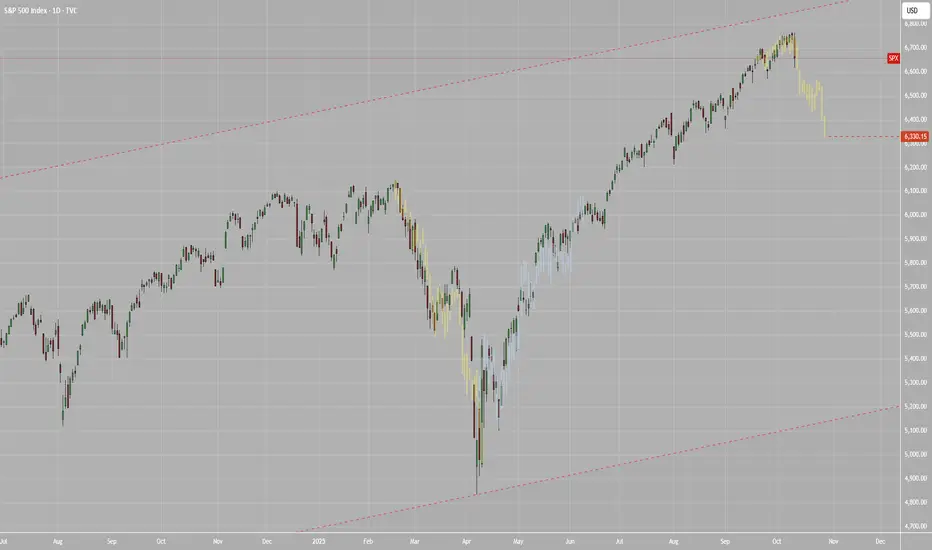
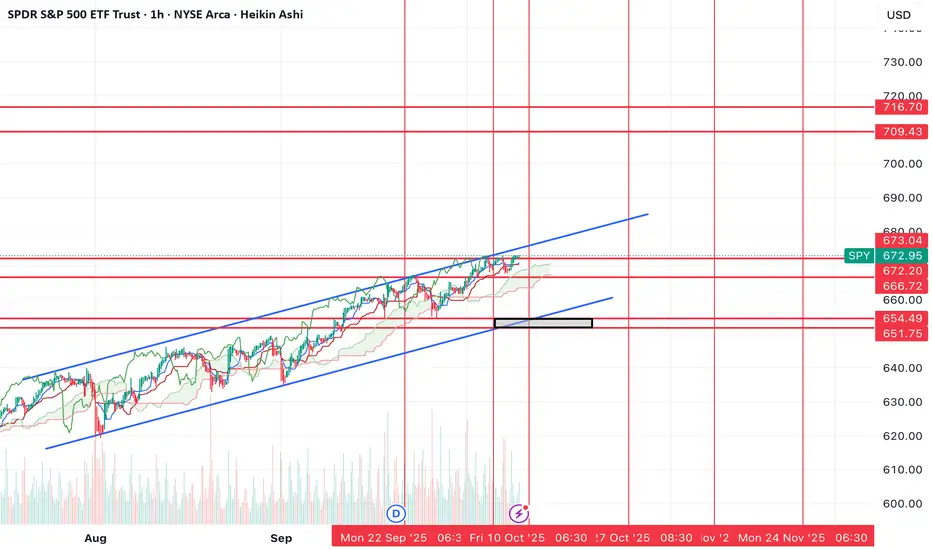
S&P 500 - Buy Zone PlanThe S&P 500 remains in a strong long-term uptrend, trading within a rising channel. After months of steady gains, price has now pulled back sharply from the top of the channel — a healthy correction within the bigger trend.
🔹 Buy Targets
• Target 1 (Buy Zone): ~6,400 – first key support near the 50 SMA
• Target 2 (Buy Zone): ~6,200 – aligning with the 100 SMA
• Target 3 (Worst Case – Buy): ~6,000 – near the 200 SMA and major trendline support
These levels represent staggered accumulation points, allowing for gradual buying if the correction deepens.
🔹 RSI View
The RSI has dropped near 40, showing a cooling-off phase. If it dips below this level, it could signal oversold conditions and mark a potential bottom.
🔹 Outlook
• The pullback looks like a gap-fill and mean reversion within the uptrend.
• I’ll look to accumulate quality U.S. stocks around these targets, focusing on strong fundamentals and large-cap names.
• The broader structure stays bullish unless the 200 SMA breaks decisively.
🧠 “Pullbacks in bull markets are opportunities, not threats.”
📜 Disclaimer: This is general information only and not financial advice. Always do your own research before investing.

Stock Market Forecast | TSLA NVDA AAPL AMZN META MSFTStock Market Forecast | CME_MINI:NQ1! CME_MINI:ES1! SP:SPX NASDAQ:NDX
Mag 7 | TSLA NVDA AAPL AMZN META MSFT GOOGL

SPY The Target Is UP! BUY!
My dear followers,
I analysed this chart on SPY and concluded the following:
The market is trading on 653.12 pivot level.
Bias - Bullish
Technical Indicators: Both Super Trend & Pivot HL indicate a highly probable Bullish continuation.
Target - 660.90
Safe Stop Loss - 649.43
About Used Indicators:
A super-trend indicator is plotted on either above or below the closing price to signal a buy or sell. The indicator changes color, based on whether or not you should be buying. If the super-trend indicator moves below the closing price, the indicator turns green, and it signals an entry point or points to buy.
Disclosure: I am part of Trade Nation's Influencer program and receive a monthly fee for using their TradingView charts in my analysis.
———————————
WISH YOU ALL LUCK
S&P 500 (US500) Multi-Timeframe StrategyS&P 500 (US500) Technical Analysis | October 11, 2025 UTC+4 Multi-Timeframe Strategy
Closing Price: 6,508.2 | Market Context: Trading at all-time highs with institutional accumulation evident
Market Structure Analysis
The S&P 500 demonstrates robust bullish momentum, having broken through the critical 6,500 psychological barrier. Daily chart reveals a mature impulse wave in Elliott Wave terminology (Wave 5 extension), supported by expanding volume profiles. Wyckoff analysis indicates we're in a Phase E markup following successful re-accumulation between 5,800-6,200. The Ichimoku cloud on 4H timeframe shows price trading above all components (bullish alignment), with Tenkan-sen (9-period) at 6,485 providing dynamic support. Gann analysis using the Square of 9 identifies 6,528 as the next natural resistance level, with time-price squaring suggesting October 15-17 as a potential pivot zone.
Technical Indicators Confluence
RSI (14): Daily = 68 (approaching overbought but not extreme), 4H = 71 (caution zone).
Bollinger Bands: Price riding the upper band on 4H (expansion phase), suggesting continuation with potential volatility.
VWAP Analysis: Anchored from October 1st shows strong positioning above 6,465; volume profile indicates acceptance above 6,480 with 82% bullish volume dominance. Moving Averages: Golden cross intact (50 EMA > 200 EMA by 340 points), 21 EMA at 6,470 acting as immediate support. Harmonic pattern detection reveals a potential Butterfly completion near 6,550-6,580 zone (1.272-1.618 Fibonacci extension).
Critical Levels & Pattern Recognition
Support Structure: 6,485 (Tenkan-sen + 4H demand), 6,465 (VWAP anchor), 6,440 (daily pivot + Gann 45° angle), 6,400 (psychological + Wyckoff spring test). Resistance Zones: 6,528 (Gann Square of 9), 6,550-6,580 (Butterfly PRZ + 1.618 extension), 6,620 (weekly resistance). Pattern Alert: Watch for potential bull trap formation if price spikes above 6,580 on declining volume—this would signal exhaustion. Current candlestick structure shows consistent higher highs/higher lows with no reversal patterns (no shooting stars or bearish engulfing yet).
Intraday Trading Strategy (5M-4H Charts)
BUY ZONES: Primary entry: 6,485-6,495 (confluence of Ichimoku + VWAP support) | Stop Loss: 6,465 (risk 20-30 points) | Targets: T1: 6,520 (quick scalp, 25 points), T2: 6,545 (risk-reward 1:2), T3: 6,575 (swing extension). Secondary Entry: Aggressive long on breakout above 6,528 with volume confirmation (minimum 20% above 20-period average) | Stop: 6,510 | Target: 6,565-6,580.
SELL/SHORT ZONES: Counter-trend short only if rejection at 6,580 with bearish divergence on RSI + shooting star formation | Entry: 6,575-6,585 | Stop: 6,595 | Target: 6,520, 6,485. Intraday Bias: 75% bullish until broken below 6,465.
Swing Trading Strategy (Daily-Weekly)
Position Building: Accumulate on pullbacks to 6,440-6,465 zone (25-35% position) with 4-6 day holding period | Full position stop: 6,390 (swing low violation). Profit Targets: Conservative: 6,580 (exit 50%), Aggressive: 6,650-6,720 (monthly target based on Elliott Wave projection and Gann time cycles suggesting completion by October 28-31). Risk Management: Trail stops below each daily higher low; current trail at 6,465. If price closes below 21 EMA on daily (6,470), reduce exposure by 60%. Wave Count: Currently in Wave 5 of (5) of larger degree—expect final parabolic move but prepare for 8-12% correction when complete (target retracement to 5,950-6,050 zone).
Market Context & Catalyst Watch
Geopolitical landscape shows stabilization in Middle East tensions, supporting risk-on sentiment. Fed policy remains neutral (hold position), but monitor October 17th retail sales data and October 23rd PMI releases—strong data could push us to 6,650; weak data triggers profit-taking. VIX at 13.2 (complacency zone) suggests low fear but increases gap-risk. Volume analysis critical: Declining volume on new highs would confirm distribution (Wyckoff Phase E to Phase A transition)—watch for volume 25% below 20-day average as warning signal. Institutional flow data shows continued net buying but decelerating pace.
Execution Playbook
Monday-Tuesday: Expect consolidation 6,485-6,520; ideal for range scalping. Wednesday-Thursday: Gann time window suggests volatility expansion; breakout likely. Friday: Monthly options expiry could create pinning effect near 6,500. Best trades: Long on dips to 6,485-6,495 with tight stops OR breakout long above 6,528 on volume. Avoid: Chasing above 6,550 without pullback; shorting below 6,580 without clear reversal confirmation. Risk no more than 0.5-1% account per intraday trade, 2% for swing positions. This market rewards patience at support and aggression at breakouts—trade the plan, not emotions.

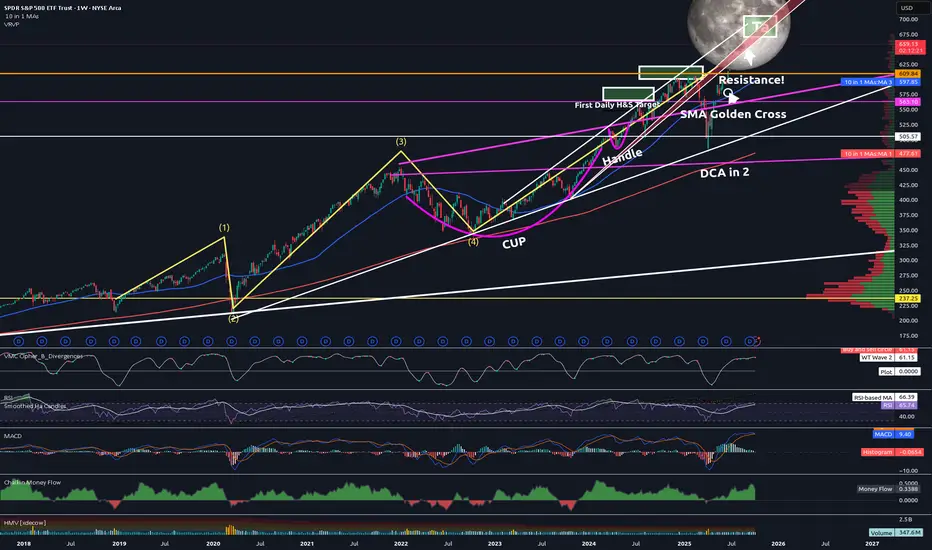
SPY Reaches 2-year Final Target #3 (670) and DropsTrading Fam,
I promised a video update this week. However, due to unforeseen issues with my streaming app, I have opted for a static post instead. Apologies but I'll go through updates on our chart, explaining where we are, and where we might be headed next.
We'll start here with the weekly. I want you to focus in on the yellow Elliot Wave pattern. All along I have stated that I am no Elliot Wave expert. However, I seem to have gotten it right this time ...at least so far.
The first wave starts around Dec. of 2018. We dipped harshly during COVID and that completed our wave (2). The third wave is often long and extended and we hit our top in Jan. 2022. Wave (4) then gave us our dip and the start of our Cup and Handle seen in pink. I don't know much but I do know wave (5) is often equal or greater than (3). I started looking for a final target for wave (5). My Cup and Handle soon offered that target to me.
So now let's zoom into the daily:
You can see Target #1 was nearly hit. You'll remember I sold here due to nearly touching that white uptrend. I waited for the dip back into support (RED) and re-entered focusing in on Target #2 which also coincided with price hitting that white trendline and being rejected. We bounced on that red support again and double-topped. This time we broke through our red support and came all the way down to another support which I expected to hold (white). It did. I then knew we were on our way to Target #3. But I've stated all along that I did not think we'd break back above that previous red support which now has become massive resistance. So far, I have been right. The Cup and Handle pattern also gave me that 670-700 target. Nailed that as well.
Could we go higher? Absolutely. That's what blow-off tops do. They often surprise the market with one final wild ride. Everyone piles in out of FOMO. And I have expected a final price of up to $700 SPY all along. Will this happen? Remains to be seen. But my experience has taught me that we are near the top. And since, I am satisfied with a price of $670 being that this is the beginning of my third and final target box, I pulled most of my personal money out a few days ago. My main goal now is to avoid greed and preserve capital. That is what I will do until the market tells me otherwise.
I want to take one final look at our monthly chart:
See that thick white trendline that starts in 2009? That is the beginning of our secular bull market. This next part is going to sound insane but that is often the case when you read what I write, we could technically drop all the way down to SPY 300, over 55% from where we are right now, and STILL be in a bull market! Can you imagine how many traders will start to scream that the world is ending? And yet, technically the market will remain bullish. Crazy to think about, but definitely worth noting.
✌️Stew
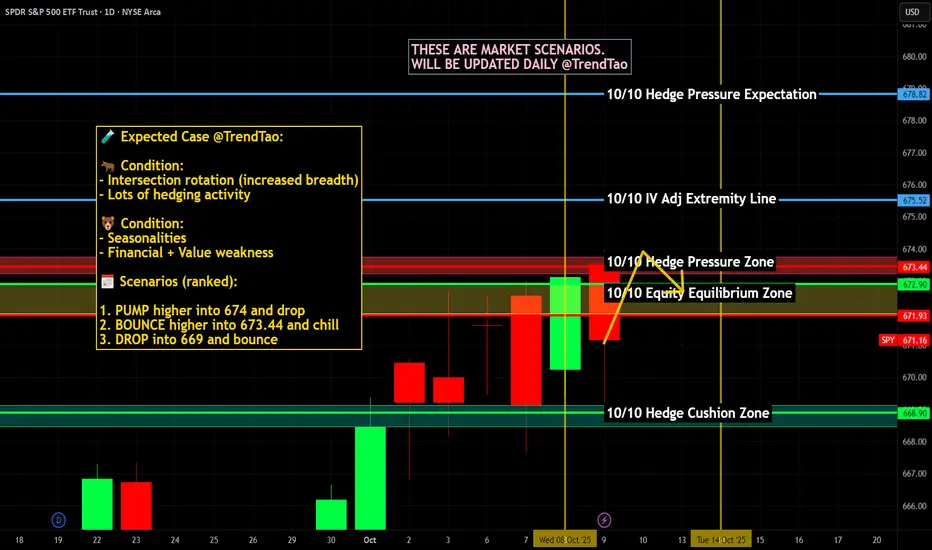
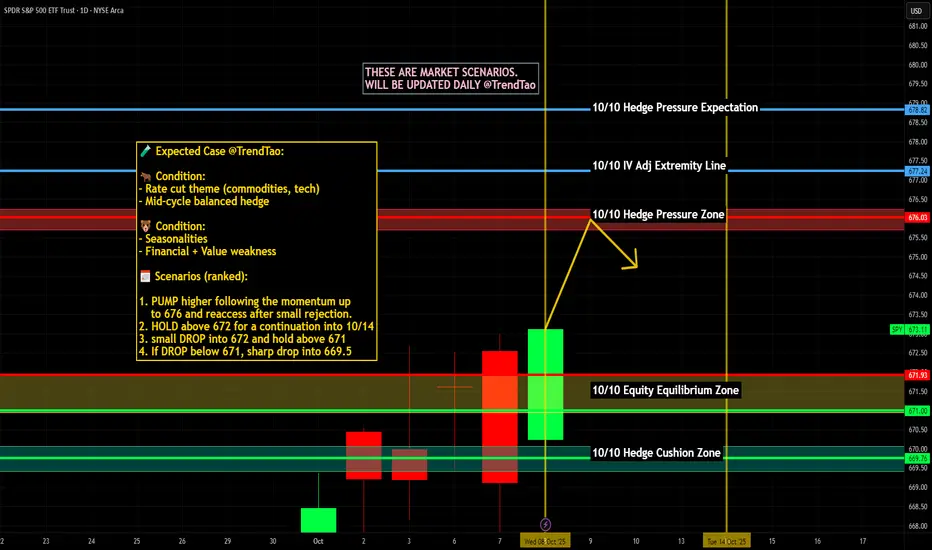
$SPY / $SPX Scenarios — Friday, Oct 10, 2025🔮 AMEX:SPY / SP:SPX Scenarios — Friday, Oct 10, 2025 🔮
🌍 Market-Moving Headlines
🚩 Consumer pulse check: UMich prelim sentiment drops back into focus — inflation expectations will steer bond yields & risk tone.
📉 Shutdown drag: Budget data may stay delayed — leaving traders to anchor on Fed commentary & macro positioning.
💬 Fed watch: Goolsbee’s remarks could frame how policymakers interpret slowing sentiment versus resilient inflation.
💻 End-week flows: Re-balancing pressure + light liquidity could magnify afternoon swings in AMEX:SPY and $QQQ.
📊 Key Data & Events (ET)
⏰ 9:45 AM — Austan Goolsbee (Chicago Fed) opening remarks
⏰ 🚩 10:00 AM — UMich Consumer Sentiment (Prelim, Oct) — Forecast 60.4 | Prior 53.5
⏰ 2:00 PM — Monthly U.S. Federal Budget (Sept) subject to delay due to shutdown
⚠️ Disclaimer: Educational / informational only — not financial advice.
📌 #trading #stockmarket #SPY #SPX #Fed #Goolsbee #UMich #sentiment #budget #shutdown #bonds #Dollar #economy #megacaps
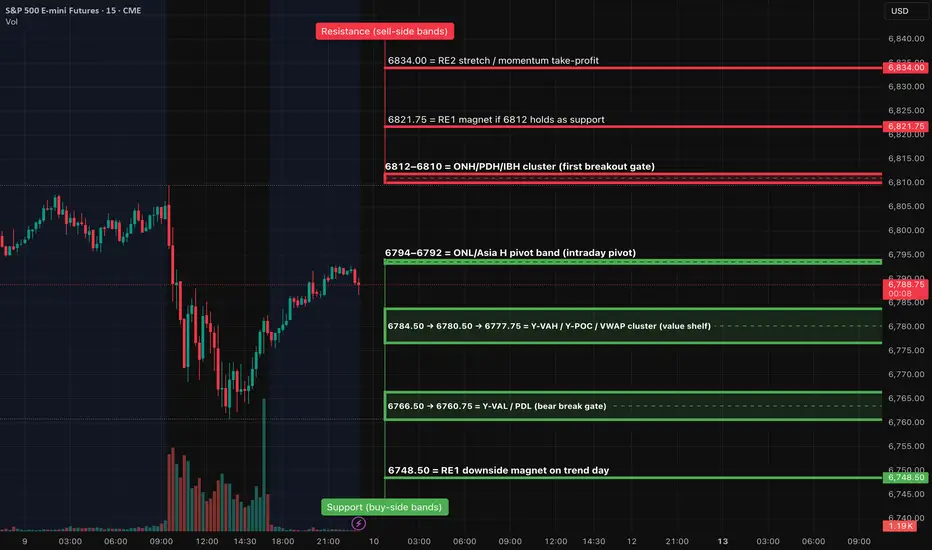
ES (SPX, SPY) Analyses, Key Zones, Setups Fri (Oct 10)Session Roadmap (London → NY)
London (02:00–05:00 ET): Expect balance 6792–6807. A sustained London hold above 6802–6805 increases odds of a pre-NY probe into 6809–6812. A London slip below 6784.5 shifts risk to a VWAP check 6777–6780 and potentially 6766–6761 into NY AM.
NY AM (09:30–11:00): Two-way opening likely unless 6812 converts rapidly; watch 9:45–10:05 for the sentiment print impulse.
NY PM (13:30–16:00): If morning sets a trend, expect continuation toward RE1/RE2; otherwise back-to-value rotations inside 6780–6795.
TIER-1 (A++) — Breakout LONG above PDH/ONH
Trigger: 15m full-body close above 6810–6812, then a 5m hold/re-close with HLs.
Entry: 6810.75–6812.25 on the first clean retest/hold.
Invalidation (hard SL): 6804.75 (below retest & today’s open region).
TPs: TP1 6821.75 (RE1), TP2 6834.00, TP3 6841.25.
TIER-1 (A++) — Breakdown SHORT through Y-VAL/PDL
Trigger: 15m full-body close below 6766.5 and then 6760.75, with a 5m retest 6764–6766 that fails.
Entry: 6764.00–6766.00 on the rejection.
Invalidation (hard SL): 6772.50 (back above value shelf).
TPs: TP1 6748.50, TP2 6736.50, TP3 6729.00.
TIER-2 (A+ Bounce) — Quick-reclaim LONG at Value Shelf
Trigger: Fast flush into 6777–6780 with a 1m reclaim of 6780.5 and 5m re-close above.
Entry: 6778.00–6780.50 after the reclaim.
SL: 6771.25.
TPs: TP1 6792.75 (Asia H pivot), TP2 6805.50 (today’s open/nearby shelf), runner eye 6810–6812 if momentum.
TIER-3 (A Bounce) — Exhaustion-flush LONG at PDL
Trigger: Liquidity sweep 6758–6752 that reclaims 6761 on 1m and 5m holds.
Entry: 6754–6756 on the reclaim.
SL: 6750.75.
TPs: TP1 6777.75 (VWAP), TP2 6789–6792 (pivot band).
===
Price-Path Scenarios (most to least likely)
Balance → Break Probe: Early churn inside 6792–6807; successful lift through 6810–6812 post-10:00 unlocks 6821.75 (RE1).
Fade to Value: Early rejection at 6809–6812 leads to a drift back into 6784/80 → 6777.75; buyers defend value and keep the range intact.
Bear Extension (data-shock needed): Clean 15m close below 6766.5/6760.75 opens 6748.50 with potential follow-through to 6736.50.
Day 48 — Trading Only S&P Futures | Risk Down, Focus UpRecap & Trades
Day 48 — I slept 10 hours to recover from the flu, woke up a bit foggy, and just eased into the day.
Took my time reviewing market structure and waited for clean confirmation before taking any trades.
The 11:40 VXAlgo DD Sell Signal lined up perfectly with the bearish flip and 10-min MOB zone — I shorted the recovery and let the market do the work.
Missed a few bottom orders, but overall execution was clean and controlled.
Lesson & Mindset
The key lesson today: when you’re on a hot streak, the best move isn’t to press harder — it’s to protect the gains.
That’s why I’m reducing my position size for the next few sessions. This isn’t about making more; it’s about keeping what I’ve earned.
News & Levels
Headline: The IRS plans to furlough 34,000 employees as the U.S. government shutdown continues — something to keep an eye on for market volatility.
Tomorrow’s levels: Above 6785 bullish, below 6765 bearish.

Why traders are losing money? Position Size PurposeWhy traders are losing money
Most traders do not lose because the market is hostile or because entries are bad. They lose because the size of each position is out of sync with account size, with volatility, and with a realistic pain threshold. They also stack correlated exposure until a normal downswing becomes a career ending drawdown. The fix is a repeatable sizing process that keeps losses small, keeps risk per trade constant across regimes, and caps total open risk across the book.
Root causes of loss clustering
Risk per trade that is too large for the real account balance that is available for trading
Stops that ignore volatility so a quiet week and a fast week carry the same unit count while loss size swings wildly
Portfolio heat that compounds across correlated positions in the same theme or factor
Inconsistent exits so a written stop is moved or ignored after the position is open
Scaling rules that add size before the trade earns the right to carry more risk
A review loop that tracks money rather than R so results are not comparable across instruments
One principle to anchor the lesson
Risk lives in the distance between entry and stop. Size lives in how much money you are willing to risk on that distance. Everything else is detail. When you fix these two elements the account stops bleeding from one mistake and the equity curve starts to respect your personal pain limits.
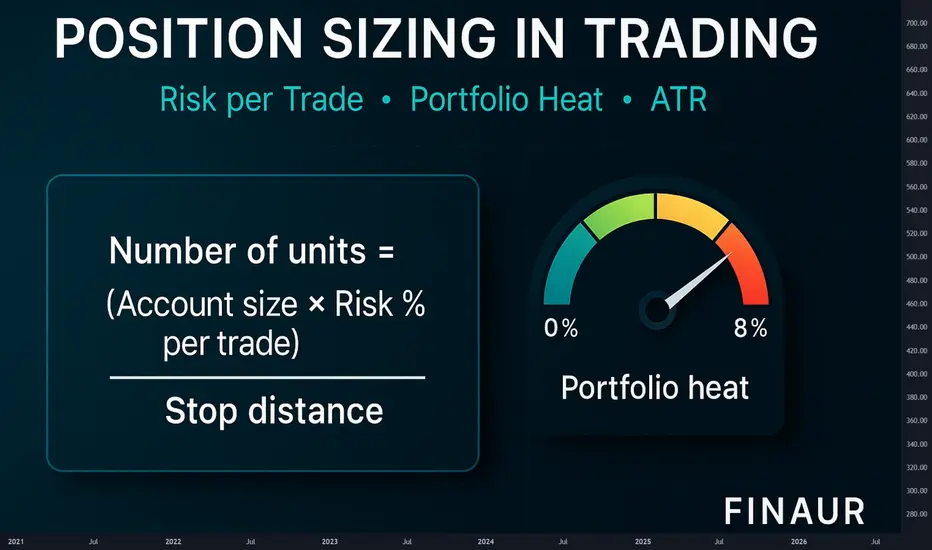
The unit formula in plain words
Units equals Account times Risk percent divided by Stop distance
Stop distance equals Entry minus Stop in price units
For futures or forex convert the distance to money with tick or pip value before you divide
Round the result to the venue step size
Percent risk formula and worked example
Set a realistic risk percent
Pick a range between zero point two five and one point zero percent of account per trade
If you are new stay closer to zero point two five
If you are experienced and you follow rules under pressure stay near zero point five to one point zero
Use only capital that is truly available for trading
Define the stop with intent
You can define a stop by price structure or by volatility. Structure is a level that invalidates the setup. Volatility is a multiple of the average true range. Both work if you keep the rule stable. The aim is not to predict a perfect level. The aim is to measure distance so you can compute size with precision and keep loss per trade constant in money terms.
Volatility aware sizing
When the average true range doubles you must expect larger swings. If you keep the same unit count the same entry to stop distance will cost twice as much. A simple way to neutralise this effect is to tie the stop to a multiple of the average true range and then let the unit count float. When volatility rises the unit count shrinks. When volatility calms the unit count grows. Risk per trade stays constant.
Practice example
Risk money equals one hundred
Stop distance equals three point zero in a calm regime
Units equals one hundred divided by three which is thirty three units rounded
If volatility doubles and the stop distance becomes six point zero the new unit count becomes sixteen units rounded
Loss per trade stays near one hundred in both regimes
Portfolio heat in clear numbers
Portfolio heat is the sum of risk money across all open trades as a percent of account. If you allow the sum to balloon during correlated trends you are betting the entire account on one theme. A simple cap keeps you in business.
Set a heat cap between four and eight percent of account
Count correlated positions as one theme for heat
If a new trade would push heat above the cap you must reduce size or defer the trade
Keep a cash buffer for slippage and gap risk
Heat includes correlated risk. Keep combined open risk under your limit
R multiple as the common unit
R is the unit that equals your risk per trade. If you risk one hundred then one R is one hundred. A two R gain is two hundred. A one R loss is one hundred. Because R normalises money across instruments and timeframes you can compare strategies without confusion. When you review your trades in R the mind stops obsessing about price and starts focusing on process.
Expectancy in words and numbers
Expectancy is the average R result per trade. It depends on win rate and payoff ratio. You do not need equations to grasp it. You can compute it with simple mental math.
Practice example A
Win rate equals forty five percent
Average win equals two point two R
Average loss equals one point zero R
For every ten trades wins contribute nine point nine R and losses subtract five point five R
Expectancy equals four point four R per ten trades or zero point four four R per trade before fees
Practice example B
Win rate equals thirty five percent
Average win equals three point zero R
Average loss equals one point zero R
For every ten trades wins contribute ten point five R and losses subtract six point five R
Expectancy equals four point zero R per ten trades or zero point four R per trade before fees
The shape of expectancy changes when volatility changes. If you keep risk per trade constant and let the unit count respond to stop distance expectancy measured in R will be more stable across regimes. That stability translates into better position control and calmer decision making.
Why money management fails in practice
Traders set a risk percent but do not compute units from entry and stop before the order
They move the stop after position entry and invalidate the size calculation
They add to losers because the entry feels almost right and average down risk with no plan
They never reduce size after a loss streak so the book enters a feedback loop where a normal downswing becomes a spiral
They treat wins as proof of skill and losses as anomalies rather than counting both in R and accepting variance
A position sizing workflow you can follow every time
Write the setup and the trigger in one line
Define the stop with a structure rule or with a multiple of the average true range
Measure the stop distance in price units
Select the risk percent that fits your current equity and your mental state
Convert the stop distance to money if the instrument uses ticks or pips
Compute units as Account times Risk percent divided by Stop distance
Round to the venue step size and check that the notional fits practical constraints
Place the order only after the number of units is in the ticket and the stop is written
Scaling with intent
Scaling is not a trick to force a trade to work. Scaling is a way to stage risk through time. The rule is simple. Add size only after the trade earns the right to carry more risk. Reduce risk when momentum fades or when volatility rises.
One simple scale plan
Enter half size when volatility is rising or when the theme is crowded
Add the second half only after the trade moves one R in your favour
Move the stop to reduce open risk when the second half is added
Do not exceed the heat cap across the book after the add
Compute size. Check heat. Execute only if rules align
Comparator versus buy and hold
Buy and hold does not respect a personal pain limit. It lets drawdown float with price. A sized trade fixes the maximum loss in money terms at the start. The difference is not ideology. The difference is the choice to survive.
Practice scenario
Price falls ten percent after entry in a fast regime
A buy and hold position shows a ten percent account drawdown if one position equals the entire account
A sized trade with one percent risk shows a one percent account drawdown by design
The sized trade can take many attempts because capital is preserved for the next signal
Kelly fraction and optimal f cautions
Kelly and optimal f are powerful in theory. They aim to maximise growth for a known edge. Real trading edges drift and sample sizes are small. Full Kelly creates deep drawdowns and can trigger a behavioural spiral. If you decide to use these methods treat the fraction as a ceiling rather than a target and remain near half Kelly or less. Always measure drawdown in R and reduce size after a loss streak.
Loss streak protocol
Loss streaks are part of variance. A simple protocol keeps them from damaging your decision cycle.
After four consecutive losses reduce risk per trade by half
Freeze adds and focus on clean entries only
Review the last ten trades in R and tag any rule violations
Return to the base risk percent only after a new equity high or after a full week of clean execution
Heat management across themes
The book is a living system. A theme can be a sector a factor a style or a macro driver. If four positions express the same theme treat them as one for heat. The market does not care that the tickers differ. Correlation in stress is the rule. The heat cap is your defence against that correlation.
Fees and slippage discipline
Small edges die from friction. If your average win is near one R and your average loss is near one R you must protect that edge by keeping fees and slippage small. Choose venues with adequate liquidity. Avoid market orders during news bursts. Use limit orders to control entry and exit where practical. Assume a realistic round trip fee in your backtests so that live results match expectations.
Journaling that actually helps
Your journal should capture rules and numbers rather than emotions alone. Use a compact template.
Setup name and trigger
Entry price and stop price
Risk money and unit count
Reason for the stop placement
Exit reason and realized R
Any deviation from the plan
Practice drills to build fluency
Speed matters during live markets. These drills train your sizing reflexes.
Drill one. Percent risk to units
Account equals twenty thousand
Risk equals one percent which is two hundred
Stop distance equals zero point eight
Units equals two hundred divided by zero point eight which is two hundred fifty units
Drill two. Volatility step change
Risk equals one hundred fifty
Stop at two average true range equals three point two which gives forty six units rounded
If the average true range rises by fifty percent the stop becomes four point eight and units become thirty one rounded
Loss per trade remains near one hundred fifty
Drill three. Futures or forex conversion
Risk equals three hundred
Stop equals twenty ticks
Tick value equals twelve point five
Stop distance in money equals two hundred fifty
Contracts equals three hundred divided by two hundred fifty which is one contract with a small buffer for slippage
Drill four. Heat check
Four open trades at one percent risk each looks like four percent heat
If three of them are the same theme treat them as one for heat
Effective heat is closer to three percent and a new trade in that theme should be deferred
Checklist before every order
Is the setup valid according to the written rule
Is the stop defined by structure or by a multiple of the average true range
Have you measured the stop distance correctly
Is the risk percent chosen and written on the ticket
Are units computed from Account times Risk percent divided by Stop distance
Does the book stay under the heat cap after this order
Are you in a loss streak that requires reduced size
Common myths to retire
Myth. Bigger size proves conviction. Reality. Bigger size proves you have abandoned process
Myth. A tight stop is always better. Reality. A stop that ignores volatility will be hit by noise
Myth. Averaging down improves price. Reality. Averaging down expands risk without proof that the idea is valid
Myth. A few big winners will save the month. Reality. A few big losers can end the year
How to adapt across timeframes
The rules above are timeframe agnostic. Shorter timeframes require tighter execution and more attention to fees. Longer timeframes require more patience and a wider cash buffer for gaps. In both cases the math does not change. You measure distance. You set risk money. You compute units. You respect the heat cap. You review in R.
Edge drift and regime change
Edges do not vanish overnight. They drift when the crowd learns the pattern or when macro drivers shift. Your sizing process makes you resilient to drift. Because risk per trade is fixed a flat or negative edge bleeds slowly and gives you time to notice and step back. If you see expectancy in R slide over a thirty or fifty trade sample reduce size and review the rule set before you push the gas again.
Putting it all together
A trader who sizes by feel can enjoy a series of quick gains and then give it back in one week. A trader who sizes by rule can be wrong half the time and still grow steadily. The difference is not superior prediction. The difference is the choice to define loss before entry to respect volatility and to cap heat so a cluster of normal losers does not become a personal crisis.
A compact template you can copy
Setup name and timeframe
Entry trigger in one sentence
Stop rule. Structure or two average true range or another clearly written rule
Account and risk percent
Stop distance in price units and in money
Units computed and rounded to step size
Heat check across the book and across the theme
Planned targets in R and exit rules
Bottom line
Risk per trade must be small and stable
Stops must respect volatility
Portfolio heat must remain inside a hard cap
Review results in R and adjust size after loss streaks
Let the unit count float with volatility so risk money per trade remains constant
Education
Education and analytics only. Not investment advice. Test every rule with historical data before risking capital. The lesson below is theory with practice drills you can apply to any liquid instrument and any timeframe.
TSLA BULLISH OCT 9 2025There is a lot of bullish momentum in Tesla at current price. Price action is always superior .
If you dont understand a trade then dont enter in it trusting me or any stranger as this is your hard earned money. Missing a trade is not the end of the world.
Its a trade so,
STOP LOSS means Stop my loss
Trade:
Entry- curren price
SL-$416 close
Target-$460 min

ES (SPX, SPY) Analyses, Key Zones, Setups for Thu, Oct 9Market Drivers (ET)
• 08:30 — Fed Chair Powell: pre-recorded welcoming remarks at the Community Bank Conference. risk flag
• 08:30 — Initial Jobless Claims: suspended while the federal government remains shut down; will publish only if funding is restored before release time.
• 08:35 — Fed Vice Chair for Supervision Bowman: opening remarks (same conference).
• 09:45 — Treasury Sec. Bessent remarks & fireside chat (conference item; headline risk is modest).
• 10:30 — EIA Weekly Natural Gas Storage (standard Thursday slot).
• 11:30 — Treasury 4- & 8-week bill auctions (regular Thursday bills).
• 13:00 — Treasury 30-Year Bond (reopening) auction.
• All day: Other conference sessions (payments, community-bank panels; closing remarks late afternoon) may generate minor tape headlines.
A++ Setups (NY kill-zones: 09:30–11:00 & 13:30–16:00)
1) Breakout Continuation LONG (Tier-1 A++) — 6,809 unlocks
Trigger: 15m full-body close above 6,809, then 5m holds a retest 6,803–6,806 and re-closes up.
Entry: 1m higher-low on the retest hold.
Invalidation: Hard SL just below the 15m trigger-wick (±0.25–0.50 pts).
Targets: TP1 6,828–6,832, TP2 6,844–6,848, stretch 6,895± if trend day forms.
2) Rejection SHORT (Tier-1 A++) — Fail at 6,803–6,809
Trigger: Sweep/fail above 6,803–6,809 → 15m closes back inside ≤6,803; 5m forms a lower-high and re-closes down.
Entry: 1m LH after the 5m re-close.
Invalidation: Hard SL a tick beyond the rejection wick.
Targets: TP1 6,789, TP2 6,766–6,759, stretch 6,738–6,733.
Market Update and Trading Insight
Overnight Analysis:
As we enter the London session, we should expect a balanced trading range between 6,789 and 6,806. If we can hold above 6,797 as we transition into the European market, this may set the stage for a pre-New York move targeting the 6,803 to 6,809 area. Any shallow pullbacks that maintain the 6,797 to 6,799 support level will likely keep the bullish trend intact.
08:30 ET (Powell Speech - Pre-recorded):
The potential for significant market movements at this timing appears modest. Since there is no jobless claims data this week, we anticipate that the typical volatility around 08:30 will be lighter than usual. Should Powell's comments come across as neutral, expect trading activity to focus more on market levels and flows rather than on hard data.
2-3% selloff incoming? Down to $651-655? Then BTD to $700+We've finally hit my target of $672 and while I still think we'll get downside after hitting this target, I don't think the sell will be as dramatic (yet).
I know everyone got bulled up after the price action today, but I think it's wise to be cautious here. Both the chart and the flows are telling me that we're likely to see a bearish move before we see more upside in markets.
I'm not looking for anything crazy, but I think 2-3% down to that $651-655 level is likely.
Then I think that will be a dip buying opportunity and that it's likely that many stocks (including SPY) can see new highs.
I've marked off new resistance levels should this idea play out.
Losing the support levels on the chart would be a caution for lower prices.
$SPY / $SPX Scenarios — Thursday, Oct 9, 2025🔮 AMEX:SPY / SP:SPX Scenarios — Thursday, Oct 9, 2025 🔮
🌍 Market-Moving Headlines
🚩 Powell spotlight: The Fed Chair’s morning remarks set the tone for risk sentiment — traders watching for policy bias hints.
💬 Fed overload: Bowman, Kashkari, Barr, and Daly dominate the docket — expect intraday rate-path chatter.
📉 Shutdown shadows: Jobless Claims* and Inventories* may face data delays; market liquidity remains headline-driven.
💻 Macro rotation: AMEX:SPY trades tightly to yield moves; tech leadership faces cross-currents as real rates stay firm.
📊 Key Data & Events (ET)
⏰ 🚩 8:30 AM — Fed Chair Jerome Powell opening remarks
⏰ 🚩 8:30 AM — Initial Jobless Claims (Oct 4) subject to delay
⏰ 8:35 AM — Michelle Bowman (Fed Vice Chair for Supervision) welcoming remarks
⏰ 8:45 AM — Michelle Bowman speech
⏰ 10:00 AM — Wholesale Inventories (Aug)* subject to delay
⏰ 12:45 PM — Neel Kashkari + Michael Barr discussion
⏰ 3:45 PM — Michelle Bowman speech
⏰ 4:10 PM — Mary Daly (SF Fed) speech
⏰ 9:40 PM — Mary Daly evening remarks
⚠️ Disclaimer: Educational/informational only — not financial advice.
📌 #trading #stockmarket #SPY #SPX #Fed #Powell #Bowman #Kashkari #Barr #Daly #joblessclaims #bonds #Dollar #shutdown #economy #megacaps
SPY STRONG UPTREND|LONG|
✅SPY showing a strong bullish structure with clear rejections from the demand level. Price continues to form higher lows, confirming institutional support and momentum toward the 671$ target zone. Time Frame 2H.
LONG🚀
✅Like and subscribe to never miss a new idea!✅
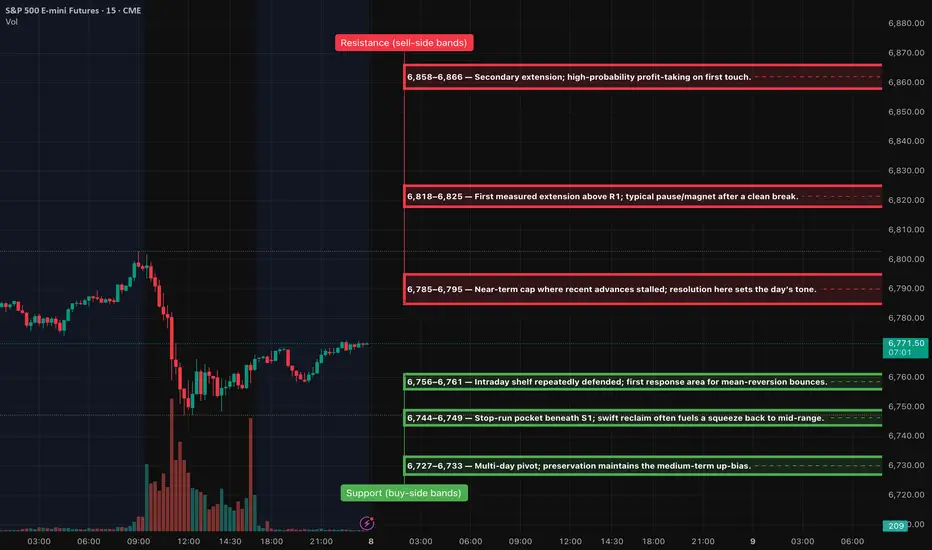
ES (SPX, SPY) Futures Analyses, Key Zones, Setups for Wed, Oct 8The E-mini S&P 500 (ES) is currently exhibiting a primary uptrend on the higher timeframes while consolidating just below a significant resistance level between 6,785 and 6,795. As we approach the New York morning session, the prevailing expectation is for a range-to-trend expansion, dependent on whether the 6,758–6,795 range is broken. The 6,785–6,795 zone should be regarded as the immediate focal point for decision-making.
Event & Risk Calendar (ET)
• 07:00–07:15 — MBA Mortgage Applications (weekly).
• 10:30 — EIA Weekly Petroleum Status Report (standard Wednesday release).
• 14:00 — FOMC Minutes (Sept 16–17 meeting). Expect volatility expansion on release.
A++ Setups (Tier-1, Level-KZ 15/5/1)
1. Trend-Continuation LONG at R1 break
Trigger: 15-minute full-body close above 6,795, 5-minute pullback holds 6,785–6,795, 1-minute higher-low confirms.
Entry: 6,788–6,795 on the retest/hold.
Invalidation: 15-minute body back below ~6,785.
Targets: TP1 6,818–6,825; TP2 6,858–6,866; TP3 6,898–6,905.
Risk: Hard SL = relevant 15-minute wick low −0.25–0.50 pts; take 70% at TP1, runner to BE; max 2 attempts per level.
2. Rejection-Fade SHORT at R1 failure
Trigger: Probe into 6,785–6,795 fails: 15-minute rejection close back below, 5-minute lower-high forms, 1-minute pullback fails.
Entry: 6,785–6,792 on failure.
Invalidation: 15-minute body acceptance above ~6,795.
Targets: TP1 6,756–6,761; TP2 6,744–6,749; TP3 6,727–6,733.
Risk: Same management as Setup 1 (wick-anchored SL; 70/30 at TP1; max 2 attempts).
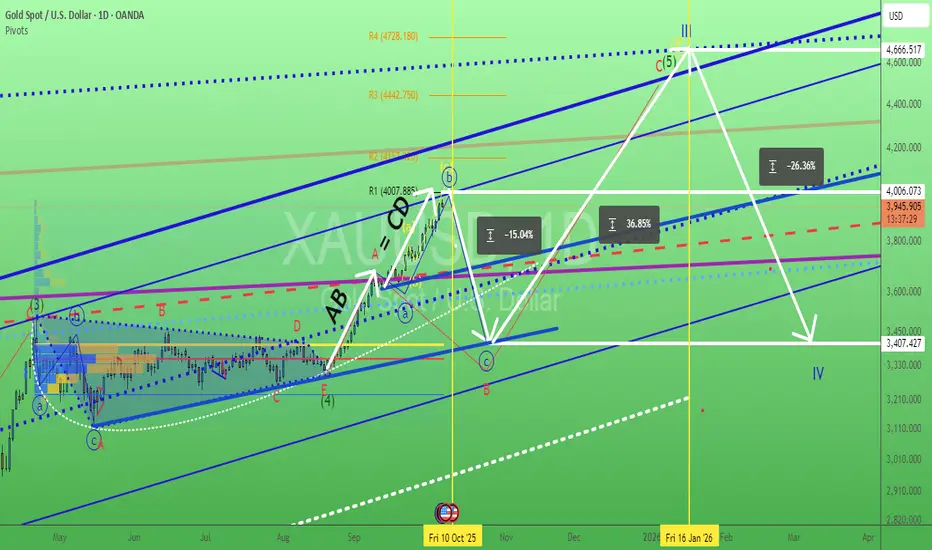
Gold. Waiting NFP trigger? 7/Oct/25XAUUSD nonstop surging need some profit taking? what event trigger the heavy sell off? Coming this Friday delayed NFP? "time / cycle - wise" Look like "some cash out" not just from Gold but also equities market?. 4007.885 are the confluence zone of 1) Monthly R1 2) Parallel Line Resistance 3) AB = CD price volume. and many...P/s all impulsive wave consist of abc subwaves not 1,2,3,4,5 waves
CROX BULLISH OCT 7 2025Crox is looking good here as price has a support from higher time frames. Price is also trying to narrow its range. I am long here . Do not blindly trade any thing
Always manage your risk & then trade

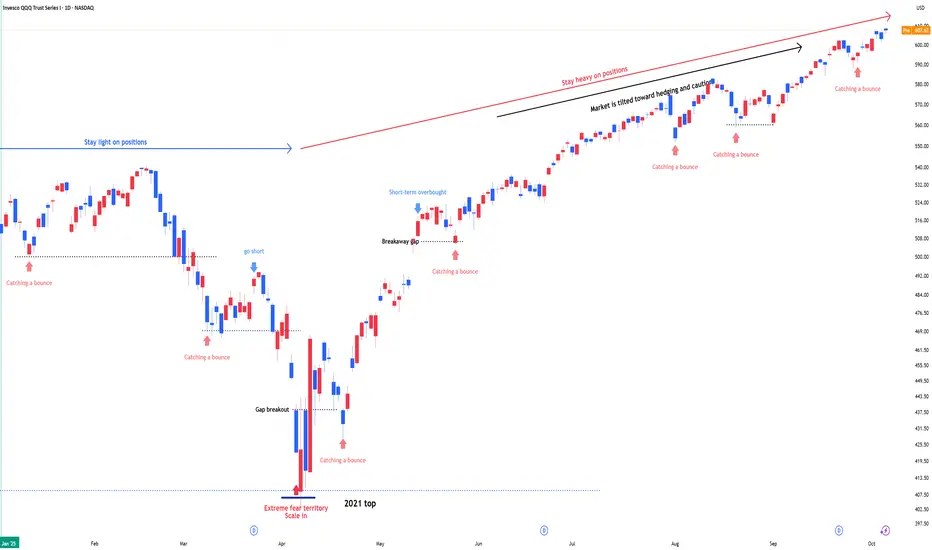
QQQ : Stay heavy on positionsQQQ : Stay heavy on positions (QLD, TQQQ)
Entering a risk-on, high-volatility zone.
In stay light on positions zones, I hold QQQ and reduce exposure.
In stay heavy on positions zones, I increase allocation using a mix of QLD and TQQQ.
** This analysis is based solely on the quantification of crowd psychology.
It does not incorporate price action, trading volume, or macroeconomic indicators.
SPY : Stay heavy on positionsSPY : Stay heavy on positions (2x leverage)
Entering a risk-on, high-volatility zone.
In stay light on positions zones, I hold SPY(+QQQ) and reduce exposure.
In stay heavy on positions zones, I increase allocation using a mix of SSO(+QLD) and TQQQ.
** This analysis is based solely on the quantification of crowd psychology.
It does not incorporate price action, trading volume, or macroeconomic indicators.
